email: tamar@deneb.odessa.ua, val@deneb.odessa.ua 22institutetext: Observatoire de Bordeaux, CNRS UNR 5804, BP 89, 33270 Floirac, France
email: soubiran@observ.u-bordeaux.fr 33institutetext: Max-Planck-Institut für Astrophysik, Karl-Schwarzschild-Strasse 1, D-85741 Garching bei München, Germany
email: claudia@mpa-garching.mpg.de 44institutetext: Istituto Nazionale di Astrofisica (INAF) - Osservatorio Astronomico di Torino, via Osservatorio 20, 10025 Pino Torinese (To), Italy 55institutetext: Department of Physics, University of Perugia, Italy
email: busso@pg.infn.it
Abundances of Cu and Zn in metal-poor stars: ††thanks: Based on the spectra collected with the 1.93m telescope of Haute Provence Observatory clues for Galaxy evolution
We present new observations of copper and zinc abundances in 90 metal-poor stars, belonging to the metallicity range –3[Fe/H]–0.5. The present study is based on high resolution spectroscopic measurements collected at the Haute Provence Observatoire (R= 42000, S/N100). The trend of Cu and Zn abundances as a function of the metallicity [Fe/H] is discussed and compared to that of other heavy elements beyond iron. We also estimate spatial velocities and galactic orbital parameters for our target stars in order to disentangle the population of disk stars from that of halo stars using kinematic criteria. In the absence of a firm a priori knowledge of the nucleosynthesis mechanisms controlling Cu and Zn production, and of the relative stellar sites, we derive constraints on these last from the trend of the observed ratios [Cu/Fe]and [Zn/Fe] throughout the history of the Galaxy, as well as from a few well established properties of basic nucleosynthesis processes in stars. We thus confirm that the production of Cu and Zn requires a number of different sources (neutron captures in massive stars, - processing in low and intermediate mass stars, explosive nucleosynthesis in various supernova types). We also attempt a ranking of the relative roles played by different production mechanisms, and verify these hints through a simple estimate of the galactic enrichment in Cu and Zn. In agreement with suggestions presented earlier, we find evidence that Type Ia Supernovae must play a relevant role, especially for the production of Cu.
Key Words.:
Stars: abundances, nucleosynthesis – Stars: spectroscopy, kinematics: – Galaxy: evolution1 Introduction
The introduction of efficient high-resolution spectrographs on modern telescopes has greatly enhanced our ability to reconstruct the chemical enrichment of the Galaxy, which derives from a gradual melding of the outcomes by various nucleosynthesis processes in stars. This is obtained by the return of new elements into the interstellar medium (ISM) through slow and fast mass loss phenomena, whose relative importance is controlled by several parameters, like the initial stellar mass distribution, the physics of stellar winds, star formation rates, stellar lifetimes, etc. This picture is made even more complex by the different dynamical behavior of the various galactic subsystems in a very clumpy galactic structure, which both sets the time scales of mixing processes in the ISM, and controls the hierarchy of cluster and individual star formation. A galactic evolution model describing all these processes in detail, including the dynamical interactions between subsystems, is still lacking, because of the enormous complexities inherent in such a construction and of the high number of free parameters inevitably involved in it. Unfortunately, for many heavy elements we infer that the mechanisms through which their galactic enrichment was achieved do involve all these ill-modeled complexities, so that for them galactic astrophysics has reached a stage in which observations lead theory by a large distance.
An example of this is provided by Cu and Zn, two elements immediately following the iron peak, for which we present in this paper new measurements for a very large sample (90) of metal-poor stars. In our previous works (Mishenina & Kovtyuk 2001, hereafter Paper I; Mishenina et al. 2001, hereafter Paper II) we investigated the behavior of several heavy elements at different metallicities. The present study on copper and zinc continues those efforts.
¿From the observational point of view, Cu and Zn abundances were early addressed by Gratton & Sneden (1988) and by Sneden & Crocker (1988). Their data favored a primary-like type of production for Zn (i.e. mechanisms yielding constant enrichment relative to iron) and a secondary-like process for Cu (i.e. one requiring iron seeds from previous stellar generations, giving rise to an enrichment proportional to the iron content). Later, further abundances for the two elements in halo and disk stars were provided by Sneden, Gratton, & Crocker 1991, and subsequently by Primas et al. 2000 and Blake et al. 2001. Recently, also some data for Centauri have become available (see e.g. Smith et al. 2000; Cunha et al. 2002; Pancino et al. 2002), together with abundances in single very low-metallicity galactic stars (Westin et al. 2000; Cowan et al. 2002; Hill et al. 2002). Measurements of Zn in damped Ly- systems (see e.g. Pettini et al. 1999; Molaro et al. 2000) complete the list, offering an opportunity to address the production of heavy elements in the Universe at an epoch immediately following Galaxy formation.
Despite those recent integrations, more than a decade has passed since the work by Sneden et al. (1991), who provided the only large sample of Cu and Zn abundances in metal-poor stars of our Galaxy. That work was used repeatedly to investigate the nucleosynthesis of these elements. With the present study we aim at providing a significant update of available database, and at establishing more reliable constraints on the still open problems involved in Cu and Zn formation.
The first schematic description of the chemical evolution of Cu and Zn was proposed by Sneden et al. (1991), who suggested that they might be ascribed mainly to the weak -process. Their conclusions were subsequently questioned by Raiteri et al. (1992) and by Matteucci et al. (1993). In this last work evidence was presented in favor of a large contribution from relatively long-lived processes, tentatively identified as Type Ia supernovae. Contrary to this, Timmes et al. (1995), using the copper and zinc yields of Type II supernova explosion from Woosley & Weaver (1995), suggested that these elements might be synthesized in significant amounts by the major nuclear burning stages in massive stars. These contrasting explanations are an example of the large uncertainties one meets when an incomplete picture of stellar yields and a simplified chemical evolution scheme have to be used for interpreting the data. Simplified, and sometimes purely analytical, chemical evolution models were very useful in the past, before the advent of high resolution spectroscopy (Lynden-Bell 1975; Tinsley & Larson 1978; Tinsley 1980; Clayton 1984). However, they are no longer sufficient today, after more sophisticated and precise measurements have become available.
Waiting for a revision in the nucleosynthesis models, what one can do is to provide a homogeneous set of data, derived with the same methods for many stars, and to compare them with known results for other neutron-rich elements. This is actually the scope of the present work, based on abundances obtained in a homogeneous way for metal-poor stars belonging either to the halo or to the thick disk of the Galaxy. Using the data as a guideline, we shall examine which scenarios for the stellar synthesis of these elements are compatible with the observed trends. As a consistency check, we shall then verify our conclusions through a simple computation of the ensuing chemical enrichment of the Galaxy, making use of the model adopted by Travaglio et al. (1999).
2 Observations and reduction
The observational data for the sample stars were taken from the library of spectra obtained with the ELODIE spectrograph on the 1.93m telescope of the Haute Provence Observatoire (Soubiran, Katz & Cayrel 1998). The resolution of spectra is R = 42,000, signal to noise ratios are always larger than 100, and the spectral region explored is between 4400 and 6700 Å. A preliminary reduction of these spectra was made by Katz et al. (katzet98 (1998)). Further processing was done through the DECH20 software (Galazutdinov gal92 (1992)). A comparison of the equivalent widths (EWs) measured by us with those from other sources in the literature was previously given in Paper I and Paper II, yielding a good agreement.
2.1 Model atmosphere parameters
The effective temperatures (Teff), surface gravities ( g), metallicities and microturbulence velocities (Vt) were determined earlier by us (see Paper I). A comparison of our parameters with those by other authors was discussed in the same work, showing good agreement within the uncertainties. Teff was derived by fitting the wing of the Hα line in the observed and calculated spectra. Synthetic spectra were computed with the STARSP code (Tsymbal tsymbal96 (1996)) and with the grid of atmosphere models of Kurucz (kurucz93 (1993)). The log g values were specified by using the condition of ionization balance between Fe I and Fe II lines. Vt values were obtained by imposing independence from the EW of the abundance derived from each line. The accuracy in the estimate of the microturbulence velocity is 0.2 km/s; corresponding estimates for Teff are 100 K; for 0.3 dex. We note that we re-determined the value of the micro-turbulence velocity for HD 122563, using only the lines with EW 20 mÅ , which are not sensitive to Vt. The new velocity is Vt = 2.2 km/s. As a consequence, for this star the values of [Fe/H] and of the Ba abundance, estimated with the new value of Vt, supersede those previously presented.
3 Copper and zinc abundances and their uncertainties
As indicated previously, abundance measurements were carried out using the atmosphere models by Kurucz (kurucz93 (1993)). Appropriate models for each star were derived by means of standard interpolation through Teff and g. The model metallicities were taken with the accuracy 0.25 dex. See below for comments on the analysis of each element.
3.1 Copper
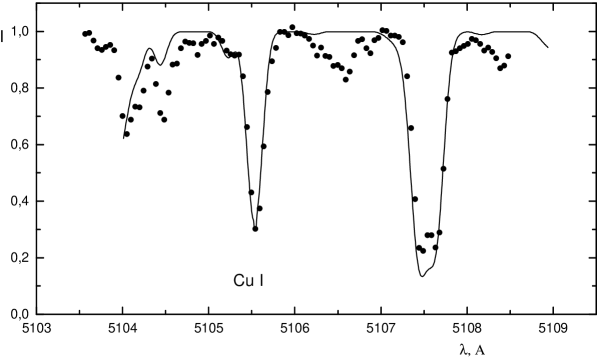
The 5105.54, 5218.20, 5782.12 Å lines of Cu I were used for abundance definition. Synthetic spectra were calculated taking into account the hyper-fine structure of Cu I components (Steffen steffen85 (1985)). Fig. 1 shows a comparison between the observed (dot) and computed (line) spectrum for HD 117876, near the Cu I 5105.54 Åline.
3.2 Zinc
The abundance of zinc was obtained from the 4722.16, 4810.53, 6362.35 Å lines of Zn I. We used the EWs of these lines and the Kurucz’s WIDTH9 model for the determination of the zinc abundance. Oscillator strengths for Zn I lines were taken from Gurtovenko & Kostyk (gurko89 (1989)).
3.3 Kinematics
In order to distinguish disk stars (D) from halo stars (H) by kinematic criteria, we determined the spatial velocities and galactic orbital parameters of our target stars. Table 1 lists the 3 components (U, V, W) of the spatial velocities with respect to the LSR, and the parameters of the orbits: apo-galactic and peri-galactic distance (Rmax, Rmin), maximum height over the galactic plane (Zmax) and eccentricity (). The equations of motion were integrated in the galactic model by Allen & Santillan (allsan91 (1991)) over an age of 12 Gyr. The adopted velocity of the Sun with respect to the LSR is (9, 5, 6) km/s, the solar galactocentric distance is assumed to be R⊙=8.5 kpc and its assumed circular velocity is Vlsr=220 km/s.
| Star | [Fe/H] | U | V | W | Rmin | Rmax | Zmax | e | Pop |
|---|---|---|---|---|---|---|---|---|---|
| HD 245 | –0.78 | –29.6 | –111.5 | –49.7 | +2.85 | +8.65 | +0.90 | 0.50 | I |
| HD 2796 | –2.21 | +79.5 | –108.1 | +44.2 | +2.87 | +9.35 | +1.02 | 0.53 | I |
| HD 3546 | –0.63 | +111.6 | –54.8 | +3.3 | +4.46 | +10.77 | +0.05 | 0.41 | D |
| HD 3567 | –1.20 | +144.5 | –230.8 | –36.9 | +0.16 | +10.70 | +7.68 | 0.97 | H |
| HD 4306 | –2.52 | –43.1 | –26.7 | +69.6 | +6.68 | +9.34 | +1.52 | 0.17 | D |
| HD 5395 | –0.19 | +58.8 | –20.6 | –5.0 | +6.41 | +9.69 | +0.06 | 0.20 | D |
| HD 5916 | –0.51 | –10.9 | –94.1 | +10.6 | +3.42 | +8.60 | +0.14 | 0.43 | D |
| HD 6582 | –0.89 | –33.4 | –154.4 | –29.3 | +1.39 | +8.61 | +0.47 | 0.72 | I |
| HD 6755 | –1.47 | –123.5 | –467.6 | +87.5 | +6.95 | +17.53 | +3.24 | 0.43 | H |
| HD 6833 | –0.89 | +130.2 | –198.1 | +79.6 | +0.40 | +10.96 | +6.92 | 0.93 | H |
| HD 8724 | –1.65 | +41.4 | –177.5 | +13.9 | +0.81 | +8.84 | +0.45 | 0.83 | H |
| HD 10700 | –0.56 | +27.5 | +34.0 | +18.9 | +8.32 | +11.98 | +0.28 | 0.18 | D |
| HD 13530 | –0.48 | –96.0 | –47.7 | –15.8 | +4.82 | +10.41 | +0.21 | 0.37 | D |
| HD 13783 | –0.61 | +57.6 | +11.4 | –71.5 | +7.67 | +11.70 | +1.72 | 0.21 | D |
| HD 15596 | –0.67 | +87.4 | –68.2 | +56.0 | +4.31 | +9.92 | +1.11 | 0.39 | D |
| HD 18768 | –0.51 | –79.4 | +43.5 | –15.2 | +7.65 | +15.01 | +0.26 | 0.32 | D |
| HD 19445 | –1.89 | +165.4 | –118.4 | –61.3 | +2.28 | +12.19 | +1.55 | 0.69 | I |
| HD 23439 | –1.14 | –86.4 | –109.9 | –70.4 | +2.85 | +9.53 | +1.54 | 0.54 | I |
| HD 25329 | –1.73 | –31.9 | –184.8 | +26.3 | +0.63 | +8.59 | +4.64 | 0.86 | H |
| HD 26297 | –1.91 | –16.7 | –44.1 | +36.4 | +5.89 | +8.75 | +0.62 | 0.20 | D |
| HD 37828 | –1.49 | –101.7 | –163.5 | –46.6 | +1.19 | +9.83 | +1.71 | 0.78 | I |
| HD 44007 | –1.49 | –71.4 | –158.1 | +17.8 | +1.31 | +9.14 | +0.46 | 0.75 | I |
| HD 45282 | –1.28 | –236.8 | –181.4 | –37.4 | +0.64 | +15.99 | +7.95 | 0.92 | H |
| HD 46480 | –0.49 | +4.4 | –49.9 | –77.6 | +5.87 | +8.59 | +1.65 | 0.19 | D |
| HD 51530 | –0.39 | –7.2 | +36.8 | –16.8 | +8.54 | +12.04 | +0.25 | 0.17 | D |
| HD 63791 | –1.67 | +16.7 | –123.6 | –100.5 | +2.85 | +8.77 | +3.45 | 0.51 | I |
| HD 64090 | –1.69 | +269.4 | –215.7 | –81.9 | +0.07 | +20.02 | +15.71 | 0.99 | H |
| HD 64606 | –0.82 | –68.5 | –55.9 | +5.8 | +4.75 | +9.39 | +0.07 | 0.33 | D |
| HD 76932 | –0.90 | –39.1 | –85.3 | +75.5 | +3.99 | +8.80 | +1.66 | 0.38 | D |
| HD 84937 | –2.00 | +234.7 | –233.1 | –1.3 | +0.29 | +15.30 | +12.19 | 0.96 | H |
| HD 87140 | –1.71 | +133.0 | –11.0 | +60.3 | +5.85 | +14.18 | +1.74 | 0.42 | D |
| HD 88609 | –2.66 | +34.5 | –45.2 | –9.2 | +5.62 | +8.94 | +0.26 | 0.23 | D |
| HD 88725 | –0.65 | +80.6 | –28.3 | –16.1 | +5.73 | +10.27 | +0.21 | 0.28 | D |
| HD 94028 | –1.43 | –26.5 | –135.6 | +17.1 | +1.96 | +8.60 | +0.21 | 0.63 | I |
| HD 103095 | –1.39 | +289.9 | –154.1 | –6.9 | +1.08 | +22.01 | +0.21 | 0.91 | H |
| HD 105755 | –0.65 | +44.9 | –2.9 | –19.4 | +7.37 | +9.82 | +0.27 | 0.14 | D |
| HD 108076 | –0.85 | –84.9 | –36.7 | –9.2 | +5.36 | +10.19 | +0.13 | 0.31 | D |
| HD 108317 | –2.17 | –128.2 | –106.3 | –12.4 | +2.70 | +10.53 | +0.31 | 0.59 | I |
| HD 110184 | –2.27 | +9.7 | –70.2 | +130.6 | +6.01 | +8.67 | +4.10 | 0.18 | I |
| HD 114762 | –0.72 | –73.8 | –64.5 | +63.9 | +4.55 | +9.54 | +1.31 | 0.35 | D |
Table 1 (Continued)
Star
[Fe/H]
U
V
W
Rmin
Rmax
Zmax
e
Pop
HD 117876
–0.47
+125.3
–71.5
+1.5
+3.76
+10.94
+0.17
0.49
I
HD 122563
–2.66
–124.7
–212.4
+19.1
+0.15
+9.92
+7.10
0.97
H
HD 122956
–1.60
+34.0
–186.0
+118.0
+0.93
+8.46
+6.05
0.80
H
HD 124897
–0.58
+34.1
–114.6
+2.6
+2.62
+8.63
+0.03
0.53
I
HD 127243
–0.65
–65.8
–100.0
+55.5
+3.16
+9.12
+1.02
0.49
I
HD 132142
–0.51
–99.7
–50.3
+25.4
+4.70
+10.44
+0.37
0.38
D
HD 134169
–0.72
+24.9
+2.8
+20.4
+7.94
+9.35
+0.27
0.08
D
HD 140283
–2.50
–239.9
–247.2
+48.5
+0.45
+16.01
+9.48
0.95
H
HD 150177
–0.64
+2.7
–19.4
–19.2
+7.12
+8.47
+0.23
0.09
D
HD 157089
–0.56
–157.9
–36.2
–4.3
+4.55
+13.70
+0.07
0.50
I
HD 159482
–0.86
–156.2
–57.8
+86.5
+4.19
+13.49
+2.79
0.53
I
HD 160693
–0.46
+213.8
–112.4
+90.0
+2.55
+15.89
+5.41
0.72
I
HD 165195
–2.03
+76.3
–99.4
–10.8
+3.03
+8.94
+0.14
0.49
I
HD 165908
–0.61
+3.1
+5.7
+15.5
+8.48
+8.99
+0.19
0.03
D
HD 166161
–1.20
+130.4
–126.7
+8.3
+2.04
+10.26
+0.11
0.67
I
HD 175305
–1.42
–60.4
–77.4
–287.4
+8.18
+22.88
+19.82
0.47
H
HD 184499
–0.64
–55.9
–156.8
+64.6
+1.35
+8.93
+1.29
0.74
I
HD 187111
–1.74
–143.7
–154.8
–37.1
+1.16
+10.42
+0.63
0.80
H
HD 188510
–1.48
–143.2
–108.6
+68.6
+2.63
+11.31
+1.74
0.62
I
HD 189558
–1.00
+84.5
–122.5
+49.2
+2.35
+9.28
+1.01
0.60
I
HD 194598
–1.16
–66.8
–271.4
–24.5
+0.99
+8.92
+0.46
0.80
H
HD 195633
–0.55
–49.2
–15.5
–5.4
+6.61
+9.48
+0.08
0.18
D
HD 201889
–0.85
–120.4
–77.3
–31.2
+3.59
+10.71
+0.50
0.50
I
HD 201891
–0.99
+101.0
–110.1
–52.6
+2.71
+9.82
+1.03
0.57
I
HD 204155
–0.78
–25.2
–120.5
–38.5
+2.46
+8.55
+0.59
0.55
I
HD 204543
–1.79
+6.3
–138.0
+21.2
+1.85
+8.27
+0.43
0.63
I
HD 208906
–0.71
+82.2
+2.9
–5.0
+6.79
+11.55
+0.07
0.26
D
HD 216143
–2.11
+138.7
–155.1
+90.6
+1.67
+10.94
+4.63
0.73
I
HD 216174
–0.56
–29.0
–40.7
+5.7
+5.72
+8.78
+0.07
0.21
D
HD 218502
–1.72
+12.3
–99.5
–2.7
+3.18
+8.50
+0.07
0.46
I
HD 218857
–1.84
+53.8
–124.5
+158.1
+3.98
+9.39
+6.37
0.40
I
HD 219617
–1.43
+391.8
–325.5
–51.7
+1.61
+57.95
+5.09
0.95
H
HD 221170
–2.05
+111.3
–127.6
–16.0
+2.25
+9.93
+0.41
0.63
I
HD 221377
–0.88
–33.9
+12.7
–23.4
+7.98
+10.40
+0.33
0.13
D
HD 224930
–0.85
+0.3
–66.3
–26.4
+4.60
+8.50
+0.34
0.30
D
HD 338529
–2.31
+38.3
–154.7
–58.8
+1.44
+8.71
+1.01
0.72
I
HD 345957
–1.33
–20.8
–99.3
+106.1
+3.79
+8.54
+3.18
0.39
D
BD–18 5550
–3.01
–69.3
–183.8
–20.7
+0.57
+8.63
+4.81
0.88
H
BD+02 3375
–2.26
–357.5
–245.7
+84.3
+0.85
+38.35
+14.53
0.96
H
BD+02 4651
–1.82
–220.7
–374.0
+12.3
+3.40
+17.24
+0.44
0.67
H
BD+04 4551
–1.51
–80.1
–49.0
+78.1
+5.16
+10.02
+1.87
0.32
D
Table 1 (Continued)
Star
[Fe/H]
U
V
W
Rmin
Rmax
Zmax
e
Pop
BD+17 4708
–1.56
–293.0
–268.6
+8.6
+0.80
+21.98
+0.24
0.93
H
BD+23 3130
–2.62
–103.6
–430.6
+154.9
+6.90
+15.38
+6.79
0.38
H
BD+29 0366
–1.01
–52.9
–70.7
–42.0
+4.32
+9.03
+0.67
0.35
D
BD+29 2091
–1.93
+161.0
–339.4
+102.2
+3.19
+12.99
+4.20
0.61
H
BD+30 2611
–1.41
–33.2
–80.0
–264.6
+8.21
+17.22
+14.70
0.35
H
BD+36 2165
–1.51
+214.7
–255.5
–129.1
+0.56
+16.77
+9.18
0.94
H
BD+41 3931
–1.68
+80.2
–137.5
–87.9
+2.12
+9.42
+2.10
0.63
I
BD+42 3607
–1.97
–164.6
–162.1
+20.1
+1.03
+11.45
+0.77
0.84
H
BD+66 0268
–1.95
–166.0
–414.5
–66.5
+4.97
+15.55
+2.02
0.52
H
-
–. The velocities U, V, W (in km/s) are given with respect to the LSR, with U positive towards the GC; Rmin, , Zmax are in kpc.
The first group of stars (D) includes objects with disk-like kinematics, (nearly-circular orbits, not reaching extreme distances from the plane and with a significant component of rotational velocity. This group is dominated by thick-disk stars. We chose to include in category D stars with height Z 4.0 kpc, eccentricity 0.45 and rotational velocity V 160 km/s. The second group (H) includes all stars whose orbits reach larger distances from the galactic plane; they have large values of or retrograde rotational velocities. The values of Z6 kpc, or e0.75, or V 0 characterize such cases. All other stars fall into an intermediate group (I) corresponding to the overlap between the thick disk and the halo; this includes 4 stars with [Fe/H]111In the classical notation where [X/H] log(NX/NH)∗ - log(NX/NH)⊙ -1.6 (HD 4306, HD 26297, HD 87140, HD 88609), but showing disk-like orbits. No star with parameters typical of the thin galactic disk was selected for our work: hence, kinematic data simply confirm the chemical evidence that we are dealing with stars of the oldest subsystems in the Galaxy.
3.4 Analysis of the abundance data
As mentioned above, a detailed analysis of atmospheric parameters, EWs and abundance results for some elements was given in our previous works (Paper I, Paper II). The main sources of uncertainty in the final element abundances lay in: 1) spectrum processing (from flat-field division to measurement of EWs); 2) atmosphere modeling (values of Teff, g, Vt, [Fe/H]; thermal and dynamical structure of the atmosphere; LTE or nLTE approach, etc.); 3) estimating parameters from atomic physics (oscillator strengths, radiative and collisional damping constants, hyper-fine structure etc.).
Here we shall consider uncertainties related to atmospheric parameters and to spectrum processing (i.e those involved in the measurement of EWs and in the fits with synthetic spectra, including the uncertainty arising from the positioning of the spectral continuum). At the end of this subsection we shall also comment on the limits of the LTE abundance analysis as employed here.
The influence of atmospheric parameters on the final abundances can be estimated through the sensitivity of [Cu/Fe] and [Zn/Fe] to variations in the model parameters. Table 2 lists the results of such computations, assuming typical atmospheric parameter uncertainties ( Teff = +100 K; f g= +0.3; Vt=+0.2 km s-1; [Fe/H] 0.25). This is done for four stars covering a wide range in atmospheric parameters.
| HD51530 | HD15596 | |||||||||||
| (6100/3.8/0.8/–0.39) | (4750/2.5/1.0/–0.67) | |||||||||||
| El/D | 1 | 2 | 3 | 4 | 5 | 6 | 1 | 2 | 3 | 4 | 5 | 6 |
| Cu | 0.09 | 0.00 | 0.04 | 0.00 | 0.05 | 0.11 | 0.07 | 0.04 | 0.14 | 0.04 | 0.05 | 0.17 |
| Zn | 0.06 | 0.01 | 0.06 | 0.00 | 0.07 | 0.11 | 0.04 | 0.10 | 0.10 | 0.06 | 0.06 | 0.17 |
| HD219617 | HD122563 | |||||||||||
| (5870/4.0/1.5/–1.43) | (4570/1.1/1.2/–2.5) | |||||||||||
| El/D | 1 | 2 | 3 | 4 | 5 | 6 | 1 | 2 | 3 | 4 | 5 | 6 |
| Cu | 0.07 | 0.00 | 0.00 | 0.00 | 0.05 | 0.09 | 0.23 | 0.07 | 0.01 | 0.01 | 0.05 | 0.25 |
| Zn | 0.03 | 0.04 | 0.01 | 0.00 | 0.09 | 0.10 | 0.12 | 0.13 | 0.01 | 0.00 | 0.09 | 0.20 |
-
(1)
– Teff = +100 K;
-
(2)
– g= +0.3;
-
(3)
– Vt=+0.2 km s-1;
-
(4)
– [Fe/H] = –0.25 dex;
-
(5)
– EW= 2mÅ for Zn and 0.05 dex for Cu abundance;
-
(6)
– Total error.
Besides errors caused by model parameters, the total error includes other uncertainties: mainly in the measurement of EWs for zinc ( 2mÅ) and mainly in the spectrum fit for copper ( 0.05dex in Cu abundance). From the analysis of Table 2 we deduce that Cu is more sensitive to the choice of than Zn, while Zn is more sensitive to g. Such a behavior of zinc is due to its higher ionization potential. The main contribution to the total error comes from the uncertainty in determination for lines having EWs larger than 100 mÅ. The total error is around 0.09-0.11dex for dwarf stars with high Teff and grows when Teff and g decrease, reaching values of 0.20–0.25 dex for cool giants. On this basis we estimate that the average accuracy of Cu and Zn abundances is about 0.15 dex. Individual uncertainties for our sample stars are listed in Table 3, together with the ratios of Cu and Zn abundances relative to Fe.
| HD | [Fe/H] | [Cu/Fe] | [Zn/Fe] | HD/BD | [Fe/H] | [Cu/Fe] | [Zn/Fe] | ||||
|---|---|---|---|---|---|---|---|---|---|---|---|
| 245 | –0.78 | 0.05 | 0.16 | 0.15 | 0.13 | 117876 | –0.47 | 0.17 | 0.15 | 0.12 | 0.14 |
| 2796 | –2.21 | –0.54 | 0.14 | 0.12 | 0.12 | 122563 | –2.66 | –0.72 | 0.25 | 0.12 | 0.19 |
| 3546 | –0.63 | –0.10 | 0.15 | 0.22 | 0.14 | 122956 | –1.60 | –0.75 | 0.16 | 0.01 | 0.17 |
| 3567 | –1.20 | –0.66 | 0.13 | –0.23 | 0.16 | 124897 | –0.58 | 0.06 | 0.17 | 0.25 | 0.15 |
| 4306 | –2.52 | –0.54 | 0.13 | 0.04 | 0.12 | 127243 | –0.66 | –0.07 | 0.21 | 0.13 | 0.18 |
| 5395 | –0.19 | 0.09 | 0.19 | 0.12 | 0.21 | 132142 | –0.54 | 0.09 | 0.24 | 0.16 | 0.22 |
| 5916 | –0.51 | – | – | 0.33 | 0.26 | 134169 | –0.72 | 0.08 | 0.13 | –0.02 | 0.11 |
| 6582 | –0.89 | 0.22 | 0.14 | 0.22 | 0.15 | 140283 | –2.41 | – | – | 0.14 | 0.12 |
| 6755 | –1.46 | –0.79 | 0.19 | –0.13 | 0.16 | 150177 | –0.65 | –0.15 | 0.12 | 0.01 | 0.11 |
| 6833 | –1.13 | –0.12 | 0.24 | –0.14 | 0.26 | 157089 | –0.58 | –0.02 | 0.14 | 0.08 | 0.13 |
| 8724 | –1.70 | –0.60 | 0.22 | –0.09 | 0.19 | 159482 | –0.86 | –0.11 | 0.16 | 0.19 | 0.14 |
| 10700 | –0.56 | 0.21 | 0.19 | 0.26 | 0.18 | 160693 | –0.46 | 0.06 | 0.16 | 0.04 | 0.14 |
| 13530 | –0.48 | 0.00 | 0.15 | 0.14 | 0.14 | 165195 | –2.03 | –0.57 | 0.26 | 0.05 | 0.22 |
| 13783 | –0.61 | 0.14 | 0.17 | 0.15 | 0.19 | 165908 | –0.67 | 0.02 | 0.12 | 0.06 | 0.11 |
| 15596 | –0.67 | 0.22 | 0.28 | 0.28 | 0.21 | 166161 | –1.20 | –0.30 | 0.16 | 0.11 | 0.13 |
| 18768 | –0.51 | –0.12 | 0.25 | 0.21 | 0.23 | 175305 | –1.47 | –0.30 | 0.17 | –0.08 | 0.14 |
| 19445 | –1.89 | –0.54 | 0.10 | –0.04 | 0.08 | 184499 | –0.66 | 0.13 | 0.13 | 0.10 | 0.12 |
| 23439 | –1.14 | – | – | – | – | 187111 | –1.74 | –0.58 | 0.24 | 0.14 | 0.20 |
| 25329 | –1.73 | –0.37 | 0.11 | 0.01 | 0.14 | 188510 | –1.48 | –0.52 | 0.13 | –0.03 | 0.12 |
| 26297 | –1.91 | –0.72 | 0.32 | 0.23 | 0.24 | 189558 | –1.00 | –0.30 | 0.11 | 0.09 | 0.11 |
| 37828 | –1.49 | –0.41 | 0.25 | 0.04 | 0.26 | 194598 | –1.16 | –0.34 | 0.11 | –0.10 | 0.10 |
| 44007 | –1.49 | –0.61 | 0.17 | –0.01 | 0.16 | 195633 | –0.55 | –0.05 | 0.12 | –0.05 | 0.11 |
| 45282 | –1.31 | –0.48 | 0.13 | –0.18 | 0.13 | 201889 | –0.78 | –0.14 | 0.12 | –0.06 | 0.13 |
| 46480 | –0.49 | – | – | 0.31 | 0.21 | 201891 | –0.99 | –0.21 | 0.11 | –0.10 | 0.10 |
| 51530 | –0.39 | –0.01 | 0.14 | 0.13 | 0.13 | 204155 | –0.82 | 0.05 | 0.15 | 0.26 | 0.13 |
| 63791 | –1.73 | –0.52 | 0.28 | 0.17 | 0.20 | 204543 | –1.79 | –0.60 | 0.28 | 0.07 | 0.20 |
| 64090 | –1.69 | –0.51 | 0.16 | –0.01 | 0.17 | 208906 | –0.71 | –0.09 | 0.11 | –0.10 | 0.10 |
| 64606 | –0.99 | 0.09 | 0.10 | 0.21 | 0.11 | 216143 | –2.13 | –0.57 | 0.32 | 0.08 | 0.24 |
| 76932 | –0.90 | –0.17 | 0.15 | 0.21 | 0.14 | 216174 | –0.51 | 0.18 | 0.26 | –0.11 | 0.26 |
| 84937 | –2.00 | – | – | 0.09 | 0.11 | 218502 | –1.72 | – | – | – | – |
| 87140 | –1.71 | –0.54 | 0.14 | 0.09 | 0.15 | 218857 | –1.84 | –0.76 | 0.24 | –0.05 | 0.20 |
| 88609 | –2.66 | –0.64 | 0.25 | 0.16 | 0.19 | 219617 | –1.43 | – | – | –0.04 | 0.09 |
| 88725 | –0.71 | 0.09 | 0.13 | 0.19 | 0.15 | 221170 | –2.05 | –0.70 | 0.24 | 0.05 | 0.20 |
| 94028 | –1.43 | –0.47 | 0.11 | –0.03 | 0.09 | 221377 | –0.90 | –0.20 | 0.11 | –0.12 | 0.10 |
| 103095 | –1.47 | –0.40 | 0.14 | 0.15 | 0.16 | 224930 | –0.85 | –0.07 | 0.13 | 0.33 | 0.14 |
| 105755 | –0.65 | –0.14 | 0.13 | 0.07 | 0.09 | 338529 | –2.31 | – | – | 0.15 | 0.25 |
| 108076 | –0.85 | –0.02 | 0.17 | 0.25 | 0.14 | 345957 | –1.33 | –0.27 | 0.13 | 0.00 | 0.16 |
| 108317 | –2.17 | –0.63 | 0.13 | 0.01 | 0.11 | -18 5550 | –3.01 | – | – | –0.03 | 0.26 |
| 110184 | –2.27 | –0.63 | 0.31 | 0.22 | 0.24 | +02 3375 | –2.26 | – | – | – | – |
| 114762 | –0.74 | –0.06 | 0.13 | 0.09 | 0.11 | +02 4651 | –1.82 | – | – | 0.13 | 0.19 |
Table 3 (Continued)
BD
[Fe/H]
[Cu/Fe]
[Zn/Fe]
BD
[Fe/H]
[Cu/Fe]
[Zn/Fe]
+04 4551
–1.51
–
–
0.02
0.14
+30
2611
–1.41
–0.75
0.16
–0.06
0.13
+17 4708
–1.56
–
–
–0.05
0.16
+36 2165
–1.51
–
–
0.01
0.26
+23 3130
–2.61
–
–
0.11
0.10
+41
3931
–1.68
–0.97
0.22
–0.06
0.19
+29 0366
–1.01
–0.14
0.26
0.25
0.24
+42 3607
–1.97
–
–
–0.04
0.11
+29 2091
–1.93
–
–
0.29
0.20
+66 0268
–1.95
–
–
0.11
0.22
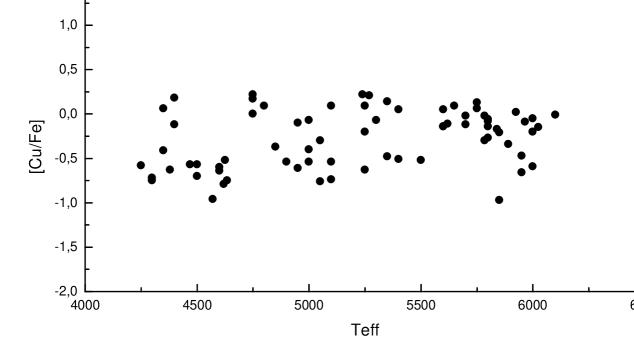
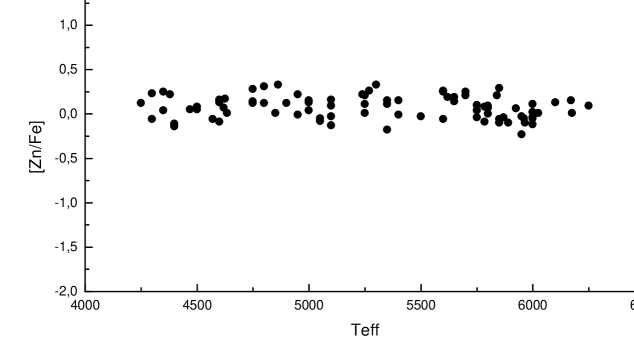
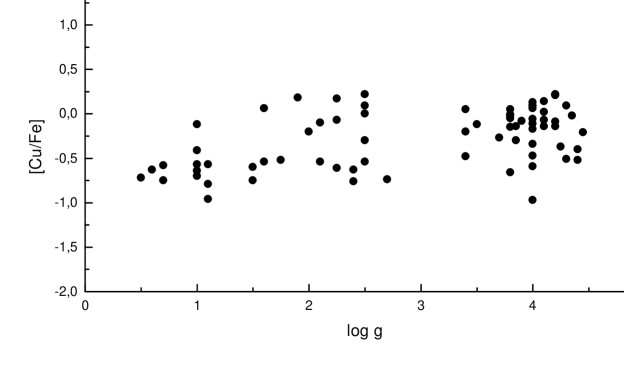
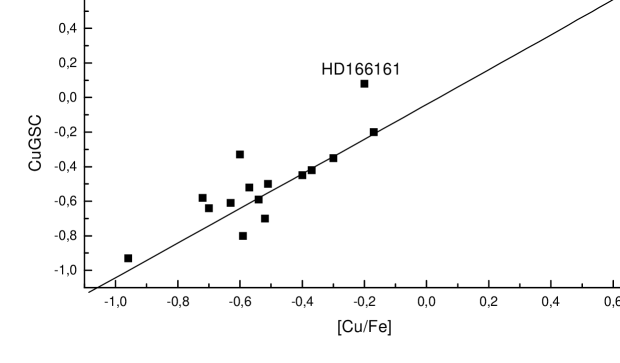
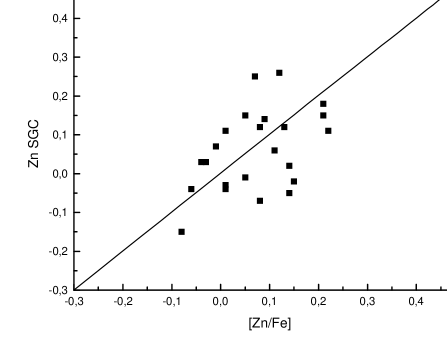
Fig. 2 to 5 show a Cu and Zn abundances as a function of Teff, g. A general lack of correlation emerges, and this confirms that the choice of parameters is reliable. We also compared our [Cu/Fe] and [Zn/Fe] ratios with those by Sneden et al. (1991). This is done in Fig. 6 and 7. The mean difference between our results and those of Sneden et al. (sgc91 (1991)) for the stars in common is [Cu/Fe]=–0.02 0.14 (15 stars) and [Zn/Fe]=0.010.10 (23 stars), respectively. The agreement is therefore quite good.
Finally, a few comments on nLTE effects are needed. These effects in spectral lines are caused by both the real conditions in the star’s atmosphere and the structure of atomic levels. Non-LTE corrections require detailed calculations for each case considered. Building an adequate atomic model is a difficult task, especially in the case of complex structures of atomic terms and unreliable atomic parameters (in presence of photoionization, shock processes etc.). Concerning Cu and Zn, computations of nLTE-effects on their abundances are complex and so far a good estimate of nLTE-corrections has not been presented. A posteriori, obtaining different abundances from lines with different low-level excitation potentials can be an empirical demonstration that departures from LTE are present. In the case of Cu, the lines 5105 Å and 5782 Å occur from meta-stable levels (Elow = 1.39 and 1.64 eV, respectively), unlike the line at 5218 Å(Elow = 3.82 eV). We have estimated that the discrepancy in Cu abundance, as determined from the lines at 5105 Å and at 5218 Å, is [Cu/H]5105 - [Cu/H]5218 0.040.10. The difference is well within the uncertainty of the estimate, and does not provide reasons for assuming that departures from LTE are of any importance. Unfortunately, Zn I lines have similar potentials and we cannot perform a similar analysis for the Zn abundance. We can however note that we used solar oscillator strengths for Zn I lines from Gurtovenko & Kostyk (1989), which implicitly include departures from LTE. We thus consider that our results can be affected only marginally by nLTE- effects.

3.5 Resulting abundance trends
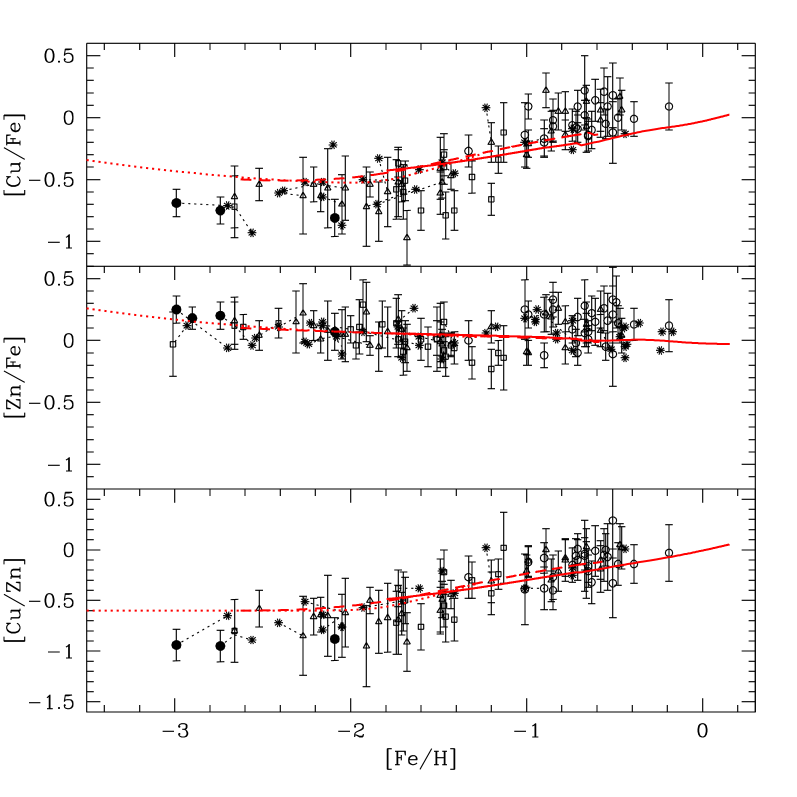
Our values of [Cu/Fe], [Zn/Fe], and [Cu/Zn] are shown as a function of [Fe/H] in Fig. 8, and compared to abundances available in the literature. In the figure we prefer to use different points for measurements of the same star made by different authors, instead of making averages: in this way the scatter related to the heterogeneous composition of the database can be better appreciated. The trends for Cu and Zn are remarkably different, in good accord with earlier findings by Gratton & Sneden (1988) and by Sneden et al. (1991), suggesting that differences in the dominant stellar mechanisms controlling the production of these elements must exist.

The mean values of [Cu/Fe] and [Zn/Fe] for thick-disk (D) and halo (H) stars are –0.100.23 (29 stars, D) and –0.580.25 (15 stars, H); 0.140.14 (34 stars, D) and –0.030.11 (23 stars, H), respectively. The abundance of Cu is therefore remarkably lower for halo stars than for disk stars, and this requires contributions on relatively long time scales. We shall comment on this point in section 4. On the contrary, Zn abundances have a flat trend, with a possible indication of a slight overabundance in the halo (at the limit of the error bar): this in general confirms the well-known fact that the ratio [Zn/Fe] is almost solar at all metallicities.
4 Nucleosynthesis and chemical evolution of Cu and Zn
Let us discuss now what the Cu and Zn abundance measurements in metal-poor stars imply for their nucleosynthesis and chemical evolution. As mentioned, this topic was previously addressed by Timmes et al. (1995) and by Matteucci et al. (1993). The first authors adopted nucleosynthesis predictions by Woosley & Weaver (ww95 (1995)). According to their calculations, the dominant contribution to copper derives from Ne-burning in massive stars exploding as Type II supernovae, while Zn is formed mainly during explosive Si-burning. When our enlarged database is considered, Timmes et al. (1995)’s model appears no longer compatible with the observations and must now be ruled out. The models by Matteucci et al. (1993), including a relevant contribution from Type Ia supernovae, yield predictions somewhat closer to the data, but are nevertheless not sufficient, in particular for Cu at low metallicity.
Despite the many studies on stellar nucleosynthesis published in the past years, the scenario for the production of Cu and Zn remains unclear. Actually, not only the situation has not improved significantly, but we are now aware that this failure is related to some fundamental weakness in the computations of pre-SN and explosive nucleosynthesis of nuclei after the iron peak. Indeed, a remarkable overproduction of such nuclei seems to be at present unavoidable. Revisions in the input physics and in reaction rates have somewhat alleviated the difficulties, as compared to the original calculations by Woosley & Weaver (1995), but the problems are not solved (Hoffman et al. 2001; Heger et al. 2001; Rauscher et al. 2002). Therefore, predictions for the synthesis of Cu and Zn in stars ultimately evolving to Type II supernovae must be viewed with great care. A similar (or even worst) situation occurs for Type Ia supernovae (see e.g.Nomoto, Thielemann, & Wheeler 1984; Iwamoto et al. 1999; Brachwitz et al. 2000), and the only contributions relatively well established are those from the main component of the -process coming from long-lived AGB stars (Gallino et al. 1998; Busso et al. 2001). However, these contributions to Cu and Zn are marginal.
4.1 Production of Cu and Zn: hints from observations
Starting from Cu, we have mentioned that the trend of Fig. 8 can be interpreted accepting that Cu owes a larger fraction of its abundance to long-lived mechanisms than iron does. The data actually say something more, i.e. that the two elements are not linked by a simple relation. Fig. 9 shows indeed that fitting their relative trends requires at least a polynomial function with a quartic term. The line in the figure has no special meaning other than minimizing the sigma of the fit; it however shows that any reasonably accurate interpolation curve must necessarily assume relationships more complex than expected from purely primary or purely secondary processes.


In order to show this and infer what kind of phenomena might be involved, let us remember that, when the stellar lifetime is short enough that it can be neglected in calculations of galactic chemical evolution, a secondary element reaches an abundance:
where yS is the so-called integrated effective yield of element , produced by a whole generation of stars. If we indicate by the residual galactic mass in the form of gas, f(t) = [ln] for closed-box models (galactic halo) and f(t) = [ln-1] for infall models (galactic disk: see e.g. Lynden-Bell 1975, Chiosi 1986, for more extended definitions and treatments). A primary element like Fe (or, better, its contribution by short-lived objects whose lifetime can be neglected) reaches instead an abundance:
so that the ratio is proportional to f(t), hence to the ratio . Computing logarithms, it is straightforward to recognize that [S/Fe] = [Fe/H] + const.: hence in Fig. 9 a purely secondary element would have a linear trend with slope +1. On the contrary, in the region where an almost linear trend exists (2 [Fe/H] 0.5) the observed slope is about 0.6 (see also Fig. 10). Hence, already in early times of galactic evolution (the halo phases) Cu cannot be considered as a purely secondary element. In such phases it might be explained as the superposition of (at least) two independent processes, one of primary and one of secondary origin. Indeed, summing two components defined by equations (1) and (2), one gets:
where A, B, C are known functions of the solar Cu and Fe abundances, and of the effective integrated yields of Fe, of Cu (primary), and of Cu (secondary). A parabolic relation like the one in equation (3) does in fact hold for the Cu abundance data in the shown metallicity interval, as can be seen in Fig. 11. Hence, Cu can have contributions from both primary and secondary processes in short-lived (i.e. massive) stars. The importance of secondary mechanisms can be quantitatively estimated by considering Cu production compared to the -only isotope 80Kr. This nucleus is known to be produced at about 12% of its abundance in the main component of the -process (Arlandini et al. 1999) and to have possibly a 10% p-process contribution. The rest is due to neutron captures in massive stars. Let us use for these last the recent models by Hoffman et al. (2001), where the overproduction of isotopes up to A = 100 is given. By weighting the predictions from the 15, 20 and 25 stars of the quoted paper over an initial mass function , it is easy to see that if those models have to produce 80Kr at the 78% level of its solar abundance, then summing over the isotopes of Cu one gets for this element a contribution from secondary processes in massive stars of about 23% (assuming no primary contribution from the same stars). Note that the predictions by Raiteri et al. (1992) and Matteucci et al. (1993) are in almost perfect agreement with this apparently weak argument (they found at most 26%). This gives us some confidence in the result. Below [Fe/H] = 2.5, [Cu/Fe] reaches an apparent plateau (though this conclusion is uncertain due to the limited data) around 0.6 dex. As 70% of iron comes later from type Ia Supernovae, this implies a primary contribution by population II massive stars of 10 0.3, which gives a total contribution as small as 7.5%. From the recent work by Heger et al. (2002) we also see that pre-galactic very massive stars cannot give remarkable contributions to Cu.
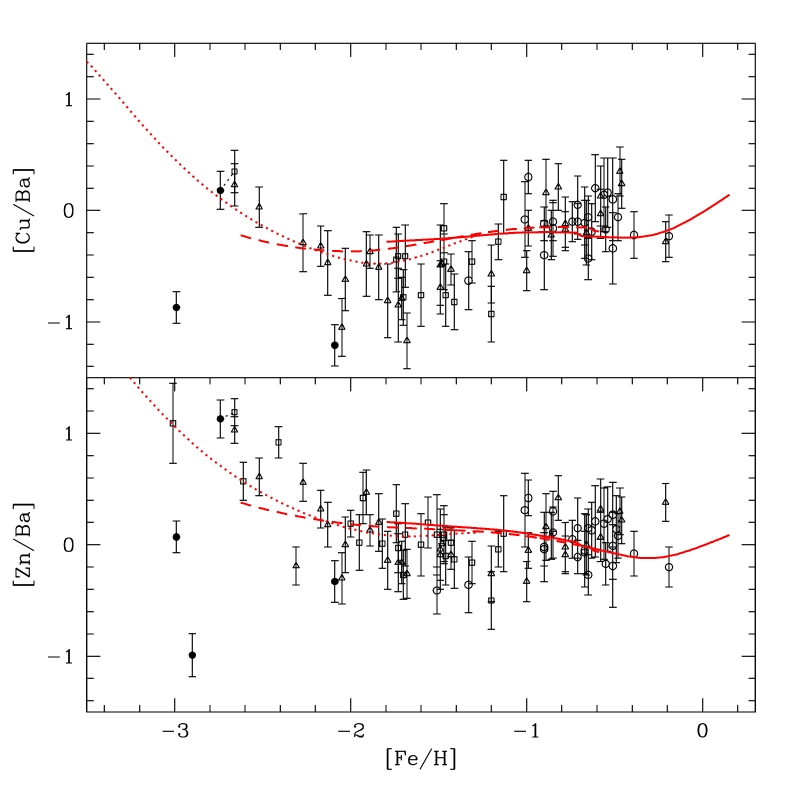
We can also exclude that the primary massive star contribution be dominated by the -process. Inspection of Fig. 12, where the trends of Cu and Zn versus Ba are shown, reveals indeed that at low metallicity Cu and Zn remain high, maybe even growing with respect to Ba. In these early phases of galactic evolution the abundance of Ba is due to the -process, which sharply decreases below [Fe/H] = 2.5 (Travaglio et al. 1999, and references therein). Cu and Zn behave differently and their primary-like contribution from massive stars cannot be controlled by the same mechanisms (and probably derives at least in part from other explosive phenomena, like the -rich freeze-out of NSE processes). We underline (though it should be obvious) that we cannot exclude from such very crude arguments that the -process gives some contribution (see below). At this level we can only state that it is not dominant.

Summing up, inspection of the observed data, comparisons with other elements and isotopes of known origin, and a very rough scheme for the chemical enrichment of the galactic halo allows us to predict that Cu receives a primary contribution by massive stars of about 7.5% of its abundance, while something around 25% should come from secondary processes in the same stars (slow neutron captures, or the weak -process). Another 5% has been already attributed to the main -component from AGB stars of long lifetime. We cannot avoid the suggestion that the remaining part (formally 62.5%) comes from the less known processes we have so far neglected, i.e. explosive nucleosynthesis in Type Ia supernovae. These would affect the abundance of Cu relatively late, due to the longer lifetimes, and would thus contribute to make the functional relationship between [Cu/Fe] and [Fe/H] rather complex, as shown in Fig. 9. In an independent way, we thus reach conclusions qualitatively similar to (though quantitatively different from) Matteucci et al. (1993).
A similar reasoning can be repeated for Zn, which however shows a trend very close to Fe itself, so that the conclusion is more straightforward. Attributing 3% of its production to the main -process component in AGB stars, the rest should come either from primary nucleosynthesis in massive stars (30%), or from Type Ia supernovae (something around 67%, like for Fe). The massive star yield cannot be dominated by the -process, but some contribution from this last remains possible.
4.2 Galactic enrichment of Cu and Zn: a test and some conclusions
With the prescriptions derived in the previous section from simple inspections of the data and comparisons with other nuclei of known origin, we want now to compute the chemical evolution of the Galaxy for Cu and Zn. This has obviously some circularity in the procedure, and indeed we do not attribute any special emphasis to such results: they are only an internal consistency check for our predictions, when a full evolution model is adopted, based on finite stellar lifetimes, and on global hypotheses for star formation and nucleosynthesis of other elements that were already tested in previous works.
For this ’test’ we make use of a metallicity distribution and a Star Formation Rate previously obtained (Travaglio et al. 1999) through an evolutionary model suitable for reproducing a large set of Galactic and extragalactic constraints (for details on the code see Ferrini et al. 1992; for its application to galactic heavy element enrichment see also Travaglio et al. 2001). The model considers the Galaxy as divided in three zones, halo, thick disk and thin disk. For Cu and Zn, we simply mimic the input stellar yields by imposing the tentative production sites derived in the previous section for the primary and secondary contributions in massive stars, in Type Ia supernoave and in AGB stars.
Fig. 13 and Fig. 14 show the resulting chemical enrichment, through plots of [Cu/Fe], [Zn/Fe], [Cu/Zn] and of [Cu/Ba], [Zn/Ba] versus [Fe/H]. Chemical evolution predictions for Ba are from Travaglio et al. (1999). Being an outcome of the very crude estimates previously discussed, the results illustrated by the figures are not bad, and confirm that our suggestions for the stellar yields should be roughly correct. However, while they can interpret the general trends, they cannot explain the spread of abundances at very low metallicity. This is in particular related to the over-simplification of attributing massive star yields of Cu and Zn to generic explosive phenomena, in the absence of a criterion for distinguishing different processes occurring in different masses.
In the galactic evolution results presented by Travaglio et al. (1999), the -process was attributed to moderately massive (8–10 ) stars, ejecting their nucleosynthesis contribution after some delay compared to the typical products of very massive objects; this was adopted as a possible explanation for the delay in the appearance of Eu and Ba with respect to oxygen and iron (Travaglio et al. 1999). Making use of this same separation of massive star yields in two groups with different time scales for enrichment, we might improve our suggestions on the origin of Cu and Zn, trying to disentangle their -process contribution from the rest. Actually, if the -process becomes well mixed in the Galaxy only after [Fe/H] has reached the value 2.5 or so, we can tentatively interpret the scattered Cu and Zn abundances in very metal-poor stars as an indication that these last were born out of clouds selectively contaminated by different supernova types, sometimes carrying the signature of the -process, sometimes that of NSE or other explosive nucleosynthesis phenomena, in a poorly mixed early Galaxy.
On the above hypothesis, a deeper insight into the contributions from massive stars can in principle be obtained by inspection of a few ultra-metal poor (UMP) stars like HD 115444 (Westin et al. 2000), HD 122563 (Westin et al. 2000; this work), BD+173248 (Cowan et al. 2002), and CS 31082-001 (Hill et al. 2002), provided Cu and/or Zn abundances, and their ratios to Ba or Eu are available (note, again, that we take all the quantitative information from observed data, so that the role of chemical models is only to meld the ingredients, in order to see if they form a self-consistent picture!). In particular, taking the extremely -process enriched ( times times solar) CS 31082-001 as an example, we can consider its abundances as due to a virtually ’pure’ -process (i.e. the contribution by any other nucleosynthesis mechanism is hidden by the dominant one from the -process). Knowing that the -process accounts for 20% of Solar System Ba (Travaglio et al. 1999; Arlandini et al. 1999), one might be tempted to derive directly the -process contribution to Zn (the abundance of Cu is not available for this star). From this procedure one gets 2% for -process Zn. Applying the same idea to Cu (e.g. in HD 115444) one would obtain an -process fraction for Cu 2%, which would in this case be an upper limit, as the star is not so extremely -process rich to exclude other contributions. Unfortunately, a simple scheme like the one depicted, which works fine for heavy -elements, must be taken with great care for lighter elements (140). Indeed, available abundance observations in population II stars, especially of the UMP class, have gradually introduced the idea that a unique -process mechanism, valid for both heavy and light -elements does not exist (see recent data in Sneden et al. 2000; Westin et al. 2000). Previous sets of stellar abundances in the halo, pointing to the same difficulties, and hints from isotopic anomalies related to radioactive nuclei in the solar system, induced Wasserburg et al. (1996) to suggest a galactic enrichment model in which the -process is at least bi-modal, with different supernova types responsible for heavy ( 140) and light ( 140) -nuclei. This new scenario, and especially the observational material on which it is based, now prevents any detailed analysis of the -process contribution to Cu and Zn. We can only suggest that a multiplicity of -process components is expected to add its effects to the scatter at low metallicity.
On the contrary, the general indications about primary massive star yields can receive some independent confirmation from a deeper look at the abundance distribution of individual UMP stars. A recent study presented by Travaglio, Gallino, & Arnone (2002), on the galactic chemical evolution of Sr, Y, and Zr, showed that the abundances of these elements in UMP stars suggests the existence of a primary neutron capture process in massive stars (not the classical -process). As discussed by Travaglio et al. (2002), this should also give a contribution of 20%-25% to the Solar System composition of Sr, Y, and Zr. Taking into account what we have discussed above, and using a simple procedure similar to the one described before to derive the -fraction of Cu and Zn, we get what follows. We consider HD122563 as a typical star enriched by the neutron-capture processes occurring in advanced massive star evolution (’-processes’). This implies ratios [(Sr, Y, Zr) to (Ba, Eu)] much higher than average at those metallicities (see Travaglio et al. 2002 for details). From this we can derive a primary contribution to Cu and Zn by the -process of 7% and 30%, respectively (that is in fairly good agreement with the contribution from massive stars derived in a completely different way in the previous Section).
In conclusion, the general contribution from massive stars seems to be roughly fixed from the database itself, despite the absence of secure predictions from nucleosynthesis models. It can come either from explosive Si burning, or NSE coinditions, or from the relatively fast neutron captures called ’-process’. Instead, due to the non-uniqueness of the -process, we cannot specify its relevance, but only suggest that the scatter at low metallicity may be further amplified by the effects of different admixtures of at least two -process contributions and by other explosive phenomena in supernovae.
5 Conclusions
In this paper we presented a large sample study of Cu and Zn in metal-poor stars, after verifying the population of the sample objects through estimates of their kinematic parameters. In the absence of clear indications on the stellar origin of Cu and Zn from the present status of nucleosynthesis theories, we tried to derive suggestions on the relevant mechanisms from an inspection of the observed data and from the evolutionary trends expected for the outcomes of various nuclear processes. In this way we inferred that several nucleosynthesis phenomena are involved, suggesting that about 25% of Cu is produced by secondary phenomena in massive stars, and only 7-8% is due to primary phenomena in the same environment (either explosive or from a primary -process). The bulk of Cu abundance (at least 62 – 65%) should be instead contributed on long time scales by type Ia supernovae, in agreement with suggestions by Matteucci et al. (1993). For Zn, its trend with respect to iron implies similar percentage yields for the two elements: 1/3 from primary processes in massive stars and 2/3 from type Ia supernovae. These rough indications were shown to roughly account for the Cu and Zn enrichment in the Galaxy. This approach was however found to be too schematic for interpreting the details of the database, including the scatter at very low metallicity. We argued that this last might be due to poorly mixed different contributions from massive stars in a non-homogeneous early stage (perhaps also complicated to the non-uniqueness of the -process). We also concluded that, while a simple separation of the yields for Cu and Zn in primary and secondary mechanisms, and in long-lived and short-lived parents, is roughly possible, and gives a preliminary guideline for future nucleosynthesis models, this cannot be pushed too far, and we found no reliable tool for disentangling the contributions of the two -process mechanisms from the rest. A more quantitative analysis must therefore wait for a clarification of the underlying physical processes in evolved stars.
Acknowledgements.
We gratefully thank the suggestions contained in a detailed, very collaborative referee report by Chris Sneden, whose contribution greatly improved the presentation of our material. C.T thanks Max-Planck-Institut für Astrophysik (Munich) for the support to this work. M.B. thanks support from the MURST project Cofin2000 ’Stellar Observables of Cosmological Relevance’.References
- (1) Allen C., Santillan A. 1991. Rev. Mex. Astron. Astrofis. 22, 255
- (2) Arlandini C., Kappeler F., Wisshak K., Gallino R., Lugaro M., Busso M., Straniero O. 1999, ApJ 525, 886
- (3) Blake L.A.J., Ryan S.G., Norris J.E., Beers T.C. 2001, Nucl.Phys.A 688, 502
- (4) Brachwitz F., Dean D.J., Hix W.R., Iwamoto K., Langanke K., et al. 2000, ApJ 536, 934
- (5) Busso M., Gallino R., Lambert D., Travaglio C., Smith V. 2001, ApJ 557, 802
- (6) Chiosi C. 1986, in Nucleosynthesis and Chemical Evolution, eds. Hauk B., Meader A., Meynet G. (Geneva Observatory, CH-1290 Sauverny-Versoix, Switzerland)
- (7) Clayton D.D. 1984, ApJ 285, 411
- (8) Cowan J., Sneden C., Burles S., Ivans I.I., Beers T.C., Truran J., et al. 2002, ApJ 572, 861
- (9) Cunha K., Smith V.V., Suntzeff N.B., Norris J.E., Da Costa G.S., Plez B. 2002, AJ 124, 379
- (10) Ferrini F., Matteucci F., Pardi C., Penco U. 1992, ApJ 387, 138
- (11) Galazutdinov G.A. 1992, Preprint SAO RAS 92, 27
- (12) Gratton R.G., Sneden C. 1988, A&A 204, 193
- (13) Gallino R., Arlandini C., Busso M., Lugaro M., Travaglio C., et al. 1998, ApJ 497, 388
- (14) Gurtovenko E.A., Kostyk R.I. 1989, Fraunhoffer spectrum and system of solar oscillators strengths, Naukova Dumka, Kiev, 200p.
- (15) Heger A., Woosley S.E., Martínez-Pinedo G., Langanke K. 2001, ApJ 560, 307
- (16) Heger A., Woosley S.E., Baraffe I., Abel T. 2002, (preprint), astro-ph/0112059.
- (17) Hill V., Plez B., Cayrel R., Beers T.C., et al. 2002, A&A 387, 560
- (18) Hoffman R.D., Woosley S.E., Weaver T.A. 2001, ApJ 549, 1085
- (19) Iwamoto K., Brachwitz F., Nomoto K., Kishimoto N., Umeda H., Hix W.R., Thielemann F.-K. 1999, ApJS 125, 349
- (20) Katz D., Soubiran C., Cayrel R., Adda M., Cautain R. 1998, A&A 338, 151
- (21) Käppeler F., Wiescher M., Giesen U., Gorres J., Baraffe I. et al. 1994, ApJ 437, 396
- (22) Kurucz R.L., 1993, CD ROM n13
- (23) Lynden-Bell D. 1975, VA 19, 299
- (24) Matteucci F., Raiteri C.M., Busso M., Gallino R., Gratton R. 1993, A&A 272, 421
- (25) Mishenina T.V., Kovtyukh V.V. 2001, A&A 370, 951 (Paper I)
- (26) Mishenina T.V., Kovtyukh V.V., Soubiran C., Korotin S.A. 2001 (Paper II)
- (27) Molaro P., Bonifacio P., Centurion M., D’Odorico S., Vladilo G., Santin P., Di Marcantonio P. 2000, ApJ 541, 54
- (28) Nomoto K., Thielemann F.-K., Wheeler J.C. 1984, ApJ 279, L23
- (29) Pancino E., Pasquini L., Hill V., Ferraro F.R., Bellazzini M. 2002, A&A 568, L101
- (30) Pettini M., Ellison S.L., Steidel C.C., Bowen D.V. 1999, ApJ 510, 576
- (31) Primas F., Reimers D., Wisotzki L., Reetz J., Gehren T., Beers T.C. 2000, in The First Stars, ed. A. Weiss, T. Abel, & V. Hill (Berlin: Springer), 51
- (32) Raiteri C.M., Gallino R., Busso M. 1992, ApJ 387, 263
- (33) Rauscher T., Heger A., Hoffman R.D., Woosley S.E. 2002, ApJ in press, preprint astro-ph/0112478
- (34) Smith V.V., Suntzeff N.B., Cunha K., Gallino R., Busso M., Lambert D.L., Straniero O. 2000, AJ 119, 1239
- (35) Sneden C., Crocker D.A. 1988, ApJ 335, 406
- (36) Sneden C., Gratton R.G., Crocker D.A. 1991, A&A 246, 354
- (37) Sneden C., Cowan J.J., Ivans I.I., et al. 2000, ApJ 533, L139
- (38) Soubiran C., Katz D., Cayrel R. 1998, A&AS 133, 221
- (39) Steffen M. 1985, A&AS 59, 403
- (40) Timmes F.X., Woosley S.E., Weaver T.A. 1995, ApJS 98, 617
- (41) Tinsley B.M. 1980 Fundamentals Cosmic Phys 5, 287
- (42) Tinsley B.M., Larson R.B. 1978, ApJ 221, 554
- (43) Travaglio C., Galli D., Gallino R., Busso M., Ferrini F., Straniero O. 1999, ApJ 521, 691
- (44) Travaglio C., Gallino R., Busso M., Gratton R. 2001, ApJ 549, 346
- (45) Travaglio C., Gallino R., Arnone E. 2002, in 11th Workshop on Nuclear Astrophysics, Ringberg Castle, ed. W. Hillebrandt & E. Müller, p. 218
- (46) Tsymbal V.V., 1996, Model Atmospheres and Spectrum Synthesis, ASP Conf. Ser. 108, 198
- (47) Wasserburg G.J., Busso M., & Gallino R. 1996, ApJ 446, L109
- (48) Westin J., Sneden C., Gustafsson B., Cowan J. 2000, ApJ 530, 783
- (49) Woosley S.E., Weaver T.A. 1995, ApJS 101, 181