Search for point sources of gamma radiation above 15 TeV with the HEGRA AIROBICC array
A search for potential point sources of very high energy gamma rays has been carried out on the data taken simultaneously by the HEGRA AIROBICC and Scintillator arrays from August 1994 to March 2000. The list of sought sources includes supernova remnants, pulsars, AGNs and binary systems††thanks: The full versions of tables 1 and 2, including the coordinates of the sources, are available in electronic form at the CDS via anonymous ftp to cdsarc.u-strasbg.fr (130.79.128.5) or via http://cdsweb.u-strasbg.fr/cgi-bin/qcat?J/A+A/. The energy threshold is around 15 TeV. For the Crab Nebula, a modest excess of 2.5 standard deviations above the cosmic ray background has been observed. Flux upper limits (at c.l.) of around 1.3 times the flux of the Crab Nebula are obtained, on average, for the candidate sources. A different search procedure has been used for an all-sky search which yields absolute flux upper limits between 4 and 9 crabs depending on declination, in the band from to .
Key Words.:
Gamma rays: observations1 Introduction
The part of the electromagnetic spectrum comprising gamma rays of energy above a few TeV is one of the least explored windows in Astronomy. Its study is of great importance in the understanding of very high energy non-thermal sources and for the determination of the origin of cosmic rays. This paper describes a systematic search for point sources emitting in energies above 15 TeV, using wide-acceptance air shower detectors.
In contrast to the success of Imaging Atmospheric Cherenkov Telescopes (IACTs) in detecting very high energy gamma rays from a number of discrete sources, wide-acceptance air shower arrays, either of particle or Cherenkov light detectors, have to date produced very little evidence for any photon signal. Leaving aside some early claims, now discredited, the most significant reported detection is at the level of about five times the cosmic ray background fluctuations (Amenomori (1999)). The obvious disadvantages of these detectors with respect to IACTs are, first, their higher energy threshold, resulting from the limited reach of the particle component of showers in the atmosphere (in the case of particle detectors), or from the difficulty of discriminating the faint Cherenkov light flashes from the light of the Night Sky Background (NSB), integrated over a large fraction of the sky (of about 1 sr), and second, the lack of powerful methods to discriminate between gamma- and hadron-initiated showers, in the absence of muon detectors. These handicaps are in part compensated by the large field of view, which allows for the simultaneous monitoring of a large number of candidate sources.
Readers interested in the basis, history and classical results of gamma-ray astronomy, in the range of energies studied in this paper, may consult the excellent review by Hoffman and collaborators (Hoffman (1999)). Some recent results published by experiments other than HEGRA using wide-acceptance air shower detectors have been included in the bibliography (see for example references: Amenomori (1999), Atkins (1999), Atkins (2000), Borione 1997a , Borione 1997b , McKay (1993) and Wang (2001)).
The HEGRA AIROBICC and scintillator arrays, decommissioned in March 2000, rank among the highest sensitivity air shower arrays constructed up to date. This paper presents the analysis of the data produced by them during most of their active life time, with respect to the search for point sources of very high energy gamma radiation. The present work updates previous results obtained on smaller data sets, obtained either using the same analysis procedure (Contreras (1998); Moralejo (2001)) or with slightly different approaches (Prahl (1997); krawczynski (1997); Schmele (1998); Götting (1999)).
Earlier publications dealing with the HEGRA arrays address: a description of AIROBICC performance (Karle 1995a ), the search for gamma-ray point sources using the first year of data of the detector, a data set not included in this analysis (Karle 1995b ), a search for Gamma Ray Bursts (Padilla (1998)), an analysis of the Chemical Composition of Very High Energy (VHE) Cosmic Rays (Arqueros (2000)), and two studies of the diffuse VHE gamma ray background (Aharonian (2001); Karle 1995c ).
2 The HEGRA Experiment
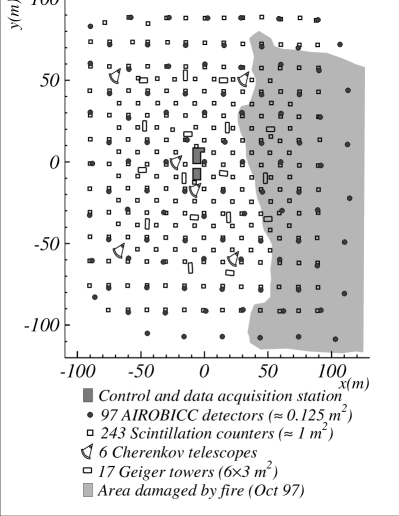
The HEGRA experiment (Barrio (1998)) is a multicomponent air shower detector located 2200 m a.s.l. on the Canary island La Palma ( N, W). The two sub-detectors relevant for this analysis (fig. 1) are an array of 243 scintillation counters, and the wide-acceptance Cherenkov array AIROBICC (Karle 1995a ), consisting of 97 non-imaging 0.12 m2 light detectors, both of them covering roughly an area of 200200 m2. The scintillator array and AIROBICC became operational in 1988 and 1992 respectively, but the figures quoted above refer to the most complete versions of the HEGRA arrays, which went through several upgrades during their lifetime. In October 1997, a fire destroyed 89 stations. The AIROBICC array was fully reconstructed after the accident, whereas the number of scintillator counters was reduced to 182, this being the final setup until the decommissioning of the two detectors in Spring 2000.
Primary cosmic rays (including photons) impinging on the atmosphere initiate extensive air showers (EAS) of relativistic particles. The HEGRA scintillators detect charged particles at ground level, as well as secondary gammas, converted in a thin lead layer placed on top of each detector. The light produced in the plastic scintillator is viewed from below by one or two photomultipliers installed at the bottom of a light-tight hut, which allows the operation of the array even in daylight. AIROBICC stations consist of a 20 cm diameter hemispherical photomultiplier, coupled to a Winston cone light collector, receiving directly Cherenkov radiation from EAS. Therefore, and in contrast to the scintillator array, AIROBICC can work only during dark nights, a fact which restricts its operation to a maximum of about of the total time. In the present work, only data registered in coincidence by both arrays have been analyzed (a similar study using only scintillator data can be found in Schmele (1998)).
3 Shower reconstruction
The AIROBICC stations register the Cherenkov light flux and arrival times of the shower front at the huts whenever the trigger condition ( 6 or 8 fired stations within 200 ns, depending on the detector configuration) is fulfilled. The resulting trigger rate varies between 20 and 30 Hz. Only the data from detectors above threshold (roughly 5000 photons/m2 in the spectral range 300–450 nm) are recorded. Similar data are registered by the scintillation counters for the particle shower front.
The shower core impact point on the ground is estimated from the distribution of the scintillator amplitude signals (density of e± and secondary ), via a simple center of gravity procedure, and from the Cherenkov light distribution as measured by AIROBICC, through a fit in which a radial symmetric light distribution is assumed and where the core coordinates are free parameters. Once the core position is known, the shower direction is reconstructed exclusively from the timing of AIROBICC, by fitting the time structure of the Cherenkov light front to a cone (of fixed semi-angle ) whose axis goes through the core. The fit procedure is iterated three times for every shower. After each step, signals lying far from the fitted shower front, probably coming from NSB fluctuations, are tagged and not included in the following one. The scintillator array timing data is not used for the direction determination due to its intrinsically poorer time resolution. The shower direction thus obtained in local coordinates is transformed to celestial coordinates by using the UTC time stamp on each event, which is provided by a Rubidium clock.
The lateral distribution of e± and secondary as measured by the scintillator array is fitted to an NKG formula, from which the shower size and age are derived. Finally, the dependence of the measured density of Cherenkov photons with the distance to the shower axis is fitted to an exponential , where is the so-called light radius. These parameters are used, in the present analysis, only to identify nights with poor observation conditions, by comparison of their distributions with those obtained from a Monte Carlo simulation. The development of showers in the atmosphere was simulated using the CORSIKA code, version 4.068 (Capdevielle (1992)). Details on the detector simulation can be found in Mart nez (1995).
3.1 Detector calibration
Special calibration runs, interleaved with data acquisition every twenty minutes, were used to obtain the pedestals of the ADC channels, as well as the conversion factors to translate the TDC channels readout into ns.
The effect of temperature variations in the propagation speed of signals from the huts to the central data acquisition station was monitored by using light pulses produced during the calibration runs by a small LED located above every photomultiplier. The delays measured in this way were fine-tuned for every run by studying the mean deviations of each detector with respect to the fitted shower front, in a preanalysis of extensive, well measured, showers. An estimate of the time resolution of the detectors is also obtained in this preanalysis, allowing us to weight them accordingly in the final shower reconstruction.
The conversion factors from ADC counts to number of particles reaching the scintillation counters were computed from the position of the single MIP (Minimum Ionizing Particle) peak in the individual counters spectra, registered in real, shower-triggered events. The relative gains of the AIROBICC stations were adjusted by normalizing the high-amplitude tails of their ADC spectra (in the region, well above threshold, where the efficiency of all the detectors is 1), once the known nonlinearities in the amplification chain are corrected.
3.2 Angular resolution
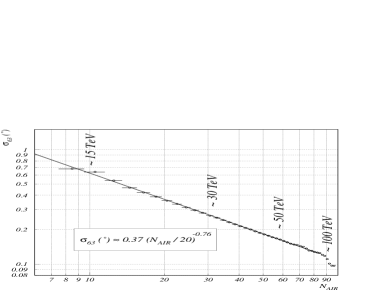
A delicate point is the computation of the angular resolution of the detector, since no source was found by the experiment, impeding the use of real data to this end. A three step procedure was followed using Monte Carlo simulations and real data. First the data set was divided in periods of stable hardware configuration, within which the angular resolution can not change significantly. Then, for each real data run the AIROBICC array huts were divided into two subsets in a configuration resembling that of chessboard black and white squares. Events were reconstructed independently with each subarray and the two resulting directions compared. The same procedure was applied to Monte Carlo simulated showers, where the true direction, and hence the angular resolution, is known. It was finally assumed that the relation between the angular resolution and the outcome of the chessboard procedure observed in the Monte Carlo holds in the real data. In this way, the angular resolution as a function of the number of fired stations was obtained for each of the subperiods mentioned above. The result for the last of them is shown in figure 2. The angular resolution thus found improves from about 0.8∘ at threshold to below 0.1∘ for large showers firing the whole array.
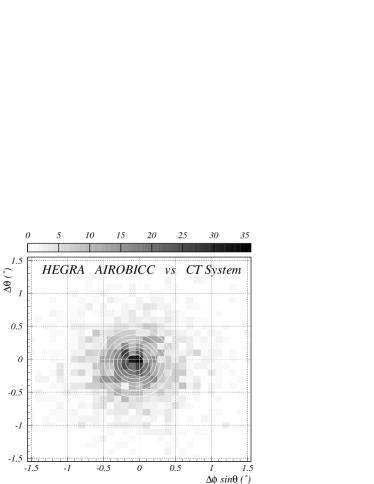
An upper limit on the pointing inaccuracy was set comparing the directions reconstructed by the HEGRA system of 5 Cherenkov Telescopes (Daum (1997)) with those provided by AIROBICC for a set of common events (fig. 3). The absolute pointing of the IACT system, which has successfully detected several TeV point-like sources, is known to be better than 0.01∘ (Pühlhofer (1997)). With this procedure, the AIROBICC mispointing was found to be less than 0.15∘ at the confidence level.
4 The Data Set
The data analyzed in the present work were registered in coincidence by the AIROBICC and scintillator arrays during clear, moonless nights between August 1994 and March 2000. The evolution of the number of reconstructed showers is presented in figure 4. The period between July 1996 and June 1997 was excluded a priori due to a hardware error which worsened the detector’s angular resolution significantly. After this exclusion, the data sample consists of events for which at least the shower direction was successfully determined, corresponding to an effective on-time of 3921 hours. The one-night average values of trigger rates, and of some reconstructed quantities like the effective radius of the Cherenkov light pool (light radius, see §3), were used to identify and remove from the data set observation nights with poor atmospheric conditions, as well as those with various hardware problems resulting in abnormal shower reconstruction. About 1080 hours of observations were rejected on these grounds, reducing the data set to reconstructed showers.

5 Data Analysis
For this analysis we define a standard sample of events by requiring that the per degree of freedom of the cone fit to the Cherenkov light front is smaller than 3. This cut removes about of the events from the data set. After this cut, the AIROBICC energy threshold turns out to lie between 13 and 20 TeV for vertically incident photons, depending on the detector configuration (in particular, on the density of AIROBICC counters, which was doubled in the 1997 upgrade). This can be inferred from the comparison of the known integral cosmic-ray flux and the observed rate of events, which provides us with a sort of average hadron threshold, then converted to a gamma threshold with the help of the Monte Carlo simulation. The threshold is more or less constant up to a zenith angle , and then increases rapidly with (at it is already higher than at zenith).
Different searches have been performed on the selected sample of events. We have searched for signs of continuous and sporadic emission on a selected sample of sources and for continuous emission in the wide region of the northern hemisphere sky accessible to AIROBICC. The details are given in the following sections.
No use of gamma/hadron separation methods has been made in any of the searches detailed below, as in Karle 1995b , in contrast with other analyses (Götting (1999)). The reason is that any such method requires optimal detector performance and observation conditions, since more shower parameters are needed other than incidence direction. Hence, tight quality cuts must be applied to the data, both in the selection of valid nights (resulting in a loss of statistics, specially after the fire, due to the incomplete scintillator array), and in the event filter (increasing the effective energy threshold of the detector, which we want to keep as low as possible). Nevertheless, the large statistics gives the present analysis a gain in sensitivity compared to previous ones.
Detailed studies on the gamma / hadron separation capabilities of non-imaging air-shower arrays can be found in Prahl (1999) and Moralejo (2000).
5.1 Search for predefined point sources
A sample catalog of candidates, both galactic and extragalactic, was used for point source searches, of sporadic and continuous excesses. The detailed list of 196 candidate sources within the AIROBICC field of view, which can be found in Moralejo (2000), includes mainly:
-
•
All firm and tentative TeV detections (table 1).
-
•
Sources monitored regularly by the RXTE ASM (ASM (1997)).
-
•
A set of nearby active galaxies monitored by the HEGRA Cherenkov telescopes (see table 2).
-
•
EGRET sources with error boxes smaller than 10 arc minutes, from the third EGRET catalog (Hartman et al. (1999)).
-
•
Well localized GRBs, from Greiner (2000).
-
•
X-Ray binaries, from Guseinov (1999).
-
•
Supernova remnants with small angular extension from Green (1997).
The analysis method used was based on counting the events in a circular ON region around the position of the source. The optimal angular radius of the ON region, which is between 0.30 and , has been computed independently for five data subsets defined by major changes in the detector configuration. The radius was chosen as the one which would maximize the sensitivity of the method, after estimating the angular resolution for the period, taking into account its dependence with the number of fired huts and the composition of the standard sample in terms of this variable. The possible maximum mispointing of the array has also been considered in this calculation.
The number of ON-source events is compared with the expected number of background events, computed from a Monte Carlo simulation. For the simulation we have followed the lines of Alexandreas (1993), generating 100 fake events for every true one, following the directional distribution of real data in local coordinates (which is stable within each of the five subsets mentioned above), and with its same time coordinate. The significance of the excesses was then computed from the ON and background numbers using standard methods (Li & Ma (1983)). In order to compute a limit on the flux collected from each source, we did first derive a limit on the number of excess events in the ON bin, at C.L., using the formulas of Helene (1983). Comparing this number with the expected number of background events, and given the known flux of Cosmic Rays around the source, the limit on the number of excess events is converted into a limit on the flux of gamma rays from the chosen source.

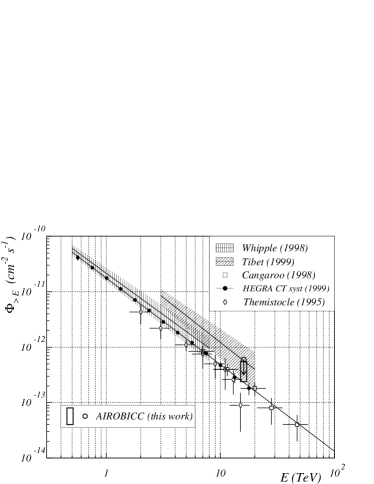
The results for the search for continuous excesses were negative. Limits for the best known northern hemisphere TeV sources can be found in table 1, those for the full list have been compiled in table 2, at the end of the paper. Figure 5 shows the distribution of the significances of the excesses in the sample, which is compatible with the distribution which would result from the poissonian fluctuations of the hadronic cosmic ray background. As it can be seen in the plot, no significant excess is found in the data. The Crab nebula shows a modest excess of 2.5 standard deviations above the background (4474 observed events for an expected background of 4305.01), the second largest excess out of the 196 targets. If we interpret this excess as due to photons, the resulting integral flux for TeV, is roughly compatible with measurements from other experiments, as is shown in figure 6.
The average gamma energy threshold of the observations for each source depends on its declination, since it determines the mean elevation of the source above the horizon. The declinations of the 196 selected objects are distributed within 40 degrees around the geographical latitude of La Palma, resulting in thresholds between 15 and 70 TeV (with only of sources above 30 TeV). We can then convert the flux limit derived for each source to units of the integral flux of the Crab Nebula for the corresponding energy (in the following, crabs). We have used for this purpose the measurements of the HEGRA system of Cherenkov telescopes (Aharonian (2000)), . The distribution of the flux upper limits for the 196 sources peaks at about 1.3 crabs. The detailed list of the results can be found in table 2.
The procedure outlined above was also applied to the search for possible sporadic emission, by analyzing the event statistics for each candidate source night by night. With the data selection cuts defining our standard sample, the number of on-source events collected in one night for any given target was always less than 80 (since the time spent within the AIROBICC field of view is limited to about 5 hours). In order to overcome the difficulties associated with the small number of events, a different statistical treatment was applied to evaluate the significance of the observed excesses: the relevant quantity is now , the poissonian probability of obtaining, given the background, an excess at least as large as the observed one (Alexandreas (1993)). The resulting spectrum is shown in fig. 7, together with the expectation in the absence of sources (obtained from a Monte Carlo simulation). Both are found to be compatible. The little bumps in the distributions (for instance at ) are not statistical fluctuations, but a result of the discrete nature of the variables involved (, ). Details can be found in Moralejo (2000). The smallest value found for is . Once the number of analyzed nights and sources is taken into account, giving a total of 53269 trials, it can be seen that a pure background distribution would produce at least one such excess with a probability of , and therefore no evidence for sporadic emission from any of the sources can be drawn.

The daily results for Mkn 501 during its extraordinary outburst in 1997 were carefully studied. The data set contained 36 valid nights in this period, none of which showed significantly low values for this source. No correlation was found either with the daily fluxes measured by the HEGRA collaboration at 1 TeV (Aharonian 1999a ; Aharonian 1999c ). The integrated AIROBICC data for this season shows no significant excess. Given the average flux of 4 crabs at 1 TeV, and the AIROBICC sensitivity, the lack of detection can be attributed to the softening of the spectrum beyond a few TeV. This fact is shown graphically in figure 8, where the AIROBICC limit is compared with the average spectrum measured during the outburst by the HEGRA system of Cherenkov Telescopes (Aharonian 1999b ).
5.2 All sky search

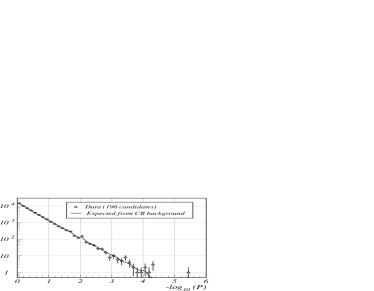
Although handicapped by their high energy thresholds and lack of efficient gamma/hadron separation capabilities, air shower arrays have a strong point in all-sky searches. The field of view of AIROBICC is about one stereo-radian and its geographic position allows it to scan, within one year, the northern hemisphere in the region of declinations between 0 and 60∘. For the all-sky map presented here, we have used a different search method than the one described for predefined candidate sources. The sky is divided into square bins of constant width in declination () and variable width in right ascension, proportional to , so that all of them cover the same solid angle ( sr). The size of the bins is the same for all the observation periods, which makes the analysis simpler at the expense of a small loss of sensitivity. The use of a square bin instead of a round one has hardly any effect on the efficiency of the search (Alexandreas (1993)). To ensure that a significant fraction of the photons from any potential source is contained in at least one bin, nine overlapping grids have been built, by shifting the original one by one third of the bins’ width in both axes. About of the events coming from a point source (the exact fraction depending on detector’s configuration) is, in the worst case, contained in at least one of the bins. The background is estimated in the same way as described in §5.1. Once more, the distribution of significances for the non-independent search bins, which can be seen in fig. 9, does not deviate from the background expectation.
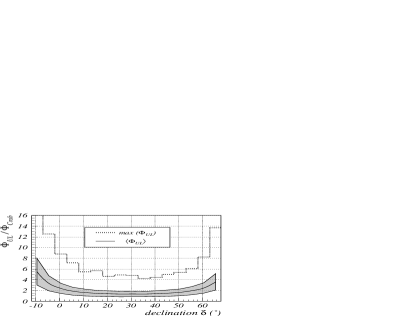
Global flux upper limits (at C.L.) for point sources in the northern hemisphere are shown in fig. 10 as a function of declination. The average gamma energy threshold varies from about 15 TeV at to TeV at and . In this declination band the mean flux limits lie in the range 1.3 to 2.5 crabs, and the absolute ones (derived from the largest excesses seen in declination bands wide) are between 4.2 and 8.8 crabs.
This analysis improves the results of the all-sky search presented in Götting (1999), based on a two-year data set taken with the first version of AIROBICC (with 49 stations). Although a gamma / hadron separation method was used in that previous work, the increased statistics of the present analysis results in an improvement of the flux upper limits, assuming Crab-like spectra (to account for the different energy thresholds), of about .
6 Conclusions
An analysis of AIROBICC data taken within 5 years, up to its decommissioning in Spring 2000, in search of emission from point-like sources has been presented. No compelling evidence for any gamma signal was found. Flux upper limits (at C.L.) of typically around 1.3 times the flux of the Crab Nebula have been obtained for the steady emission from a catalog of 196 candidate sources. No significant episode of emission on the time scale of one observation night has been found from any of the candidates. Finally, an all-sky search has yielded absolute flux upper limits between 4.2 and 8.8 crabs, depending on declination, for continuous emission in the fraction of sky accessible by the detector.
Acknowledgements.
We wish to thank the authorities of the IAC (Instituto Astrof sico de Canarias) and the ORM (Observatorio del Roque de los Muchachos) for the permission to use the HEGRA site and the ORM facilities. This work was supported by the CICYT (Spain) and BMBF (Germany).References
- ASM (1997) ASM/XTE teams, XTE ASM Catalog (latest version available on the WWW at http://heasarc.gsfc.nasa.gov/docs/xte/SOF/ ).
- Aharonian (2001) Aharonian, F., et al., Limits on the TeV flux of diffuse gamma rays as measured with the HEGRA air shower array, accepted for publication in Astropart. Phys. Preprint astro-ph/0109145.
- Aharonian (2000) Aharonian, F., et al., The Energy Spectrum of TeV Gamma Rays from the Crab Nebula as Measured by the HEGRA System of Imaging Air Cherenkov Telescopes, ApJ 539, 317, 2000.
- (4) Aharonian, F., et al., The temporal characteristics of the TeV gamma-radiation from Mkn 501 in 1997, I. Data from the stereoscopic imaging atmospheric Cherenkov telescope system of HEGRA, A&A 342, 69, 1999.
- (5) Aharonian, F., et al., The time averaged TeV energy spectrum of Mkn 501 of the extraordinary 1997 outburst as measured with the stereoscopic Cherenkov telescope system of HEGRA, A&A 349, 11, 1999.
- (6) Aharonian, F., et al., The temporal characteristics of the TeV gamma-emission from Mkn 501 in 1997, II. Results from HEGRA CT1 and CT2, A&A 349, 29, 1999.
- Alexandreas (1993) Alexandreas, D. E. et al., Point source search techniques in ultra high energy gamma ray astronomy, NIM A 328, 570, 1993.
- Amenomori (1999) Amenomori, M. et al., Observation of Multi-TeV Gamma Rays from the Crab Nebula using the Tibet Air Shower Array, ApJ 525, L93, 1999.
- Arqueros (2000) Arqueros, F., et al., Energy Spectrum and Chemical Composition of Cosmic Rays between 0.3 and 10 PeV determined from the Cherenkov light and charged-particle distributions in air showers, A&A 359, 682, 2000.
- Atkins (1999) Atkins, R. et al., TeV observations of Markarian 501 with the Milagrito water Cherenkov detector, ApJ 525, L25, 1999.
- Atkins (2000) Atkins, R. et al., Evidence for TeV emission from GRB 970417a, ApJ 533, L119, 2000.
- Barrio (1998) Barrio, J.A. et al., Status and New Results of the HEGRA Experiment, Proc. of the 16th European Cosmic Ray Symposium, 507, 1998.
- (13) Borione, A. et al., High Statistics Search for Ultrahigh Energy Gamma-Ray Emission from Cygnus X-3 and Hercules X-1, Phys. Rev. D 55, 1714, 1997.
- (14) Borione, A. et al., A Search for Ultrahigh Energy Gamma-Ray Emission from the Crab Nebula and Pulsar, ApJ 481, 313, 1997.
- Capdevielle (1992) Capdevielle, J.N. et al., The Karlsruhe Extensive Air Shower Simulation Code CORSIKA, KfK Report 4998, Institut für Kernphysik, Karlsruhe.
- Contreras (1998) Contreras, J.L. et al., Search for Gamma Rays from Point Sources with the HEGRA AIROBICC array, Proc. of the 16th European Cosmic Ray Symposium, 511, 1998.
- Daum (1997) Daum, A. et al., First results on the performance of the HEGRA IACT array, Astropart. Phys 8, 1, 1997.
- Götting (1999) Götting, N. et al et al., A Partial Sky Survey for Point Sources of 20 TeV Gamma Rays Using the HEGRA AIROBICC and Scintillator Arrays, Proc. of the 26th International Cosmic Ray Conference, Vol. 3, 414, 1999.
- Green (1997) Green D.A., 1997, A Catalogue of Galactic Supernova Remnants. Mullard Radio Astronomy Observatory, Cavendish Laboratory, Cambridge, United Kingdom (latest version available on the WWW at http://www.mrao.cam.ac.uk/surveys/snrs/ ).
- Greiner (2000) Greiner, J. et al., GRBs localized with WFC (BSAX) or BATSE/RXTE or ASM (RXTE) or IPN or HETE. http://www.aip.de/ jcg/grbgen.html
- Guseinov (1999) Guseinov, O. et al., A catalogue of Low and High Mass X-Ray Binaries. http://astroa.physics.metu.edu.tr/XRBC/
- Hartman et al. (1999) Hartman R.C. et al. 1999., The Third EGRET Catalog of High-Energy Gamma-Ray Sources. ApJS 123,1 79-202.
- Helene (1983) Helene, O., Upper limit of peak area, NIM 212, 319, 1983.
- Hoffman (1999) Hoffmann, C.M. et al., Gamma-ray astronomy at high energies, Rev. Mod. Phys. 71, 4, 1999.
- (25) Karle, A. et al., Design and performance of the angle integrating Cherenkov array AIROBICC. Astropart. Phys. 3, 321, 1995.
- (26) Karle, A. et al., Search for gamma radiation above 24 TeV from cosmic point sources. Astropart. Phys. 4, 1, 1995.
- (27) Karle, A. et al., Search for isotropic gamma radiation in the cosmological window between 65 and 200 TeV, Phys. Lett. B 347, 161, 1995.
- krawczynski (1997) Krawczynski, H., Search for TeV Counterparts of Gamma-Ray Bursts with the HEGRA Detector, Ph. D. thesis, Universität Hamburg 1997. Available at http://www-hegra.desy.de/publications.html
- Li & Ma (1983) Li, T. and Ma, Y., Analysis Methods for Results in Gamma-Ray Astronomy, ApJ 272, 317, 1983.
- Mart nez (1995) Mart nez, S. et al., Monte Carlo simulation of the HEGRA cosmic ray detector performance, NIM A 357, 567, 1995.
- McKay (1993) McKay, T.A. et al., A northern sky survey for astrophysical point sources of 100 TeV gamma radiation, ApJ 417, 742, 1993.
- Moralejo (2000) Moralejo, A., B squeda de fuentes c smicas de radiaci n gamma de muy alta energ a con el detector AIROBICC, Ph. D. thesis, Universidad Complutense de Madrid, 2000. Available at http://www.gae.ucm.es/tesis/
- Moralejo (2001) Moralejo, A. et al., Search for point sources of gamma radiation above 15 TeV with the HEGRA AIROBICC array, Proc. of the 27th International Cosmic Ray Conference, 2570, 2001.
- Padilla (1998) Padilla, L. et al., Search for gamma-ray bursts above 20 TeV with the HEGRA AIROBICC Cherenkov array, A&A 337, 43, 1998.
- Prahl (1997) Prahl, J. et al., A search for gamma-rays from potential Galactic sources for energies above 20 TeV with the HEGRA scintillator and AIROBICC arrays, Proc. of the 25th International Cosmic Ray Conference, Vol. 3, 217, 1997.
- Prahl (1999) Prahl, J., Suche nach kosmischen Gamma-Punktquellen oberhalb von 20 TeV mit den HEGRA-Detektorfeldern, Ph. D. thesis, Universität Hamburg 1999. Available at http://www-hegra.desy.de/publications.html
- Pühlhofer (1997) Pühlhofer, G. et al., Locating TeV gamma-ray sources with sub-arcminute precision: the pointing calibration of the HEGRA system of Imaging Atmospheric Cherenkov Telescopes, Astropart. Phys 8, 101, 1997.
-
Schmele (1998)
Schmele, D., Himmelsdurchmusterung mit dem HEGRA Szintillatorfeld,
Ph. D. thesis, Universität Hamburg 1998. Available at
http://www-hegra.desy.de/publications.html - Wang (2001) Wang, K. et al., A survey of the northern sky for TeV point sources, ApJ 558, 477, 2001.