The peculiar variable V838 Mon
Abstract
V838 Mon underwent, after a first nova–like outburst in January and a usual decline, a second outburst after one month, and a third weak one again a month later. Moreover a very small increase of the temperature at the beginning of April gives us a hint on a physical process with a period of one month. We obtained a time sequence and modelled the photometric behaviour of the object. This leads us to the conclusion that the interstellar foreground extinction has to be 06 EB-V 08 and that the quasi-photosphere had persistently unusually low temperatures for nova–like systems. The photometry was used to follow the dramatic changes of the expansion. While the appearing 10 m excess can be well described by the heating of material ejected during this event, the IRAS emission near the location of the progenitor, originates most likely from dust, which were formed during the previous evolution of the object. Assuming that the light echoes are coming from circumstellar material, the distance is 640 to 680 pc – smaller than the 790 pc given in Munari et al. (2002). In our opinion V838 Mon and V4332 Sgr are manifestations of a new class of eruptive variables. We do not count M31 RV to this class.
keywords:
STARS: individual: V838 Mon1 Basic data
V838 Mon was discovered by Brown et al. [2002] on 2002 January 6. Pre–discovery images show the target first on 2002 January 1. On February 2 the second ’outburst’ ( = 36) was monitored in detail (Kimeswenger et al. 2002a). Such a behaviour of an extremely long pre-max halt or even a decline followed by a strong outburst was, according to our knowledge, never observed before in nova–like outburst, although HR Del and V723 Cas showed some similarities (Terzan et al. 1974; Dürbeck 1981, Munari et al. 1996).
Our data were obtained with the Innsbruck 60cm telescope (Kimeswenger 2001; Kimeswenger & Lederle 2002) and a direct imaging CCD device. Until March 5 a CompuScope Kodak 0400 CCD (46 31 field of view) was used. Thereafter and in the night of February 8 an AP7p SITe 502e (836 836) was attached to the system.

1018 images were taken in 31 nights between 2002 January 14 and April 13 using and filters. Average values for each day are given in Table 1 and the resulting light curves shown in Fig. 1. The complete data table containing all individual measurements will be published elsewhere (Kimeswenger et al. 2002b).
| JD | day of | V | B-V | V-R | R-IC | V-IC |
|---|---|---|---|---|---|---|
| 2002 | ||||||
| 2452289.39 | 13.89 | 9.80 | 1.83 | 0.92 | 0.89 | 1.80 |
| 2452290.36 | 14.86 | 9.85 | 1.89 | 0.88 | 0.93 | 1.81 |
| 2452292.34 | 16.84 | 9.96 | 1.90 | 0.97 | 0.91 | 1.88 |
| 2452300.30 | 24.80 | 10.24 | 2.03 | 1.04 | 0.93 | 1.97 |
| 2452304.36 | 28.86 | 10.51 | 2.05 | 1.05 | 1.02 | 2.06 |
| 2452307.33 | 31.83 | 10.71 | 2.10 | 1.06 | 1.02 | 2.08 |
| 2452308.33 | 32.83 | 8.14 | 1.41 | 0.76 | 0.81 | 1.57 |
| 2452308.42 | 32.92 | 8.03 | 1.38 | 0.78 | 0.79 | 1.57 |
| 2452308.50 | 33.00 | 7.94 | 1.34 | 0.80 | 0.77 | 1.57 |
| 2452309.32 | 33.82 | 7.48 | 1.33 | 0.78 | 0.75 | 1.53 |
| 2452310.38 | 34.88 | 7.12 | 1.23 | 0.74 | 0.77 | 1.51 |
| 2452314.37 | 38.87 | 7.20 | 1.16 | 0.80 | 0.72 | 1.52 |
| 2452317.32 | 41.82 | 7.61 | 1.41 | 0.79 | 0.77 | 1.55 |
| 2452318.32 | 42.82 | 7.68 | 1.50 | 0.80 | 0.77 | 1.56 |
| 2452321.38 | 45.88 | 7.84 | 1.67 | 0.92 | 0.87 | 1.79 |
| 2452322.29 | 46.79 | 7.78 | 1.79 | 0.89 | 0.88 | 1.76 |
| 2452323.34 | 47.84 | 7.83 | 1.76 | 0.95 | 0.83 | 1.78 |
| 2452334.26 | 58.76 | 7.95 | 2.26 | 1.07 | 0.98 | 2.05 |
| 2452338.36 | 62.86 | 7.41 | 2.02 | 0.97 | 0.90 | 1.87 |
| 2452339.27 | 63.77 | 7.39 | 1.91 | 1.03 | 0.93 | 1.95 |
| 2452341.31 | 65.81 | 7.21 | 1.88 | 1.01 | 0.90 | 1.91 |
| 2452342.31 | 66.81 | 7.14 | 1.89 | 1.00 | 0.90 | 1.90 |
| 2452343.28 | 67.78 | 7.12 | 1.90 | 1.01 | 0.90 | 1.90 |
| 2452344.28 | 68.78 | 7.11 | 1.93 | 1.01 | 0.88 | 1.90 |
| 2452345.29 | 69.79 | 7.14 | 1.97 | 1.02 | 0.89 | 1.92 |
| 2452347.26 | 71.76 | 7.20 | 2.05 | 1.06 | 0.90 | 1.96 |
| 2452349.27 | 73.77 | 7.35 | 2.15 | 1.11 | 0.96 | 2.07 |
| 2452361.31 | 85.81 | 7.60 | 2.48 | 1.29 | 1.05 | 2.34 |
| 2452362.29 | 86.79 | 7.62 | 2.51 | 1.30 | 1.08 | 2.38 |
| 2452364.30 | 88.80 | 7.66 | 2.57 | 1.33 | 1.09 | 2.42 |
| 2452367.30 | 91.80 | 7.84 | 2.51 | 1.45 | 1.10 | 2.55 |
| 2452369.30 | 93.80 | 7.79 | 2.58 | 1.33 | 1.19 | 2.52 |
| 2452375.30 | 99.80 | 8.33 | 2.64 | 1.50 | 1.32 | 2.82 |
| 2452378.30 | 102.80 | 8.71 | 2.66 | 1.56 | 1.44 | 3.00 |
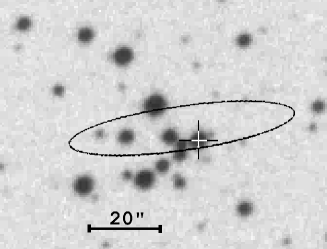
Wagner et al. [2002] mention that the object on the sky survey plate is a blend of at least two objects. To identify unambiguously the progenitor, CCD frames from January and SuperCOSMOS sky survey plate scans were astrometrically calibrated. The difference in position is below 30 mas (see Fig. 2).

Furthermore a set of deep and images were taken to calibrate the stars surrounding V838 Mon on the SuperCOSMOS frames (Fig. 3). Using the colour corrections from Hörtnagl et al. (1992), we find the pre–outburst magnitudes 010 and 010. However, the () may be used only with care, since the plate epochs differ by 6.13 years. If the object was already variable, the colour is not meaningful. Our values differ from those given by Munari et al. (2002). This difference in is higher than expected from the different filter sets used ( vs. ). As they give no information on the type of plate scan used in their work (DSS, SuperCOSMOS, …) we are unable to compare the results. No information also is given there, how they transformed POSS E and ESO R (nm). Moreover their conclusion that a red object [(B-V) = 09 in their calibration] has the same magnitude on POSS I (nm) and SERC (nm) is confusing. They also include the -band to the fit of the spectral energy distribution (SED), although this band is known to be strongly affected by non grey opacities at temperatures below 10 000 K. This leads to a lower temperature and thus later on to a lower interstellar extinction.
2 interstellar extinction, temperatures and radii
As the early spectra did not show strong spectral features affecting our wide band photometry (Wagner et al. 2002, Della Valle & Iijima 2002, Geballe et al. 2002a, Zwitter & Munari 2002, Lynch et al. 2002) a blackbody approximation is applicable at m. We used the flux for a given epoch at a wavelength
| (1) |
where is the radius of the photosphere, , the Planck colour temperature and Aλ the interstellar foreground extinction. We applied this to the V and the IC bands, as they are less affected by lines than B and R, to define a colour–dependent quantity
| (2) |
using the interstellar extinction law (Mathis et al. 1977, Koller & Kimeswenger 2001). This leads us to a complete sequence for the temperature as a function of the interstellar extinction (Fig. 4). The relative radii , obtained by the combination of the equations, are independent from the extinction. These radii show a smooth evolution with time that was fitted by means of an empirical function. Using the radius from January 14 as reference we thus can approximate the radius by
| (3) |
with being the day–number of the year 2002. Spectroscopic observations give us now boundaries for the extinction. While the spectroscopy of Wagner et al. (2002) around (namely FeII absorption lines but no SiII) suggests 5100 6000 K and thus 07 EB-V 09, the findings of Zwitter & Munari [2002], and the spectra of Fujii (2002) from yield to 05 EB-V 07. The occurrence of CaII lines before and SiII lines just after the February 2 outburst (Morrison et al. 2002), confines via the Saha equation (assuming that the density did not change significantly within those few days) the increase of temperatures to at least 1:1.36. As the P-Cygni profiles around that time are similar, we have to assume, that the radiation originates from the same region of the shell. So we get a lower limit of 060 EB-V. The SiII disappeared just after a few days. Thus the value should be rather near to that boundary. This gives an estimated density of m-3. The temperature from the NIR continuum (Geballe et al. 2002b), although not very accurate at the beginning Raleigh-Jeans domain of the blackbody, leads to a lower extinction. The non-appearance of TiO bands before April limits the temperature in March and again gives 07 EB-V (Gavin 2002, Morata & Morata 2002). Furthermore, when referring to an extinction of 07 EB-V 08, our results for April fit also very well to the M5 spectral temperature given by Rauch & Kerber [2002]. Thus we assume an interstellar extinction of EB-V 07 for the following calculations.
The resulting temperatures were used to fit a SED also for the dates when NIR data by Bailyn [2002], Geballe et al. (2002a, 2002b), Lynch et al. [2002] and Hinkle et al. [2002] were available. The results for all bands in the V to K range deviate less than 15 percent. Altogether these facts suggest, a simple blackbody model in fact may be applied here.

3 The Distance
Using expansion and diameter of the light echo reported by Henden et al. [2002] and the size from the HST observations (Bond et al. 2002a), we obtain, assuming spherical geometry, a distance of 640 to 680 pc. Munari et al. (2002) obtained a higher value of 790 pc from a different analysis of only the Henden et al. data. The larger distance scale is supported by the measurements of Orio et al. (2002). But the latter are using red bands and are thus less sensitive at the outer edge. Thus the HST calibration, and thereafter the shorter distance, seems more reliable to us. Using the WHT image (Figure 2 in Munari et al. 2002) we also obtain 650 pc and not 790 pc as stated there.
Recently Bond et al. (2002b) reported new HST observations from 2002 May 20. They conclude from the radius of 20″a minimum distance of 2.5 kpc, using the weak peak on March 11 as outburst date. But the light echoes are reported first already mid of February. We thus assume that the February 2 outburst started the illumination of circumstellar material. With respect to the possibility of a slab of material in front of the star, as used in the estimate by Bond et al. (2002b), we like to refer to the detailed discussion in Munari et al. (2002). There it is already shown that such a geometry is very unlikely. Taking into account our assumptions, the USNO and WHT images of Munari et al., the first HST images and the marginal growth of the structure from April 30 until May 20, we conclude that the light has reached the outer boundary of the dust shell. Thus the shell has a size of 0.1 pc. The inner edge has grown since end of April. This is due to the rapid decrease of brightness just 2 weeks before (16 light days are 5″at a distance of 650 pc).
Although the distance is somewhat sensitive to the geometry of the dust around the object, we adopt 650 pc here for the further discussion yielding to M at maximum visual light.
4 IRAS 07015-0346 and the 10 micron excess of V838 Mon
The model of the visual to near infrared photometry gives us a 10 m flux excess (Fig. 5). The 10 m excess was already obvious before the second outburst and increased steadily (Käufl et al. 2002). Using the grey dust temperature (Leene & Pottasch 1988, Evans 1994) and assuming an AGB– or C–star like condensation model with an average K (Dominik et al. 1993) the condensation is possible at m in January and m in February. Assuming a constant dust formation rate in January and again a constant but higher one in February, we find M⊙/yr and M⊙/yr, respectively, leading to reasonable values of 150 to 350 km s-1 for the mass loss wind. The material, causing the light echoes starting in a distance of about m and reaching out to m (measured by us on the HST images) cannot be the origin of the MIR excess.
Kato et al. [2002] stated that the position of the target and that of the IRAS PSC source 07015-0346 correspond very well. The position is far inside the light echoes. Using the space density of IRAS sources within 100 square degrees, a chance for a pure coincident superposition is about 1:50 000. As there are no large CO clouds known in that region, the IRAS PSC source is not very likely connected to a cold background molecular cloud. The source is best fitted with a 353 K blackbody spectrum. At a distance of 650 pc we obtain a dust mass of a few times 10-4 M⊙. A single previous event like the one this year cannot form such a cloud but a continuous phase of massive mass loss by a stellar wind may produce such an environment. We assume that the IRAS PSC source is the dust causing the light echoes. Our dust code NILFISC (Koller & Kimeswenger 2001) and the mass estimate given above, leads to a contribution of the circumstellar material to the total extinction of E. Assuming a typical albedo of 0.6, this leads to a total integrated reflected light of approximately 15 percent of the unreddened star. This is, within a factor of 3, in fact the brightness of the halo on the (polarimetric) HST images April 30, if integrating the nearly constant visual magnitude beginning with the February outburst.
5 Discussion
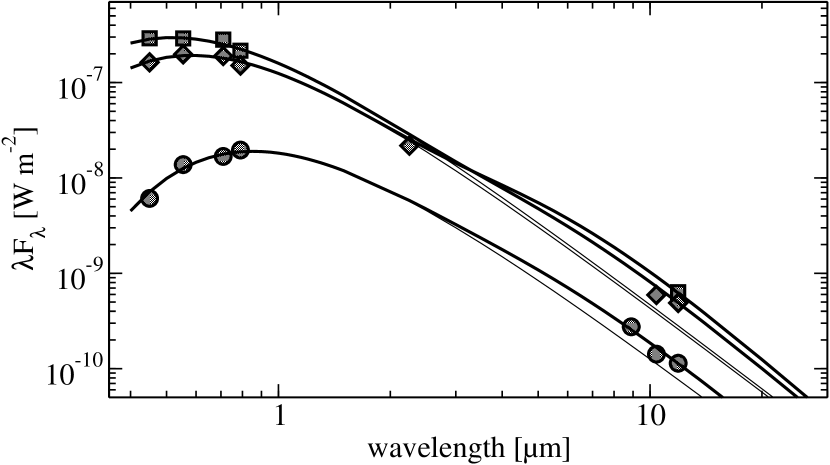
CV or Nova–like outburst ?
Using, although this may be not applicable for this peculiar object, the steady decline after the first primary maximum 2002 January 10, the thick wind models of Hachisu & Kato [2001] suggest a low mass WD with about 1 M⊙. The optical and (2MASS) pre-outburst photometry, even if the use of the colours might be dangerous, is either fitted by a single 7800300 K blackbody or better by a composite of a hot accretion disk with a 4500 K companion. At a distance of 650 pc the absolute visual magnitude would be around +36. A single early F type main sequence star would fit to these values. Using the better fitting double component model and using the accretion disk parameters from Webbink et al. [1987] we obtain a K2-4 main sequence star and a very reasonable accretion rate of M⊙ yr-1. Due to the higher extinction and the different values of the photometry for the progenitor, we do not need an unusual subluminous star as it is used by Munari et al. (2002). The temperatures during outburst are too low for such a classical scenario. Although the models of M31 RV (Iben & Tutukov 1992) allow such a red cold outburst in small period CV with a cold low mass WD, it leads to a higher outburst luminosity (M). Munari et al. (2002) discuss this scenario with respect to a thermonuclear runaway of the complete WD. However M31 RV underwent at least two recurrent outbursts within the rather small timescale of 20 years (Sharov 1990). We thus infer that the nova/CV scenario have to be excluded
A late helium flash post-AGB ?
This scenario (V605 Aql, V4334 Sgr, …) was discussed several times in different IAU circulars. Both, V605 Aql as well as V4334 Sgr, showed a 6000-7000 K photosphere throughout more than one year. The light curves were smooth. For V4334 Sgr (outburst in February 1996) we know now, that it stayed at constant bolometric luminosity for at least seven years. V605 Aql has the same bolometric luminosity even 85 years after its outburst. Even if we adopt a much larger distance and thus a more luminous scenario, we should have a much slower evolution after the outburst. Also the lack of strong carbon overabundance in the spectra clearly rules out this model.
A twin of V4332 Sgr ?
V4332 Sgr underwent a similar outburst in 1994 (Martini et al. 1999 and references therein). Its nature is unclear up to now. While the evolution of the temperature and the expansion of an opaque massive shell and the luminosity at maximum look much the same, V4332 Sgr did not show multiple visual maxima like V838 Mon. This statement, as well as the statement that the ascent to maximum lasted 200 days (Martini et al. 1999), have to be used with care. V4332 Sgr was not observable before the discovery (daytime object). If we compare the light curve and the temperature sequence of V838 Mon with those of V4332 Sgr, we see a good agreement, starting mid of March 2002. It is thus possible, that the earlier features did also exist there. They were simply not observed. A single thermonuclear event, as discussed for V4332 Sgr, still might cause such a behaviour. Also the density of m-2 (Martini et al. 1999) for the late stages fits well to our finding above, if we take into account the 15 times larger radius, compared to the date when we estimated the density. But this does not agree with the main sequence progenitor. Why should a main sequence star undergo a shell flash? Low mass blue horizontal branch (BHB) stars evolve directly to a WD without passing through a luminous AGB phase (Heber et al. 1997). They are stated to be the progenitors of low mass WDs () without planetary nebula. Those stars, at the end of the He-core burning in transition to He-shell burning, pass the main sequence at a similar position in the HR-diagram. This would be a new possible scenario similar to a late He-flash for normal mass progenitors passing through the AGB.
Although it is too early to draw final conclusions, the
photometric behaviour, the temperature and the bolometric
luminosity most likely make V838 Mon a twin of V4332 Sgr. Those
two objects seem to form a new class of eruptive variables. Unlike
Munari et al. (2002), we do not include M31 RV in this group. The
photometric and spectroscopic behaviour and especially the
luminosity of this object seem to differ significantly. We have to
think about possible physical processes causing a star near the
main sequence to ignite eruptive thermonuclear events.
Further observations at all wavelengths of the up to now unstudied
remnant of V4332 Sgr and the new remnant expected after V838 Mon
emerges from its solar conjunction are urged.
Acknowledgments
We thank the head of the institute, R. Weinberger, for the unlimited access to the facilities of the new university observatory. We also thank the referee for his helpful remarks during revision of the paper. This research used data originating from the SuperCOSMOS digitization of UK Schmidt plate material.
References
- [2002] Bailyn C., 2002, IAUC, 7791, 3
- [2002] Brown N.J., Waagen E.O., Scovil C., Nelson P., Oksanen A., Solonen J., Price A., 2002, IAUC, 7785, 1
- [2002a] Bond H.E., Panagia N., Sparks W.B., Starrfield S.G., Wagner R.M., 2002a, IAUC, 7892, 2
- [2002b] Bond H.E., Panagia N., Sparks W.B., Starrfield S.G., Wagner R.M., Henden, A.A., 2002b, IAUC, 7943, 2
- [2002] Della Valle M., Iijima T., 2002, IAUC, 7786, 2
- [1981] Dürbeck H.W., 1981, PASP, 93, 165
- [1993] Dominik C., Sedlmayr E., Gail H.-P., 1993, A&A, 277, 578
- [1994] Evans, A., 1994, The Dusty Universe, (John Wiley & Sons Ltd, New York)
- [2002] Fujii M., 2002, http://www1.harenet.ne.jp/∼aikow/gsc4822_39.gif
- [2002] Gavin M., 2002, http://home.freeuk.com/m.gavin/pecmon02.htm
- [2002a] Geballe T.R., Eyres S.P.S., Evans A., Tyne V.H., 2002, IAUC, 7796, 1
- [2002b] Geballe T.R., Evans A., Smalley B., Tyne V.H., Eyres S.P.S., 2002, IAUC, 7855, 2
- [2001] Hachisu I., Kato M., 2001, ApJ, 553, L161
- [1997] Heber U., Moehler S., Reid I. N., 1997, Proceedings of the ESA Symposium Hipparcos - Venice 97, ESA SP-402, 461
- [2002] Henden A.A., Munari U., Schwartz M., 2002, IAUC, 7859, 1
- [2002] Hinkle K., Joyce R., Wallace L., Rodgers B., 2002, IAUC, 7834, 1
- [1992] Hörtnagl A. M., Kimeswenger S., Weinberger R., 1992, A&A, 262, 369
- [1992] Iben I.Jr., Tutukov A.V., 1992, ApJ, 389, 369
- [2002] Kato T., Yamaoka H., Kiyota S., 2002, IAUC, 7786, 3
- [2002] Käufl H.-U., Locurto G., Kerber F., Heijligers B., 2002, IAUC, 7831, 3
- [2001] Kimeswenger S., 2001, AG Abstr. Ser., 18, 251P
- [2002] Kimeswenger S., Lederle C., 2002, IAUC, 7796, 2
- [2002] Kimeswenger S., Lederle C., Schmeja S., 2002a, IAUC, 7816, 1
- [2002] Kimeswenger S., Lederle C., Schmeja S., Armsdorfer B., 2002b, in preperation
- [2001] Koller J., Kimeswenger S., 2001, ApJ, 559, 419
- [1988] Leene A., Pottasch S.R., 1988, A&AS 202, 203
- [2002] Lynch D.K., Rudy R.J., Mazuk S., Venturini C., 2002, IAUC, 7829, 1
- [1999] Martini P., Wagner M.R., Tomaney A., Rich M.R., della Valle M., Hauschildt P.H., 1999, AJ, 118, 1034
- [1977] Mathis J.S., Rumpl W., Nordsieck K.H., 1977, ApJ, 217, 425
-
[2002]
Morata S., Morata D., 2002,
http://perso.wanadoo.fr/sdmorata/V838/V838Mon.html - [2002] Morrison N.D., Bjorkman K.S., Miroshnichenko A., Wisniewski J.P., 2002, IAUC, 7829, 2
- [1996] Munari U. et al., 1996, A&A, 315, 166
- [2002] Munari U. et al., 2002, A&A, 389, L51
- [2002] Orio M., Harbeck D., Gallagher J., Woodward C., 2002, IAUC, 7892, 1
- [2002] Rauch T., Kerber F., 2002, IAUC, 7886, 2
- [1990] Sharov A.S., 1990, Soviet Astr. Lett., 16, 85
- [1974] Terzan A., Bally M., Durand A., 1974, A&AS, 15, 107
- [2002] Wagner R.M., Halpern J.P., Jackson M., 2002, IAUC, 7785, 2
- [1987] Webbink R.F., Livio M., Truran J.W., Orio M., 1987, ApJ, 314, 653
- [2002] Zwitter T., Munari U., 2002, IAUC, 7812, 3