AE Aquarii: how CVs descend from supersoft binaries
Abstract
AE Aquarii is a propeller system. It has the shortest spin period among cataclysmic variables, and this is increasing on a yr timescale. Its UV spectrum shows very strong carbon depletion vs nitrogen and its secondary mass indicates a star far from the zero–age main sequence. We show that these properties strongly suggest that AE Aqr has descended from a supersoft X–ray binary. We calculate the evolution of systems descending through this channel, and show that many of them end as AM CVn systems. The short spindown timescale of AE Aqr requires a high birthrate for such systems, implying that a substantial fraction of cataclysmic variables must have formed in this way. A simple estimate suggests that this fraction could be of order one–third of current CVs. We emphasize the importance of measurements of the C/N abundance ratio in CVs, particularly via the Civ 1550/Nv 1238 ratio, in determining how large the observed fraction is.
keywords:
novae, cataclysmic variables — binaries: close — stars: evolution — stars: individual: AE Aqr — abundances — stars: individual: AM CVn1 Introduction
AE Aqr is one of the most distinctive cataclysmic variables (CVs). It has a long orbital period of 9.88 hr (Welsh et al., 1993), and the shortest coherent pulse period (33 s), increasing on a timescale yr (de Jager et al., 1994). Doppler tomography reveals the apparent absence of an accretion disc. This has led to its interpretation as a ‘propeller’ system (Wynn et al., 1997): the white dwarf is apparently expelling centrifugally the matter transferred from the companion. To arrive at such a highly non–equilibrium spin rate, the mass transfer rate in the recent ( yr) past must have been much higher than its current value few , and decreased on a still shorter timescale. IUE spectra of AE Aqr (Jameson et al., 1980) reveal the most extreme Civ to Nv ratio of all CVs (Mauche et al., 1997), probably indicating strong carbon depletion and thus CNO cycling. The short spin period makes the system effectively a double–lined spectroscopic binary, with masses for the white dwarf (WD) and for the donor star (Welsh et al., 1995; Casares et al., 1996). The donor star is of spectral type K5V (Welsh, 1999) which is too late for the given orbital period and too early for the measured if it is on the main sequence.
We show here that all of these properties are consistent with the idea that AE Aqr descends from a supersoft X–ray binary, cf. Schenker & King (2002). The thermal–timescale mass transfer characterizing such sources ends once the secondary/primary mass ratio decreases sufficiently, leading to a rapid transition to normal CV evolution driven by angular momentum losses, cf. King (1988). If the white dwarf is magnetic, as in AE Aqr, the high mass transfer rate in the thermal–timescale phase will have spun it up to a short spin period. This must lengthen rapidly in order to reach equilibrium with the lower transfer rate in the CV state, and this spindown is what drives its propeller action. The very short lifetime of the propeller phase implies a high birthrate for such systems, comparable to those of known CVs. This in turn suggests that systems descending from evolutions like AE Aqr must constitute a large fraction of all CVs.
The simple idea that all CVs form with essentially unevolved, low–mass main sequence (MS) donors has been repeatedly challenged for more than a decade (Pylyser & Savonije, 1988a, b; Baraffe & Kolb, 2000; Schenker, 2001; King & Schenker, 2002; Schenker & King, 2002). If mass transfer starts with mass ratio the secondary’s Roche lobe tends to shrink with respect to its thermal–equilibrium radius . Mass is therefore transferred on a thermal timescale ( few yr), at rates high enough to sustain steady nuclear burning on the material accreted by the white dwarf, and thus explain (short-period) supersoft X-ray sources (van den Heuvel et al., 1992; King et al., 2001).
After this relatively brief phase, becomes small enough that shrinks more slowly than , and thermal–timescale mass transfer ends. The systems either evolve off to longer orbital periods, driven by nuclear evolution, or switch to stable, angular-momentum–loss-driven mass transfer like ordinary CVs. We will show that AE Aqr is at the end of this transition phase to a CV, accounting for its strange properties. AE Aqr is passing through this transition very rapidly; its whole evolution up to its current state is short compared to the stable CV phase afterwards. In this sense AE Aqr is not unique at all: a significant fraction of CVs must descend from similar evolutions.
In the next section we derive some rough estimates for the potential progenitor system of AE Aqr, using a simplified analytic description of the orbital evolution during rapid mass transfer. Sect. 3 studies the behaviour of single star models under fixed mass loss of the order expected during such an evolution. This allows us to identify the influence of varying stellar parameters, and establish whether the observed properties of AE Aqr are compatible with this scenario. We present a set of full binary evolution calculations in Sect. 4 and discuss them in Section 5. Section 6 is the Conclusion.
2 Simplified orbital evolution
To get a first idea about the required initial parameters for the progenitor system of AE Aqr, we recall that during thermal–timescale mass transfer additional angular momentum losses (magnetic braking & gravitational radiation) are negligible compared to the changes of the Roche radius resulting from mass transfer itself, e.g. King et al. (2001). We define by
| (1) |
as the fraction of the mass lost from the secondary that is actually accreted on to the WD, while assuming that the rest leaves the system with average specific angular momentum equal to the primary’s, i.e. in the nomenclature of King et al. (2001). From their eq. (10) we obtain the evolutionary tracks as
| (2) |
and
| (3) |
respectively for . For the limit these lead to the exponential expressions given e.g. in King & Ritter (1999).
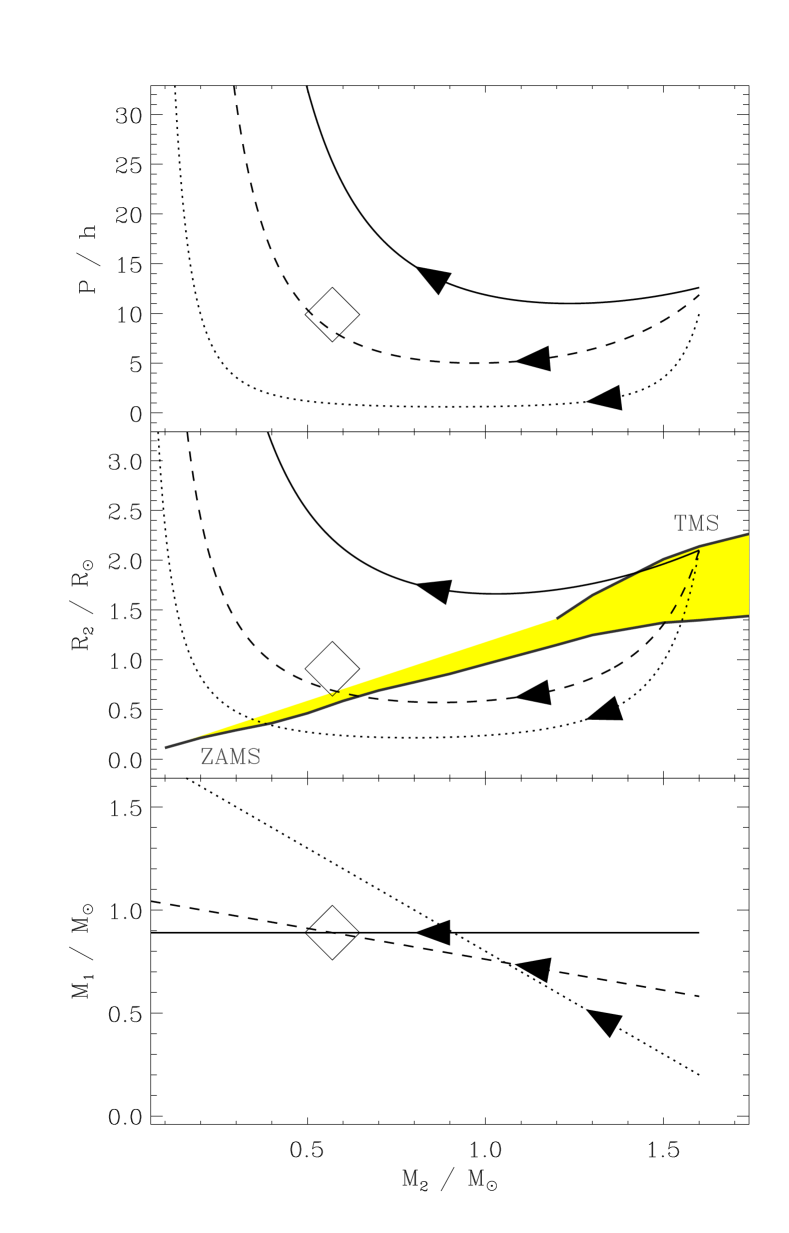
Equipped with these expressions we can estimate where analytically computed curves for the evolution of radius and orbital period intersect those describing mass loss under the assumption of permanent thermal equilibrium (i.e. essentially along the MS). These intersections mark the transition between the fast thermal–timescale mass transfer (supersoft) and CV–like angular–momentum–loss–driven evolution at lower mass transfer rates. Figure 1 shows a set of curves for different together with the shaded location of the MS framed by a pair of thick curves marking the zero–age MS (ZAMS) and the turn–off MS (TMS). For the latter we sue the point of maximal radius prior to core hydrogen exhaustion. Note that this definition is not applicable to MS stars without convective cores (i.e. with masses below ). The lowest panel shows the growth of the WD mass as the donor evolves (from right to left) for various . The initial WD mass is chosen so that the current position of AE Aqr is reached with masses of in accordance with observation. A good fit should also pass through the correct orbital period and radius (estimated by the corresponding period – mean density relation). The assumption of fully conservative mass transfer () leads to much higher WD masses than observed, and we therefore do not consider it further.
Using the curves shown we derive first guesses for the system parameters of the progenitor system, i.e. , , and . We cannot expect these estimates to be very precise, as the actual reaction of the system to mass loss in this transition phase follows neither the Roche curves nor the equilibrium curves (the secondary is out of thermal equilibrium).
Nevertheless we can estimate and , where the upper constraint derives from the occurence of delayed dynamical instabilities (DDI, see King et al. (2001) and discussion section). As explained above, conservative mass transfer gives too high a WD mass. However a value is plausible and gives an mildly increased over the average field WD mass, in accordance with observations of AE Aqr.
3 Single star calculations
We have shown that in principle a recent thermal–timescale mass transfer supersoft phase could explain AE Aqr. We now use full stellar models. This determines the star’s reaction to mass loss, and thus whether the observed spectral type (SpT) may be reached in this way. We simplify the mass transfer history as
| (4) |
where is the secondary star’s Kelvin–Helmholtz time, thus mimicking thermal–timescale mass transfer and the subsequent transition to an evolution driven by angular momentum loss, as in ordinary CVs. The switching mass is chosen so that thermal–timescale mass transfer ends when , i.e. it can be roughly identified with . A more thorough discussion of the exact stability conditions in CVs is presented in Webbink (1985); Sobermann et al. (1997).
The code we use in both the single star case of the last Section and the binary calculations reported here is based on Mazzitelli (1989), as adapted by Kolb & Ritter (1992) plus minor improvements. The mapping from effective temperature to SpT follows the procedure outlined in Beuermann et al. (1998) and Baraffe & Kolb (2000). This is not entirely self–consistent as our code still uses grey atmospheres.
At first we performed a number of calculations for Pop. I stars with 1.2, 1.6 and and initial ages of 0, 0.25, 0.5, 0.75 and 1 of their MS-lifetime, using a switching mass of . As shown in Fig. 2, more massive stars of the same evolutionary phase and further evolved stars of the same mass will both lead to larger equilibrium radii after the thermal–timescale mass transfer.
Single star radii can easily be converted into orbital periods by equating to the corresponding Roche radius (with a primary mass given by ). This allows us to compare our tracks with the observed parameters for AE Aqr, , SpT = K5 and . For the remaining calculations in this section (shown in Figs. 3 and 4) a switching mass of was used. We varied this value slightly for the purpose of testing, but it turned out to have little influence on the fitting of final system parameters.
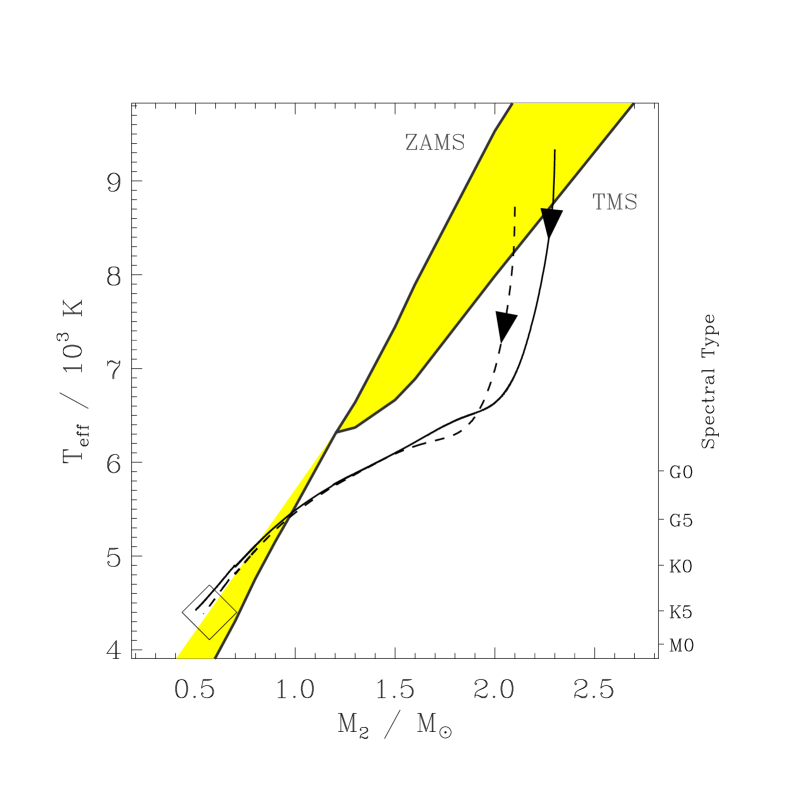
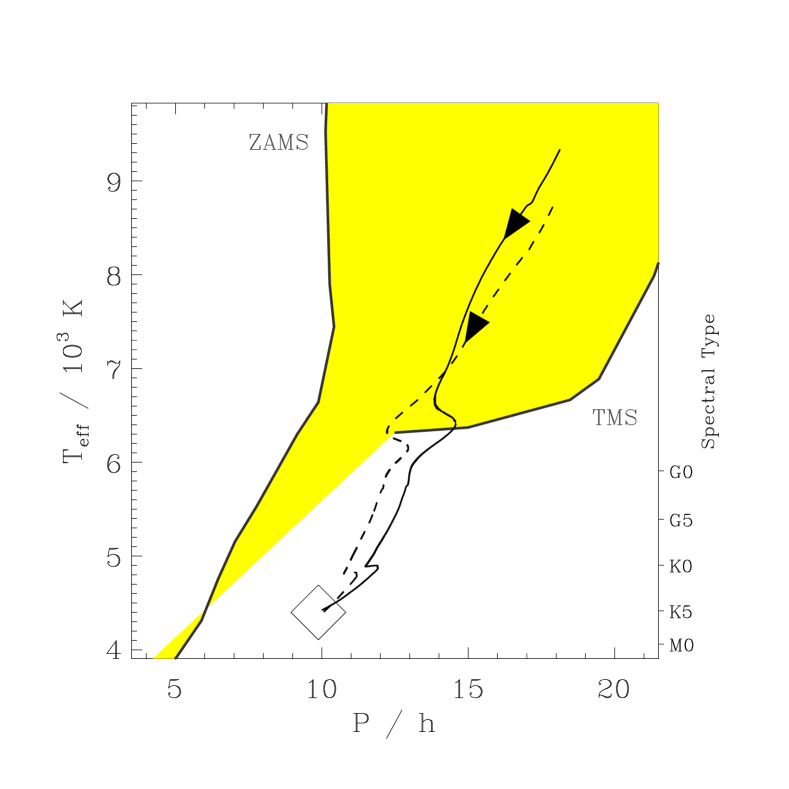
We obtained four approximate solutions for the initial parameters of AE Aqr , , : S1 (1.8, 0.18, 0.6), S2 (1.9, 0.21, 0.6), S3 (2.1, 0.23, 0.54) and S4 (2.3, 0.247, 0.5), which provided the starting point for the full binary calculations in the next section. A decreasing amount of initial core hydrogen fraction indicates a donor that is advanced futher in its MS evolution. The tracks for S3 and S4 are shown in Figs. 3 and 4 as the evolution of spectral type over secondary mass and orbital period respectively.
The (admittedly crude) modelling presented in this section leads to an overall fitting end state of the system, i.e. a reasonable model for AE Aqr today. However the preceding transition phase is poorly modelled. As a general trend derived from comparing S1-S4, lower initial secondary masses require the donor to be a bit more evolved, and lead to a slightly higher current donor mass in AE Aqr. We can therefore expect initial values around to provide progenitors for AE Aqr.
4 Full binary calculations
| Name | |||||
|---|---|---|---|---|---|
| B1 | 0.95 | 2.35 | 0.287 | 17.9 | 0 |
| B2 | 0.95 | 2.1 | 0.223 | 18.5 | 0 |
| B3 | 0.95 | 1.8 | 0.190 | 18.1 | 0 |
| B4 | 0.8 | 2.35 | 0.287 | 17.5 | 0.1 |
| B5 | 0.6 | 1.6 | 0.560 | 10.8 | 0.3 |
| B6 | 0.6 | 1.6 | 0.087 | 18.6 | 0.3 |
There are two major effects suppressed by the single star treatment in the previous section:
-
1.
For identical initial donor stars, different initial WD masses and thus initial mass ratios can produce very different mass transfer rate histories, which are represented too simplistically by eq.(4).
-
2.
The growth of the WD mass is ignored in converting radii to orbital periods.
Therefore we have computed a range of tracks in a more self–consistent way. The mass transfer rate is calculated according to the current orbital parameters (‘full binary evolution’). The code used for this work is still based on the Kolb & Ritter (1992) version of Mazzitelli’s stellar evolution. The main challenge in computing the evolutions through and beyond a phase of thermal–timescale mass transfer lies in a proper treatment of numerical and physical instabilities.

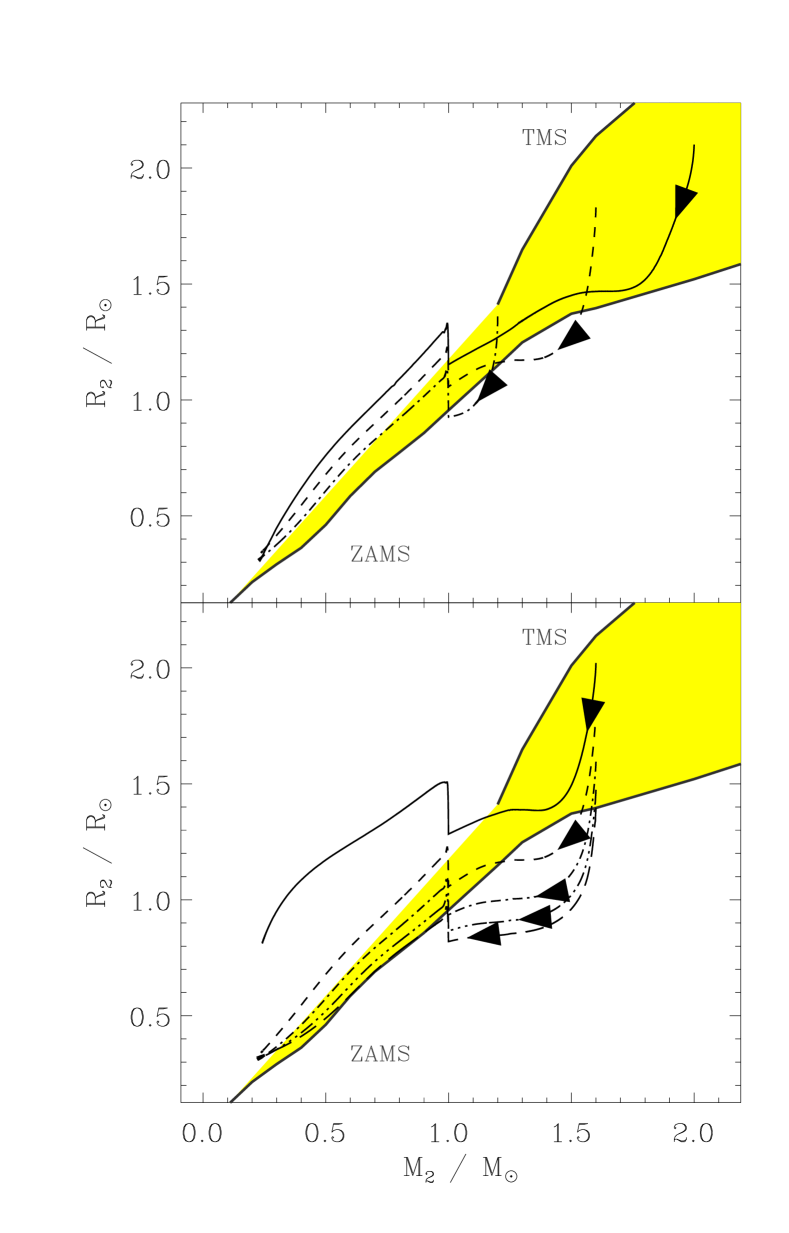
We present here the results for six tracks, whose parameters are given in Table 1. In all cases the mass accretion efficiency defined in eq.(1) is kept constant throughout the evolution. Conservative mass transfer () is not considered (see Sect. 2). Figure 5 illustrates the variety of post–thermal–timescale mass transfer transitions mentioned in the discussion of the single star results above. Track B3 shows just a small bump of enhanced mass transfer. Increasingly S-shaped period loops appear in B2, B6, and B1. Tracks B5 and B4 show the beginning of an apparent runaway caused by a delayed dynamical instability (DDI); here extreme mass ratios coincide with sufficiently deep transient outer convection zones. None of these cases, including the dip in the mass transfer rate at the end of the thermal–timescale mass transfer found in B1, is adequately described by eq.(4).
The dominant parameter governing the behaviour along the sequence B3–B2–B6–B1–B5–B4 is the initial mass ratio: larger values correspond to stronger thermal instability. In addition the choice of (modifying the stability criterion) and the evolutionary state of the donor (e.g. B5–B6) can also have a strong impact on the evolutionary curves.
In some of the curves, particularly B1, a significant amount of numerical noise is apparent during the early high mass transfer rate phase. This is connected with the growth of an outer convective envelope caused by the rapid mass loss. As donors of these masses have initially radiative envelopes, very thin convective layers are present at the onset of this transition. This creates substantial numerical difficulties as minute discontinuities in the evolution of the star’s radius will be reflected in erratic jumps of the mass transfer rate. As time proceeds, the average thermal reaction of the star can be seen to pass right through the average of the scatter in : various tests with enhanced resolution and reduced timesteps have confirmed that the subsequent structure of the star is unaffected from these problems, which are localized in layers close to the surface and thus have quite short thermal relaxation timescales.
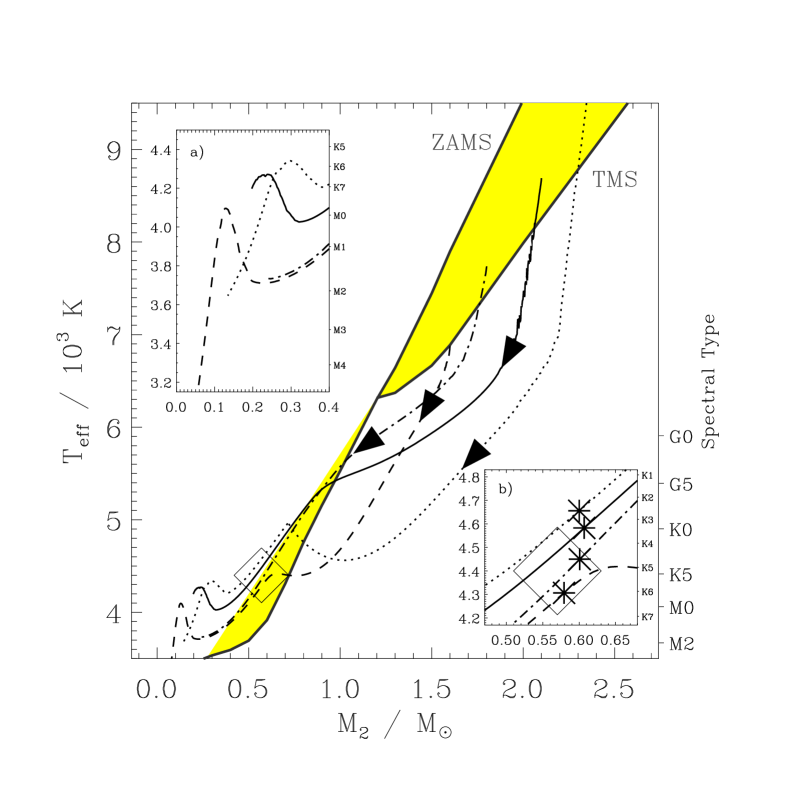
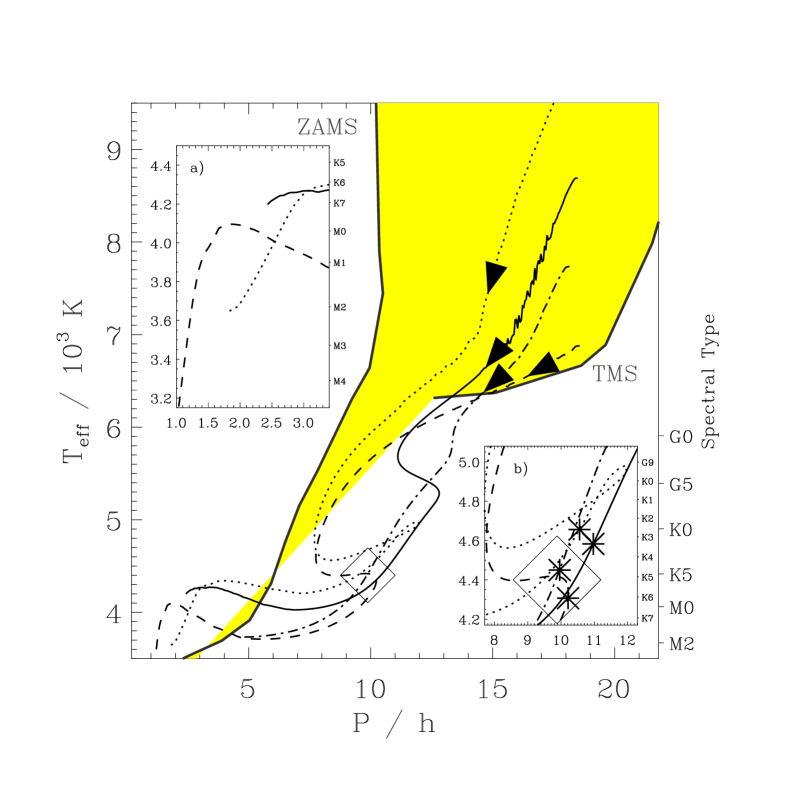
Here we discuss tracks B1-B3 and B6. Figure 6 shows remarkable similarities to Fig. 3, except for the high initial mass ratio cases (B1 & B6) which evolve in a much wider arc back to the mass and SpT of AE Aqr. Inset (a) shows a zoomed part of the end region of the tracks (discussed in the next section), while inset (b) focusses on the region near the current position of AE Aqr (again marked by an open diamond). Asterisks mark the position along each track where the observed mass ratio (presumably the best determined observable quantity besides orbital period) is matched. Given the uncertainties of spectral type calibration in the models and observational mass determinations, all four models qualify as potential progenitors. Not suprisingly the evolution vs orbital period shown in Fig. 7 has very different features from the corresponding Fig. 4: the loops and wiggles in the full binary plot correspond to the S-shaped curves shown in Fig. 5. Insets (a) and (b) again zoom in on regions of special interest, showing the rather good agreement with the observed values of AE Aqr. The jitter visible at the beginning of especially B2 results as discussed above from numerical difficulties at the onset of mass transfer from an outer convective envelope. Again the strong influence of a large initial mass ratio on the curves of B1 and B6 can be seen.
All tracks appear very non–MS like after passing through AE Aqr, which is a consequence of their advanced nuclear evolution. As listed in Table 1 and obvious from Fig. 7, the remaining core hydrogen content at the onset of mass transfer decreases with initial donor mass (B1–B2–B3–B6) in order to get near the current position of AE Aqr.
The full binary calculations in this section confirm the single star results for a range of suitable progenitors for AE Aqr. Evolutionary tracks for a variety of models do pass through the currently observed orbital period, spectral type, mass ratio and even individual masses and .
So far we have not used the additional constraints from other observational properties of AE Aqr. These distinguish between different scenarios.
5 Properties of CVs descending from supersoft binaries
5.1 The WD spin
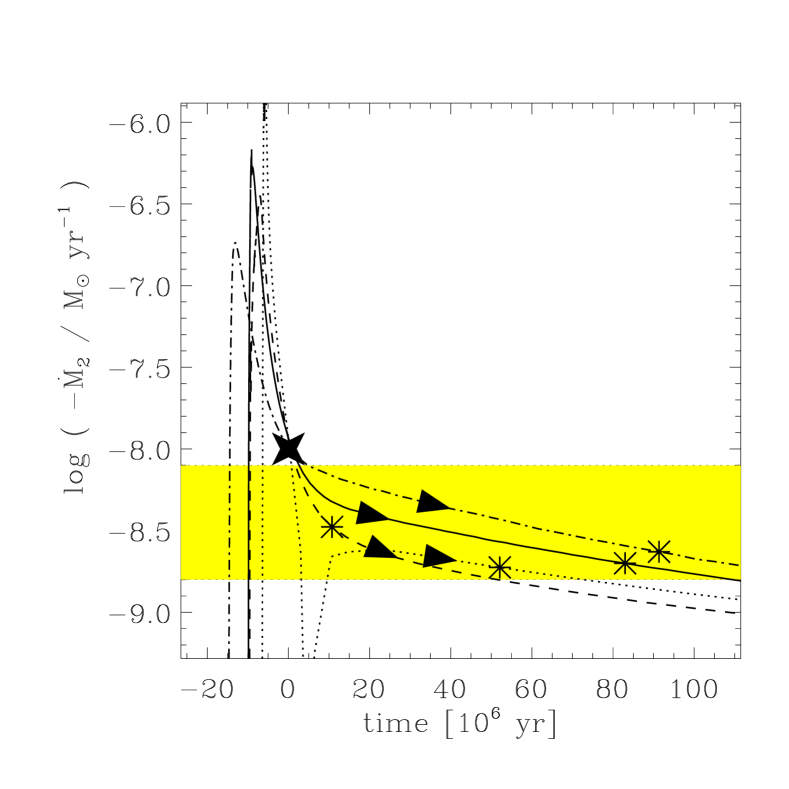
We first consider the current accretion state in AE Aqr. The rapidly rotating WD () is spinning down on a timescale of , consistent with powering the mass expulsion in the propeller phase (Wynn et al., 1997). As the timescale for the spin to reach equilibrium with the mass transfer rate is yr, the high mass transfer rate which spun up the WD must have ended only about in the past. Figure 8 compares the mass transfer rate evolution for the four full binary models (B1–B3, B6). Clearly all cases predict the right , but all except one (B6) take too much time to reach that position. The spindown properties therefore clearly favour a large initial mass ratio for the progenitor of AE Aqr, and some fractional mass accumulation (here an average of ) on to the WD during the supersoft thermal–timescale mass transfer phase.


5.2 Abundances
Another potential way to distinguish between the models lies in their different initial masses and central hydrogen fractions. If we combine the observations of the extreme UV line ratios of Civ and Nv with the apparent oversize of the donor for its spectral type (long orbital period), the natural explanation is chemical evolution of the stellar interior. Given the complex convective history and the different initial core masses and compositions of our four cases, we can construct e.g. an evolutionary sequence of characteristic surface elements as shown in Fig. 9. Despite the loss of more than a solar mass from the donor, solar composition is still maintained for a long time in sequence B2. Later however the ratios of 12C to 13C and C to N decrease by more than one or two orders of magnitude respectively. Vertical lines mark the point in the evolution where the orbital period and mass ratio of AE Aqr are matched: clearly this sequence provides more than enough C depletion to explain the UV observations of Jameson et al. (1980). Very similar results are found in the other cases. Bearing in mind that B2 was not a particularly strong case of thermal–timescale mass transfer, it seems very likely that chemical anomalies like these are quite common in post–thermal–timescale mass transfer systems.
In order to understand the origin of this specific form of change in the C/N ratio, we take a closer look at the internal structure of sequence B3 in Fig. 10. Mass transfer in this sequence started with a donor having only 19% hydrogen left in the core. The left panel of Fig. 10 shows the internal profile of C/N shortly after filling the Roche lobe, with mass . The initial solar composition has been modified severly by nuclear burning and subsequent mixing in the central . Although substantial energy generation by CNO burning is limited to the very central regions (especially the convective core plateau in the inner ), the relatively long duration of the previous MS lifetime has allowed the nuclear reactions to change the composition much further out. The temperature–dependent CNO equilibrium ratios have been reached out to , whereas the slower nuclear reactions beyond that have only started to reduce the amount of C. Once thermal–timescale mass transfer sets in however, this chemical profile remains frozen (everything happens within , cf. Fig. 8). Material is removed layer by layer from the top, until finally an outer convection zone starts to penetrate the chemically modified region, or the region itself is laid bare already. The right panel of Fig. 10 illustrates this, when only is left. The C/N ratio in the small surface convection zone is more than a factor of 100 below solar, i.e. even the weakest thermal–timescale mass transfer in case B3 has no trouble explaining the anomalous composition of AE Aqr.
5.3 Evolutionary endpoints: the AM CVn systems
The later stages and endpoints of the evolutionary scenarios found for AE Aqr are connected to the advanced initial stage of nuclear burning on the MS. As the insets (a) in Figs. 6 and 7 show, the most extreme case B6 (and quite similar B3, which has been stopped around ) reach an orbital period of 60 min or below. In this state the donors consist largely of helium produced during detached MS burning. Thus these systems qualify as AM CVn systems or at least intermediate cases such as V485 Cen (Augusteijn et al., 1996). An almost identical channel of forming ultra-compact binaries has recently been studied by Podsiadlowski et al. (2001), focussing on initial donor masses below and binary population synthesis aspects.
5.4 Other properties
-
1.
The upper limit for the donor mass that potentially leads to similar evolutionary tracks is determined by the occurence of a DDI, and the requirement of a strong braking mechanism at the end of the thermal–timescale mass transfer supersoft phase. Both are extremely sensitive to the amount of mass accreted during the high episode, which certainly needs further investigation. We suggest that masses up to should be considered.
-
2.
After passing the state exemplified by AE Aqr, all donor stars in our models have spectral types too late for their orbital periods. Hence post–thermal–timescale mass transfer systems provide a natural explanation for the apparently evolved state of many CVs with periods above (Baraffe & Kolb, 2000). Podsiadlowski et al. (2001) claim agreement between the properties of their population and the observed SpT distribution in CVs (Beuermann et al., 1998).
-
3.
A simple argument (King & Schenker, 2002) implies a substantial number of evolved systems among CVs: at the borderline between systems brought into contact by some form of braking and those by nuclear evolution there will always be donors which have almost finished their MS phase, but are still kept at short orbital periods by a thermal–timescale mass transfer phase followed by normal angular momentum loss driven evolution.
-
4.
Most importantly, AE Aqr seems to be living proof that this kind of evolution does exist. If (as we strongly suspect; see below) a large number of systems with similar properties have passed through such a phase, the same group of systems may account for short-period supersoft binaries, AM CVns, V485 Cen–type close binaries, and a substantial fraction of CVs. Although these probably include unusual ones like AE Aqr or V1309 Ori, many of them may appear fairly normal.
-
5.
If we assume the track of B6 as shown in Fig. 8 as typical for all supersoft, AM CVn, and AE Aqr–like stages, one would expect roughly equal durations of the supersoft and spindown phases. The subsequent lifetime as normal CV above the period gap is about 100 times longer. More difficult to estimate is the fraction of post–TTMT systems that end up as AM CVn stars: the uncertainties of post-common envelope distributions, DDI, and magnetic braking issues prevent serious quantitative predictions. Direct comparison with observed statistics is further complicated by poorly understood selection effects in these different classes.
A related question concerns the expected fraction of post–thermal–timescale mass transfer systems among CVs. We make a simple estimate using recently improved fits to the Galactic mass function (Chabrier, 2001), which enter as the distribution of initial donor star masses between and . The upper limit is set by the onset of delayed dynamical instability () for a white dwarf mass fixed for simplicity at . Assuming that these systems evolve as normal CVs for and via thermal–timescale mass transfer for we find that in a steady state about one–third of current CVs should be post–thermal–timescale mass transfer systems. As a simple correction for the reduced binary fraction at low masses we have applied a weighting factors of (for the thermal–timescale mass transfer mass range) and (for normal CV donor masses). While this is obviously a fairly crude estimate, it does strongly suggest that a substantial fraction of CVs could show signs of an earlier thermal–timescale mass transfer phase. We note that more exhaustive studies of CV formation lead to roughly similar results. For example Table 1 from de Kool (1992) indicates that a large fraction (if not a majority) of zero–age binaries will undergo thermally unstable mass transfer rather than becoming a CV directly.
6 Conclusion
We have shown that the assumption of thermal–timescale mass transfer in the recent past of AE Aqr provides plausible explanations for all of its current observational properties. The system parameters for the best-fitting progenitor model presented in this paper (B6) are (fairly far evolved on the MS) and with a primary of which manages to accrete about 30% of the total transferred mass upon reaching the current phase of AE Aqr. This indicates a relatively large initial mass ratio, and some fraction of mass accretion during the thermal–timescale mass transfer phase. Although the precise values may change, the idea is very robust, as the differential results from Sect. 3 & 4 clearly indicate that it will be always possibly to end up with an excellent model for AE Aqr.
The short duration of the thermal–timescale mass transfer and the transition stage (where AE Aqr currently is) implies a large birthrate, and thus suggests a large number of systems passing through similar evolutions. We expect descendants from systems similar to AE Aqr, and thus from supersoft binaries, to form a substantial fraction of the currently known CVs. The contortions of the curves of Fig. 5 suggest that non–magnetic descendant systems may change between recurrent novae, novalike and dwarf nova behaviour during and after the transition from thermal–timescale mass transfer to normal CV evolution. Descendants with significant WD magnetic fields will also appear in various guises during these phases. We suggest that the long–period AM Her system V1309 Ori (Schmidt & Stockman, 2001; Staude et al., 2001) is a descendant of a supersoft binary, cf. King et al. (2002). This system is apparently able to synchronise at its unusually long period of 8 hr because of the drop in mass transfer rate at the end of the thermal–timescale mass transfer phase. The pulsing supersoft source XMMU J004319.4+411758 found by XMM in M31 may be an example of a progenitor still in the thermal–timescale mass transfer phase (King et al., 2002). Note that V1309 Ori, the slightly nonsynchronous polar BY Cam (Bonnet–Bidaud & Mouchet, 1987) and the intermediate polar TX Col (Mouchet et al., 1990) all show high Nv/Civ ratios similar to AE Aqr. Abundance anomalies possibly related to stripping of a partially evolved companion were suggested by Mouchet et al. (1990) in the latter two cases.
We conclude that in spite of its apparent uniqueness, AE Aqr is only the first confirmed member of a much larger population of post–supersoft binaries, constituting a significant fraction of all CVs. A way of checking for this population is to determine the C/N ratio by measuring Civ 1550 versus Nv 1238. A low value here will be strongly suggestive of descent from a supersoft binary.
Acknowledgements
Theoretical astrophysics research at Leicester is supported by a PPARC rolling grant. ZZ was supported by Royal Society China Joint Project Q760.
References
- Augusteijn et al. (1996) Augusteijn, T., van der Hooft, F., de Jong, J. A., & van Paradijs, J.: 1996, A&A 311, 889
- Baraffe & Kolb (2000) Baraffe, I. & Kolb, U.: 2000, MNRAS 318, 354
- Beuermann et al. (1998) Beuermann, K., Baraffe, I., Kolb, U., & Weichhold, M.: 1998, A&A 339, 518
- Bonnet–Bidaud & Mouchet (1987) Bonnet–Bidaud, & J.M., Mouchet, M., 1987: A&A, 188, 89
- Casares et al. (1996) Casares, J., Mouchet, M., Martínez-Pais, I. G., & Harlaftis, E. T.: 1996, MNRAS 282, 182
- Chabrier (2001) Chabrier, G.: 2001, ApJ 554, 1274
- de Jager et al. (1994) de Jager, O. C., Meintjes, P. J., O’Donoghue, D., & Robinson, E. L.: 1994, MNRAS 267, 577
- de Kool (1992) de Kool, M.: 1992, A&A 261, 188
- Jameson et al. (1980) Jameson, R. F., King, A. R., & Sherrington, M. R.: 1980, MNRAS 191, 559
- King (1988) King, A. R.: 1988, QJRAS 29, 1
- King et al. (2002) King, A. R., Osborne, J. P., & Schenker, K.: 2002, MNRAS 329, L43
- King & Ritter (1999) King, A. R. & Ritter, H.: 1999, MNRAS 309, 253
- King & Schenker (2002) King, A. R. & Schenker, K.: 2002, in B. T. Gänsicke, K. Beuermann, & K. Reinsch (eds.), The Physics of Cataclysmic Variables and Related Objects, ASP Conference Series Vol. 261, San Francisco, 233–241
- King et al. (2001) King, A. R., Schenker, K., Kolb, U., & Davies, M. B.: 2001, MNRAS 321, 327
- Kolb & Ritter (1992) Kolb, U. & Ritter, H.: 1992, A&A 254, 213
- Mauche et al. (1997) Mauche, C. W., Lee, Y. P., & Kallman, T. R.: 1997, ApJ 477, 832
- Mazzitelli (1989) Mazzitelli, I.: 1989, ApJ 340, 249
- Mouchet et al. (1990) Mouchet, M., Bonnet–Bidaud, J.M., Hameury, J.M., & Acker, A.: 1990, in Evolution in Astrophysics: IUE Astronomy in the Era of New Space Missions, ESA, 423–426
- Podsiadlowski et al. (2001) Podsiadlowski, P., Han, Z., & Rappaport, S.: 2001, MNRAS submitted (astro–ph/0109171)
- Pylyser & Savonije (1988a) Pylyser, E. & Savonije, G. J.: 1988a, A&A 191, 57
- Pylyser & Savonije (1988b) Pylyser, E. H. P. & Savonije, G. J.: 1988b, A&A 208, 52
- Schenker (2001) Schenker, K.: 2001, in P. Podsiadlowski, S. Rappaport, A. R. King, F. D’Antona, & L. Burderi (eds.), Evolution of Binary and Multiple Star Systems, ASP Conference Series Vol. 229, San Francisco, 321–332
- Schenker & King (2002) Schenker, K. & King, A. R.: 2002, in B. T. Gänsicke, K. Beuermann, & K. Reinsch (eds.), The Physics of Cataclysmic Variables and Related Objects, ASP Conference Series Vol. 261, San Francisco, 242–251
- Schmidt & Stockman (2001) Schmidt, G. D. & Stockman, H. S.: 2001, ApJ 548, 410
- Sobermann et al. (1997) Sobermann, G. E., Phinney, E. S., & van den Heuvel, E. P. J.: 1997, A&A 327, 620
- Staude et al. (2001) Staude, A., Schwope, A. D., & Schwarz, R.: 2001, A&A 374, 588
- van den Heuvel et al. (1992) van den Heuvel, E. P. J., Bhattacharya, D., Nomoto, K., & Rappaport, S. A.: 1992, A&A 262, 97
- Webbink (1985) Webbink, R. F.: 1985, in J. E. Pringle & R. A. Wade (eds.), Interacting Binary Stars, Chapt. 2.2, 39–70, Cambridge Univ. Press, Cambridge
- Welsh (1999) Welsh, W. F.: 1999, in Annapolis Workshop on Magnetic CVs, ASP Conference Series Vol. 157, San Francisco, 357–367
- Welsh et al. (1993) Welsh, W. F., Horne, K., & Gomer, R.: 1993, ApJ 410, L39
- Welsh et al. (1995) Welsh, W. F., Horne, K., & Gomer, R.: 1995, MNRAS 275, 649
- Wynn et al. (1997) Wynn, G. A., King, A. R., & Horne, K.: 1997, MNRAS 286, 436