Chandra Observations of Arp 220: The Nuclear Source
Abstract
We present the first results from 60ks of observations of Arp 220 using the ACIS-S instrument on Chandra. We report the detection of several sources near the galaxy’s nucleus, including a point source with a hard spectrum that is coincident with the western radio nucleus B. This point source is mildly absorbed () and has an estimated luminosity of erg/s. In addition, a fainter source may coincide with the eastern nucleus A. Extended hard X-ray emission in the vicinity raises the total estimated nuclear 2-10 keV X-ray luminosity to erg/s, but we cannot rule out a hidden AGN behind columns exceeding We also detect a peak of soft X-ray emission to the west of the nucleus, and a hard point source 2.5 kpc from the nucleus with a luminosity of erg/s.
1 Introduction
Ultraluminous Infrared Galaxies (ULIRGs) have quasar-like bolometric luminosities () dominated by the far-infrared (8–1000m) part of the spectrum (Sanders & Mirabel, 1996). Almost all ULIRGs are interacting or merging galaxies (Clements et al. 1996), possibly linking them to the transformation of disk galaxies into ellipticals (eg. Wright et al, 1990; Baker & Clements, 1997). The prodigious luminosity of ULIRGs is thought to be powered by a massive starburst, a dust–buried AGN or some combination of the two. Despite a decade of work we still have not been able to decide between these paradigms. Various scenarios have also been suggested linking the evolution of quasars with ULIRGs (eg. Sanders et al., 1988). These suggest that part of the luminosity we see from some ULIRGs originates in a dust–obscured AGN which later destroys or expels the enshrouding material. Meanwhile, studies of the X-ray background (Mushotzky et al, 2000) suggest that dust–enshrouded AGN make a substantial contribution to its hard component. Such objects may also be linked (Trentham & Blain, 2001; Almaini et al., 1999) to the recently discovered Cosmic Infrared Background (Puget et al. 1996; Fixsen et al., 1998) and the objects that contribute to it (Puget et al. 1999; Sanders 2000 and references therein). As the most obscured objects in the local universe, and as strong candidates for making the CIB, ULIRGs are ideal local laboratories for studying many of these issues.
Arp 220 is the nearest ULIRG, having an 8-1000m luminosity of and a redshift of . As such it is an ideal target for ULIRG studies. The consensus since ISO is that Arp 220 is powered by a massive burst of star formation rather than an AGN (Sturm et al 1996), but the possibility of a heavily obscured AGN powering the bulk of its emission remains (Haas et al 2001). The evolutionary scenario linking ULIRGs to AGN also allows the possibility that a weak, but growing, AGN may lie at the centre of Arp 220. While this may not be energetically significant at the present time, it may grow to prominence at later stages in the object’s evolution. The plausibility of such a scenario has been investigated by Taniguchi et al. (1999), who show that it is quite possible for a massive black hole () to grow to during the course of a galaxy merger, and thus to be capable of powering a quasar.
Signs of AGN activity can be sought with X-ray observations. The current data for Arp 220 includes soft X-ray images from ROSAT (Heckman et al. 1996). These show extended X-ray emission associated with the H nebula (Arribas, Colina & Clements 2001), which are thought to be produced by a superwind. However the overall soft X-ray luminosity is small relative to the far-IR luminosity when compared to other starbursts, and might allow room for some AGN contribution (Iwasawa, 1999). At higher energies, where an AGN would be more prominent, data is available from HEAO-1 (Rieke, 1988), CGRO (Dermer et al., 1997), ASCA (Iwasawa 1999), and BeppoSAX (Iwasawa et al. 2001). These rule out the possibility of an unobscured energetically significant AGN in Arp 220. The possibility remains, however, of a Compton thick AGN, with an obscuring column in excess of 1025cm-2, or of a weaker lower luminosity AGN that will grow into a quasar. We have thus undertaken Chandra X-ray observations of Arp 220 aimed at detecting a weak or obscured AGN in its nucleus, and to study the extended superwind emission in detail. This paper presents the first results from our study of the nuclear regions. Our results on the superwind can be found elsewhere (McDowell et al. 2002, Paper II). We assume a distance of 76 Mpc (Kim & Sanders 1998) to Arp 220 throughout this paper.
2 Observations
Chandra observed Arp 220 with the ACIS-S instrument for 58 ks on 2000 Jun 24. The ACIS-S instrument was chosen for its good soft response to allow us to study the low energy X-ray emission of the superwind, as well as the harder emission expected from any nuclear source. We chose to use the back-illuminated CCD S3, for maximum soft response and to avoid any charge transfer difficulties arising in the front-illuminated chips. Arp 220 is sufficiently faint that no pile-up issues were expected or found in the data. The data were reduced by the standard Chandra pipeline through level 1 (calibrated event list) and further analysed using the CIAO package111http://cxc.harvard.edu/ciao version 2.1 and 2.2. The data were taken with the chip at a temperature of -120C and were gain-corrected using acisD2000-01-29gainN0003.fits from the July 2001 recalibration. The observation was relatively unaffected by background flares and only a small amount of exposure was removed, leaving an effective exposure time of 55756s. Astrometry was corrected using a revised geometry file (telD1999-07-23geomN0004.fits) which is believed to provide positions across the full ACIS field accurate to about 1 arcsecond. The standard screening (good time intervals and grade filtering for grades 0,2,4,5,6) was applied to generate a cleaned event file. The X-rays from Arp 220 extend over 20 kpc (Paper II), but emission above 2 keV is restricted to the central few kpc.
3 The Nuclear Source
3.1 Imaging the Nuclear Source
Figure 1 is a true X-ray color image of the Arp 220 nuclear region. It was smoothed in separate bands of 0.2-1 (red), 1-2 (green) and 2-10 keV (blue) using the CIAO adaptive smoothing routine csmooth. The image shows that the nuclear region of Arp 220 is clearly distinguished from the rest of the object by being the site of much harder emission.
The centroid of the soft emission is displaced 1.5 arcseconds to the northwest of the hard emission. The hard emission coincides with a dust lane in the galaxy (Joy et al. 1986), and indeed the soft emission is suppressed there. However, the absence of hard emission away from the nucleus shows that the spectral change is due to a different type of source, and not merely an absorption effect.
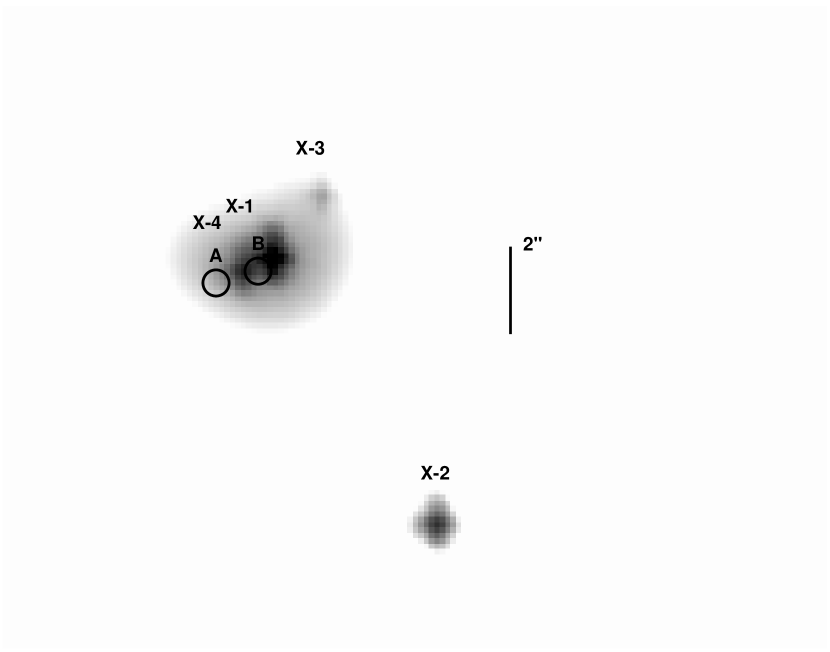
Figure 2 shows an image of the hard emission ( keV) coming from the nuclear regions of Arp 220, together with circles indicating the area within 1” of the well-studied dual radio and IR nuclei (see eg. Scoville et al. 1998). The positional match between the radio/IR nuclei and the hard emission is 1”, within the expected pointing accuracy of Chandra. (The surprising lack of detections of USNO stars in the field limits our ability to improve the astrometric accuracy, but three galaxies are found within one arcsecond of their published positions.)
Previous observations of Arp 220 have shown the presence of hard emission, using, for example, Beppo/SAX (Iwasawa et al. 2001). However, it is only with the angular resolution of Chandra that we have been able to localise some of this emission to the region of the nuclei.
The mean off-axis angle of the nucleus during the observation was only 38 arcseconds, so the point spread function (calculated using the standard CIAO tools) is very close to the on-axis value. To estimate source fluxes, we generated monochromatic point spread functions for the midpoints of the three energy bands using the CIAO tool mkpsf, and subtracted a point source from the raw images at the location of the hard peak, with the maximum amplitude that did not create a dip in the local diffuse flux when the data was then smoothed. This procedure was repeated at the location of remaining flux peaks.
The central region is consistent (within the 1” absolute astrometric accuracy of the Chandra data) with a pair of hard point sources at the positions of radio nuclei A and B (Scoville et al 1998), with the western nucleus dominant, although the best fit separation for two point sources is only 0.7” rather than the 1.1” of the radio positions and the decomposition of this small region into multiple point sources and diffuse emission is not unique.
We designate the sources in order of total flux. The hard band image shows emission concentrated around a nuclear source, X-1, with extended emission around it. Point source subtraction suggests the presence of a much weaker second hard nucleus, X-4, together with a diffuse component which we denote as the X-1 halo; its centroid is 0.5 arcseconds east of X-1. X-2, further out from the nucleus, is a hard source detected out to 5 keV; only 33 net counts are seen. Its luminosity of puts it in the interesting category of non-nuclear ULX (ultra-luminous X-ray) sources. X-3, the soft peak, is not reliably separated from the extended soft circumnuclear emission, and coincides with the peak of the H emission (Arribas, Colina & Clements 2001; McDowell et al. 2002).
The 2–10keV luminosity we derive for the nuclear source X-1 and surrounding hard emission (assuming the spectral model derived in the next section) is 6.9 ergs s-1, measured from a 3” aperture centred on the nucleus. Because of the poorly constrained absorption, here and below we quote observed luminosities rather than absorption-corrected ones unless explicitly stating otherwise. The hard luminosity found here compares to the 2–10keV luminosity found by Iwasawa et al. (2001), in a 3 arcminute aperture, of 11 ergs s-1, assuming a similar distance to Arp 220. The background in our observation makes us insensitive to hard emission on 3 arcminute scales, and we cannot rule out an extended contribution of this magnitude. However, the 3 sigma upper limit to any remaining hard (2-8 keV) flux within 1 arcminute of the nucleus is and we speculate that emission from the nearby southern group may be contributing to the Iwasawa et al result. Deeper observations with XMM/Newton would resolve this issue.
3.2 Spectral Analysis
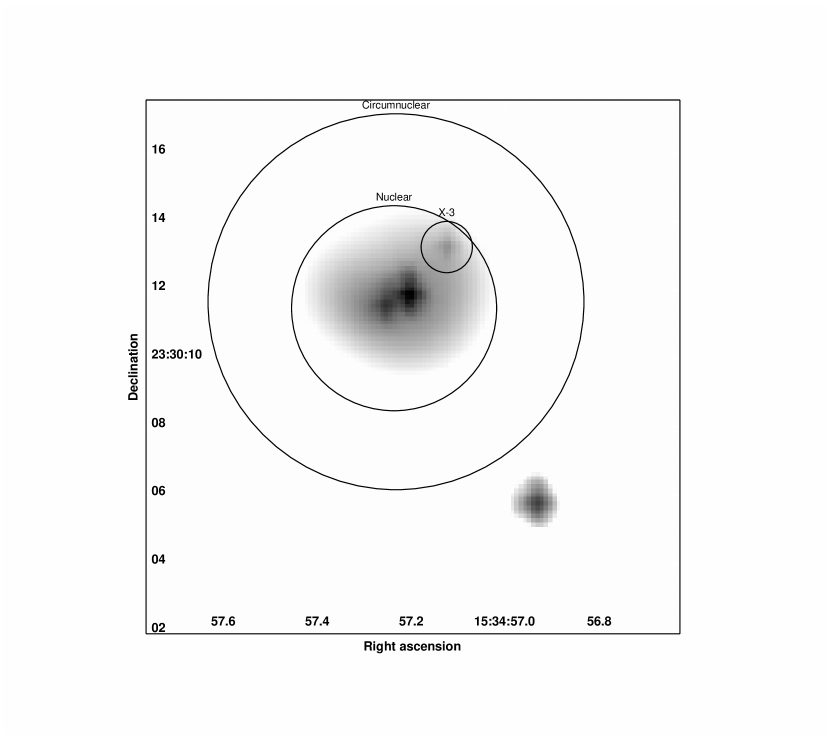
We considered two extraction regions: a 5.5” radius ‘circumnuclear’ region, including X-3 but with the X-1/X-4 region omitted; a ‘nuclear’ region with X-1/X-4 and the hard halo, taking photons within a 3” radius circle, but excluding photons within 0.75” of the X-3 location to minimize contamination by the soft source. The extraction regions are indicated in figure 3. For background we extracted counts from two 50” radius circular regions 3’ away on either side of the galaxy and lying on the same node of the chip.
Responses were generated using the CIAO tools mkwarf and mkrmf; a PI (gain-corrected) spectrum was extracted and grouped by a factor of 10 (0.15 keV bins). Both XSPEC and Sherpa were used to fit models to the data, and gave similar results.
The circumnuclear emission is fit with a Raymond-Smith or Mekal model with a two-temperature plasma of 0.14 and 0.9 keV and absorption of . It is probably composed of a mixture of diffuse emission and point sources. There is no sign of hard emission in this spectrum, confirming the impression from the images that hard emission is restricted to the central kiloparsec of Arp 220. The data are shown in figure 4.
Fitting the region of hard nuclear emission we find a spectrum similar to the soft circumnuclear emission but with an additional power law component. A representative fit has a power law component of photon index 1.41 behind . The absorbed 0.3-10 keV luminosity of the power law component is , and most of the counts are above 2 keV. The thermal components, assumed to be superimposed circumnuclear emission, have twenty percent of the flux of the power law, so the hard component dominates the energetics of the nuclear emission. The overall fit, with 9 free parameters, has a reduced chi-squared of 0.84 for 59 d.o.f and the C-statistic is 62.4; see figure 5.
If instead of modelling the soft emission directly, we use the off-nuclear circumnuclear emission as a background, we find a fit to the remaining emission consistent with a simple power law of index 10.5, a lower NH around , and a similar absorbed luminosity of . However, the remaining emission is also consistent with the slope 1.4 power law plus a modest amount of additional thermal emission at 0.9 keV.
The thermal models are not good at fitting the 2.0 keV (rest) Si XIV line; an extra contribution at 1.95 keV (rest) with L= reduces the , suggesting a possible slight gain error.
There is a high bin near 6.5 keV which could be a weak Fe K line. To evaluate this possibility we inspected the raw gain-corrected pulse height data without binning. There are a mere 10 photons with gain-corrected energies in the 0.4 keV wide bin between 6.3 and 6.7 keV, compared to 7 photons in the 0.8 keV on either side between 5.9-6.3 and 6.7-7.1, a 2 sigma ‘detection’. The distribution of the counts is consistent with the instrumental width at that energy, and their spatial distribution suggests a distribution centered towards the eastern source X-4 (although a tighter spatial selection only improves the detection significance to 2.6 sigma). If real, this line would have a luminosity of , an equivalent width of 700 eV and a rest energy of keV; these may be taken as approximate upper limits to any narrow Fe K line.
The absorption-corrected luminosity of the nuclear emission, including the hard halo, is . Based on the PSF subtraction calculations, we assign 30 percent of this to X-1, giving which is in the range of both ultra-low luminosity AGN and ultra-luminous binaries (Fabbiano 1998, King et al. 2001). See Table 1 for derived source positions and luminosities.
Could there be a further hard source at this location, behind a much larger column? Using a canonical photon index of 1.7, we set limits of L(0.2-10 keV) = for a column of , and for a column of . However, for a column of , which is entirely plausible in the center of Arp 220, no useful limit can be set by the ACIS data as even the most luminous quasars would have their X-ray flux absorbed; one must turn to the harder X-ray limits from the BeppoSAX PDS of in 13-50 keV (Iwasawa et al. 2001) to eliminate this possibility. In general, because of the low sensitivity of Chandra above 6 keV, the limits we set as a function of absorbing column are weaker than those in Figure 5 of Iwasawa et al. for the range they study (log =24.3 and above).
4 Discussion
4.1 Spatial Distribution of Nuclear X-ray Emission
The X-ray emission in Arp 220 is clearly divided into two parts — the compact, hard nuclear emission, and the diffuse, softer extended emission. This diffuse emission clearly extends right into the nucleus since the thermal component of the nuclear emission appears very similar to the thermal emission found in the off-nuclear spectrum. The hard emission is not extended beyond a region 1kpc in size (3” at 76 Mpc, our adopted distance for Arp 220). This makes an interesting contrast with other starburst and interacting/merging galaxies already studied by Chandra. For example, in the Antennae (Fabbiano, Zezas & Murray 2001) hard emission comes from numerous point sources extended over a 10kpc region, and in NGC 3256 (Ward et al. 2000), we see similar clumps spread over 3.5kpc. If such sources existed in Arp 220, we would expect to detect all those above 5ergs s-1 cm-2 in luminosity. We only see one such source, X-2, which lies 7” away from the nucleus. The hard X-ray emission from Arp 220 thus appears to be significantly more concentrated in the nucleus than that of other interacting or merging galaxies observed by Chandra. Indeed, the spatial distribution of hard emission in Arp 220 would appear to be more similar to that of Mrk273 (Xia et al. 2002), a ULIRG containing an AGN at its core, than NGC3256 or the Antennae, neither of which seem to have a significant AGN contribution.
4.2 Spectrum of the Arp 220 Nuclear Region
The X-ray output from the nuclear regions of Arp 220 is energetically dominated by an extended hard kpc-scale component, with a significant point source contribution (pc), that has a power law spectrum with =1.41.0, with an unabsorbed 2-10keV luminosity of 4 ergs/s. The central question is the origin of this radiation – does it arise from young supernovae, X-ray binaries, or the result of accretion onto a more massive body, possibly a weak AGN. We consider each of these possibilities in turn:
-
•
Young Supernovae Young supernovae can be strong X-ray emitters especially if in a dense circumstellar or interstellar environment (Schlegel, 1995). Such objects are also strong radio emitters. Colina et al (2001) detected a luminous radio supernova in the nuclear starburst of the Seyfert galaxy NGC 7469, a marginally ultraluminous infrared galaxy. 12 candidates for such ’radio supernovae’ have been detected by VLBI/VLBA observations in the nuclei of Arp 220 (Smith et al. 1998), so we know such objects are present. The X-ray properties of such objects are highly heterogeneous. SN1986J, for example, had an integrated 0.1-2.4keV luminosity of 2–31040ergs s-1 cm-2, while SN1993J has a luminosity in the same band of 31038ergs s-1 cm-2. The temporal behaviour of these objects are also different, ranging from relatively constant emission over several years for SN1978K to decay times of a few weeks or months for SN1993J (Schlegel, 1995). A number of such objects are capable of powering the emission we see in Arp 220, though some long term variability should be detectable, especially since no new radio supernovae appear to have occurred for some years (Lonsdale et al. 2000). Spectrally the emission from young supernovae are best fitted by thermal bremsstrahlung spectra. Attempts to fit the nuclear spectrum of Arp 220 with a thermal bremsstrahlung model give an implausibly high temperature of 10.5 keV with a 1.7cm-2 absorbing column (=52.4 with 77 degrees of freedom); supernovae typically have T0.5keV. Fixing the emission to this temperature gives a fit with a poorer than other models, with = 83 with 78 degrees of freedom.
-
•
X-Ray Binaries and ULX sources Typical galactic X-ray binaries have luminosities up to 1037ergs s-1 cm-2 (White, Nagase & Parmar 1995), so several thousand would be required to produce the luminosity seen in Arp 220’s nucleus, which is implausible. However, galaxies such as the Antennae and NGC3256, with considerably more active star formation than our own galaxy, have been found to contain ultra-luminous X-ray sources (ULX) with luminosity comparable to Arp 220. A survey of 11 nearby spirals with Chandra finds 15 ULX sources (Kilgard et al, in preparation). The ULX sources may be accreting objects with mass , as seen in M82 (Griffiths et al. 2000, Kaaret et al. 2001); or, the objects may be high-mass X-ray binaries with compact object masses in the stellar range, but with beamed emission (King et al. 2001). The M82 source appears to have a 10keV thermal bremsstrahlung spectrum, which can fit the data well (see above), so the presence of several ULX sources in the core of Arp 220 is feasible.
-
•
Inverse Compton Emission Moran et al. (1999) suggested that the hard X-ray emission in NGC3256 is produced through inverse Compton scattering of the far-IR photons by relativistic electrons produced by supernova remnants in the starburst. Conditions suitable for inverse Compton emission might also exist in the nuclei of Arp220, and give rise to the hard emission seen here. One test of inverse Compton emission is that the radio and X-ray power law indicies should match, and this does indeed prove to be the case. However, as noted by Iwasawa et al. (2001), the inverse Compton process in Arp220 must be quite inefficient or the hard X-ray luminosity would be much greater.
-
•
Active Galactic Nuclei The restriction of much of the hard X-ray emission to just the central regions of Arp 220 is naturally explained if the source is an AGN rather than an agglomeration of XRBs. However, whilst the nuclear regions of Arp 220 have a high luminosity for an individual XRB, they have a low luminosity for an AGN, being about 2 orders of magnitude fainter than typical Seyfert 1’s (George et al. 1998). However, luminosities this low are not without precedent for suspected AGNs. Ho et al. (2001) have conducted a survey of nearby galaxies with Chandra, examining the X-ray emission of objects that might contain low luminosity AGNs. They find weak AGNs in a substantial fraction of their sample, with X-ray luminosities (2-10keV) as low as ergs s-1 cm-2. They also find a correlation between X-ray and H luminosity which Arp 220 fits on when only the nuclear H luminosity is considered (Armus, Heckman & Miley 1990). If there is a weak AGN such as this in Arp 220, it will contribute only about 108—109L⊙ to the bolometric luminosity, ie. less than 1%. However, the presence of even a weak AGN in the dense environment of the nucleus of Arp 220 raises the possibility that it will grow and significantly increase in luminosity as the system continues to evolve. There is also the possibility that we are only seeing a small fraction of the emission from an AGN if the source itself is Compton obscured. The tentative detection of an emission line at 6.5keV, with equivalent width 1 keV, raises the possibility that the power-law source seen is just a reflected component from an otherwise obscured source. Harder X-ray observations by Beppo/SAX (Iwasawa et al. 2001) set the best limits to date for any obscured AGN. A moderately Compton thick AGN, with 2 cm-2 column, according to these limits, could supply a few percent of the bolometric luminosity, assuming standard Lx/Lbol ratios. Absorption by 1025 cm-2 is needed before a substantial fraction of Arp 220’s luminosity can come from an AGN. Such extinction is not impossible. Haas et al. (2001) use the 7.7m/850m flux ratio to suggest very high extinctions, while the LWS spectrum from Fischer et al. (1999), indicating at 100m, would imply an HI column of 2.7cm-2. Improved sensitivity spectra for the nuclear regions of Arp 220 is clearly needed to confirm whether the 6.5keV line is real and if it is associated with reflected emission. The presence of extended hard X-ray emission in the nuclear regions of Arp220 cannot be easily explained by a simple AGN model. Possible explainations would include a mixed nature for the nuclear regions, with unresolved AGN emission combining with extended XRB emission in the halo. Such an arrangement would naturally follow from Taniguchi et al.’s (1999) model of nuclear black hole growth by accretion of XRBs during a merger. Alternatively, an obscured AGN might be associated with extended scattered hard emission. The acquisition of deeper Chandra images to examine any differences in X-ray properties between unresolved and halo hard X-ray emission would be able to address these possibilities.
5 Conclusions: The Nature of Arp 220
We have shown that there is a source of hard, power-law-like, X-ray emission in the nuclear regions of Arp 220. This source is extended EW, consistent with the emission coming from both the radio/IR nuclei. The central concentration of hard X-ray emission in Arp 220 is in contrast to other interacting galaxies, where hard emission comes from clumps distributed across much larger physical distances. This difference may be associated with the merger in Arp 220 being older than in the Antennae or NGC3256, and that compact objects have sunk to its core (Tremaine, Ostriker & Spitzer, 1975) but may also be associated with Arp 220’s greater luminosity. The origin of the hard emission is unclear. Its spectrum is unlikely to be produced by young supernovae, but inverse Compton emission, albeit of very low efficiency, accretion onto ultra-luminous X-ray binaries or onto an AGN are all possible. If there is an AGN contribution, it has too low a luminosity for it to play a significant role in the energetics of the object, but the presence of even a weak AGN in Arp 220 would support a connection between ULIRGs and quasars (Sanders et al. 1988). If it is not an AGN, we cannot rule out the presence of a true AGN behind a Compton screen of column . If XRBs are responsible for the emission then a large number of conventional XRBs are needed, or a smaller number of ultraluminous ULX sources. In either case, the concentration of these objects in the very centre of Arp 220 might indicate that these objects will later merge together to form a supermassive black hole and AGN (Taniguchi et al. 1999). If there is a weak AGN already in the nuclear regions, then this process may already have begun.
References
- (1)
- (2) Almaini et al. 1999, MNRAS, 305, L59.
- (3)
- (4) Armus, L., Heckman, T., & Miley, G., 1990, ApJ 364, 471
- (5)
- (6) Arribas. S, Colina, L., & Clements, D.L., 2001, ApJ 560, 160.
- (7)
- (8) Baker, A.C., & Clements, D.L., 1997, in Extragalactic Astronomy in the Infrared, p. 295, ed. Mamon, G.A., Thuan, T.X., Van, J.T.T., pub. Editions Frontieres, Paris
- (9)
- (10) Canizares, C. R., Grindlay, J. E., Hiltner, W. A., Liller, W., & McClintock, J. E. 1978, ApJ, 224, 39
- (11)
- (12) Clements, D., et al, 1996, MNRAS, 279, 477.
- (13)
- (14) Colina L., Alberdi, Torrelles, Panagia and Wilson 2001, ApJ 533, L19.
- (15)
- (16) Dermer, C.D., Bland-Hawthorn J., McNaron-Brown K., 1997, ApJ 484, L121.
- (17)
- (18) Djorgovski, S., & King, I. R. 1984, ApJ, 277, L49
- (19)
- (20) Fabbiano, G., 1998, IAU Symp. 188, p 93.
- (21)
- (22) Fabbiano, G., Zezas A., & Murray S., 2001, ApJ 554, 1035.
- (23)
- (24) Fischer, J et al. 1999, Ap.Space.Sci 266, 91.
- (25)
- (26) Fixsen et al., 1998, ApJ., 508, 123
- (27)
- (28) George, I., et al. 1998, ApJS 114, 73.
- (29)
- (30) Griffiths, R.E. et al. 2000, Science 290, 1325.
- (31)
- (32) Haas, M., Klaas, U., Muller, S.A.H., Chini R., & Coulson I., 2001, Astron. Astrophys. 367, L9.
- (33)
- (34) Heckman, T.M., et al. 1996, ApJ 457, 616.
- (35)
- (36) Ho, L. et al. 2001, ApJ 549, L51.
- (37)
- (38) Iwasawa, K., 1999, MNRAS 302, 96.
- (39)
- (40) Iwasawa K., Matt G., Guainazzi M. & Fabian, A.C., 2001, MNRAS 326, 894
- (41)
- (42) Kaaret, P et al. 2001, MNRAS 321, L29.
- (43)
- (44) Kim, D-C. & Sanders, D.B. 1998, ApJS 119, 41.
- (45)
- (46) King, A.R, et al. 2001, Ap J 552, L109.
- (47)
- (48) Lonsdale, C.J., et al. 2000, IAU Symp. 205, p 49.
- (49)
- (50) McDowell, J.C., et al. 2002, in preparation.
- (51)
- (52) Moran, E.C., Lehnert, M.D., Helfand, D.J., 1999, ApJ., 526, 649.
- (53)
- (54) Mushotsky, R., et al. 2000, Nature 404, 459.
- (55)
- (56) Puget et al. 1996, A&A, 308, L5;
- (57)
- (58) Puget et al., 1999, A&A, 345, 29;
- (59)
- (60) Rieke, G.H., 1988, ApJ 331, L5.
- (61)
- (62) Sanders,D., 2000, ASR, 25, 2251
- (63)
- (64) Sanders, D., & Mirabel, ARAA, 34, 749.
- (65)
- (66) Sanders, D., et al., 1998, ApJ, 325, 74.
- (67)
- (68) Scoville, N.Z., et al. 1998, ApJ 492, L107.
- (69)
- (70) Schlegel, E.M., 1995, Rep.Prog.Phys 58, 1375.
- (71)
- (72) Smith, H.E, Lonsdale, C.J., Lonsdale, C.J., & Diamond, P.J., 1998, ApJ 493, L17.
- (73)
- (74) Sturm, E. et al 1996, A&A 315, L133.
- (75)
- (76) Taniguchi Y, Ikeuchi S, & Shioya Y. 1999, ApJ 514, L9.
- (77)
- (78) Tremaine, S.D., Ostriker J.P., & Spitzer L, Jr., 1975. ApJ 196, 407.
- (79)
- (80) Trentham, N., & Blain, A.W., 2001, MNRAS, 323, 547.
- (81)
- (82) Ward, M.J., et al., 2000, HEAD meeting No. 32.
- (83)
- (84) White, N.E, Nagase, F., & Parmar, A.N., 1995, in X-ray Binaries (ed. Lewin, W., van Paradijs J & van den Heuvel E.), CUP.
- (85)
- (86) Wright, J., et al. 1990, Nature 344, 417.
- (87)
- (88) Xia, X.Y., et al. 2002, ApJ 564, 196.
| Object | Position | Extenta | Net | F | |||
|---|---|---|---|---|---|---|---|
| (J2000) | () | counts | (obs) | (erg s-1) | () | (erg/s) | |
| Arp 220 Circumnuclear | 15:34:57.14 +23:30:13.0 | 7” | 250 | 1.6 | 1.1 | 0.5 (0.3-1) | 6 |
| Arp 220 X-1 hard halo | 15:34:57.28 +23:30:11.4 | 3” | 113 | 5.9 | 4.1 | 3 (1-5) | 8? |
| Arp 220 X-1 (nucleus) | 15:34:57.21 +23:30:11.7 | Unres. | 66 | 3.0 | 2.1 | 3 (1-5) | 4? |
| Arp 220 X-2 | 15:34:56.94 +23:30:05.5 | Unres. | 33 | 1.0f | 0.6 | 0.3 (0.2-0.6) | 0.7 |
| Arp 220 X-3 | 15:34:57.14 +23:30:13.1 | 2” | 31 | 0.2g | 0.1 | 0.5 (0.3-1) | 0.6 |
| Arp 220 X-4 | 15:34:57.25 +23:30:11.5 | Unres. | 19 | 1.0h | 0.7 | 3 (1-5) | 1.5? |
a Estimated extent of source in arcseconds. b Observed flux in the 0.3-10.0 keV band in units of .
c Luminosity corresponding to observed flux (uncorrected for absorption)
in units of erg/s.
d Hydrogen column in units of cm-2: best value and range.
e Unabsorbed luminosity in units of erg/s corresponding to correction for absorption using best value from previous column. Question marks indicate that the absorption correction is highly uncertain.
f Luminosity estimated using a power law model fit with the photon index fixed at 1.0.
g Luminosity found assuming the circumnuclear two-temperature model fit for the circumnuclear region.
h Luminosity estimated by assuming the same spectral model used for X-1.
See file f1.jpeg for colour figure.