Chandra X-ray Observation of the Orion Nebula Cluster. II Relationship between X-ray activity indicators and stellar parameters
Abstract
Using the results of our first paper on the Chandra HRC observation of the Orion Nebula Cluster (ONC), here we explore the relation between the coronal activity of its 1-Myr-old pre-main sequence population and stellar parameters. We find that median X-ray luminosities of low mass stars () increase with increasing mass and decreasing stellar age. Brown dwarfs () follow the same trend with mass. From to , median values increase by about half an order of magnitude and then remain constant at for the mass range from 0.5 to 3.0 . In these same two mass ranges, remains roughly constant with age, until it drops by more than two orders of magnitudes at the epoch when stars are expected to become fully radiative.
We find a dependence of and on circumstellar accretion indicators and suggest three possible hypotheses for its origin. In spite of improved X-ray and rotational data, correlations between activity indicators and rotation remain elusive for these stars, possibly indicating that stars for which rotational periods have been measured have reached some saturation level.
Our study of X-ray activity vs. stellar mass leads us to propose that the few HRC X-ray sources not associated with any optical/infrared counterpart trace a yet to be discovered stellar population of deeply embedded, relatively massive ONC members.
1 Introduction
The present work focuses on the study of the X-ray activity of Orion Nebula Cluster (ONC) members: from a purely observational standpoint, we explore the relationship between X-ray activity and stellar characteristics, searching for the physical mechanisms responsible for coronal X-ray activity in pre-main sequence (PMS) stars. In spite of the previous observational work in this area (e.g., Feigelson et al., 1993; Casanova et al., 1995; Gagné et al., 1995; Flaccomio et al., 2000), no definitive picture has yet emerged.
Our investigation is based on the original Chandra High Resolution Camera (HRC, Murray et al., 2000) X-ray data and literature optical data presented in Flaccomio et al. (2002, hereafter Paper I) and Flaccomio (2002) for objects in the ONC area. For the ONC region under study, Paper I defined an optical sample of 696 optically selected, extinction limited, and well characterized ONC members. Here we address the controversial questions of the relationship of X-ray activity with convection and rotation (i.e., the classical dynamo parameters), with stellar mass and age, and with circumstellar accretion and/or the presence of circumstellar disks. Taking advantage of our detailed description of activity as a function of stellar mass, we then explore the nature of the few detected X-ray sources not associated with any optical/infrared (IR) counterparts.
The structure of this paper is as follows: In §2 we study the relation of activity with rotation, mass, age and circumstellar accretion strength. In §3 we speculate on the nature of X-ray sources with no optical/IR counterpart. Finally we discuss our findings and summarize our conclusions in §4. An Appendix details our technique for investigating possible sources below our X-ray sensitivity limit.
2 Relationships between X-ray activity indicators and stellar parameters
In exploring relationships between X-ray activity and stellar characteristics through empirical correlations with physically meaningful stellar parameters, our main goal is to understand the 5 orders of magnitude spread that we observe in and . We focus on how activity is related to stellar rotational period, to mass and evolutionary status (as inferred from evolutionary tracks - see Paper I), and to the presence of an accretion disk. Paper I presents relevant X-ray and optical data for our optical sample comprised of 696 ONC likely members, 342 of which are unambiguously detected in our HRC X-ray data and have both low optical extinction () and available mass estimates. This stellar sample was carefully selected in order to avoid X-ray selection effects.
Our non-parametric approach is to split our reference sample into several bins of the stellar parameter under examination, to evaluate for each of these bins a Maximum Likelihood distribution function (using the Kaplan-Mayer estimator) for our two X-ray activity indicators, and then to examine the trends of these distributions as a function of the parameter. The Kaplan-Mayer estimators were computed using the ASURV package (Feigelson & Nelson, 1985), which was also used to perform various two population tests111Gehan’s generalized Wilcoxon test using both permutation and hypergeometric variance; Logrank test; Peto and Peto generalized Wilcoxon test; Peto and Prentice generalized Wilcoxon test. on pairs of selected stellar subsamples in order to establish the confidence with which we can reject the null hypothesis (that two distributions of a given parameter are drawn from the same parent distribution).
2.1 Rotational Period
We first searched for a correlation between X-ray activity and stellar rotational period (). Such a correlation is known to hold for older, main sequence stars of low mass and moderate rotation rate and is the main evidence for activity being driven by an stellar dynamo. Such correlations have not previously been found for the ONC stars (Gagné et al., 1995) and several other PMS associations (e.g., Walter & Barry, 1991; Feigelson et al., 1993; Alcala et al., 1997). In the young Taurus region, to the contrary, a correlation between activity and rotation has been observed (Bouvier, 1990; Strom & Strom, 1994; Damiani & Micela, 1995; Stelzer & Neuhäuser, 2001). Given the incompleteness of rotational databases used in most previous studies, the question remains open.
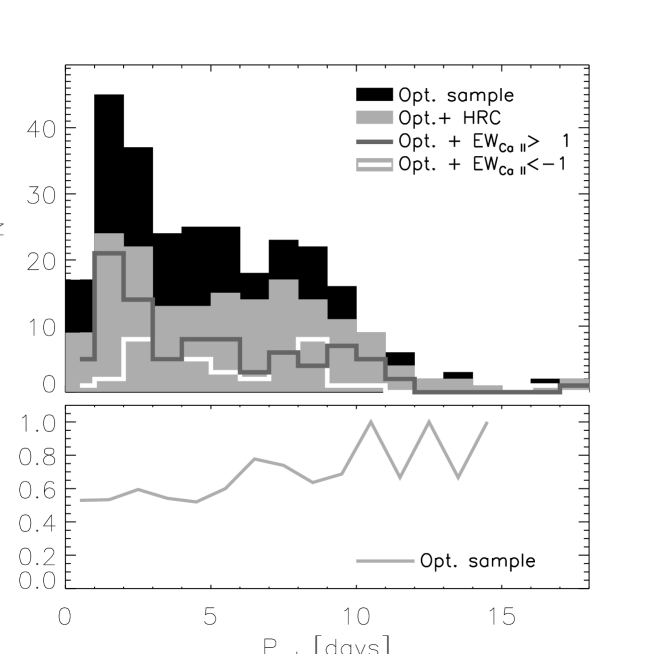
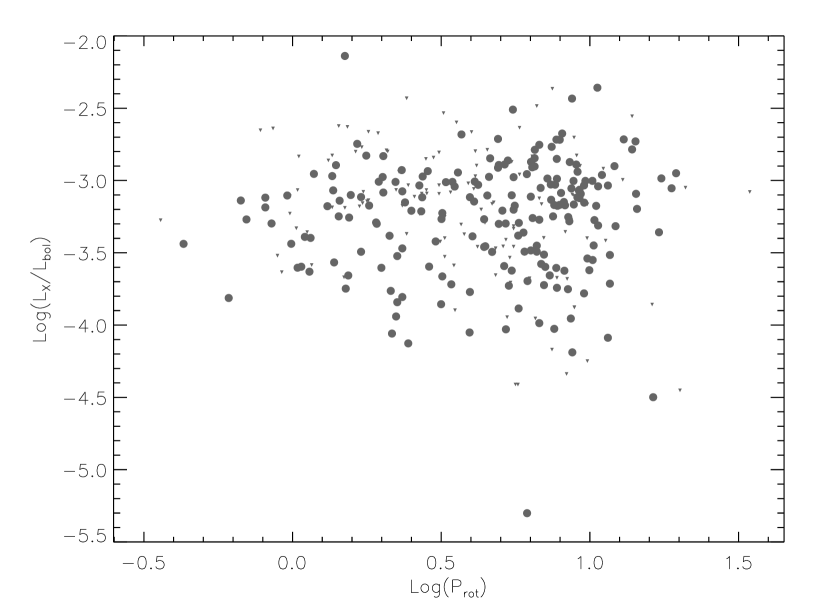
In Figure 1 we show the distribution of rotational periods (upper panel) collected in Paper I from the recent literature for 282 stars in our optical sample. Also shown vs. is the HRC detection fraction (lower panel). Our database of rotational periods is significantly more complete than that available to Gagné et al. (1995), but in spite of this improvement and Chandra’s higher X-ray sensitivity (which yields a high detection fraction), we still can find no evidence of correlation between X-ray luminosity and . The scatter plot of vs. (Figure 2) similarly shows no evidence of a correlation with . These results hold true no matter what physically meaningful subsample of the whole we consider. Indeed, in order to minimize stellar structure differences throughout the sample that might wash out a correlation with , we repeated the analysis in several mass bins (see §2.2) and also for high and low accretion stars (see §2.5), obtaining the same negative results in all cases.
It should be noted that the sample of stars for which rotational periods are available is strongly biased toward the most X-ray active stars. For example, the median for stars with known rotational period and mass smaller than 3.0 is -3.37 while the corresponding median for stars of the same mass with unknown rotational periods is -3.73. Moreover, the subsample of stars with known appears to be dominated by the most weakly accreting stars in the whole sample (see §2.5).
2.2 Stellar mass stars
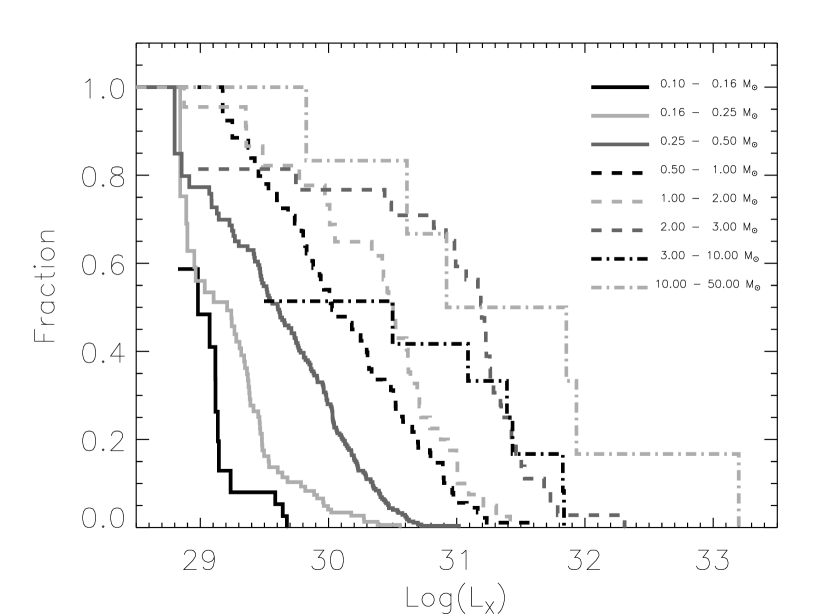
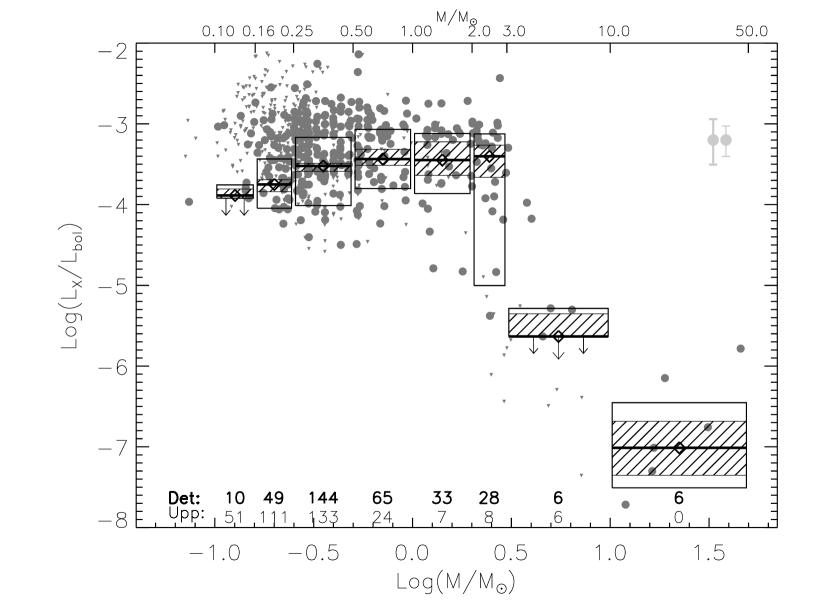
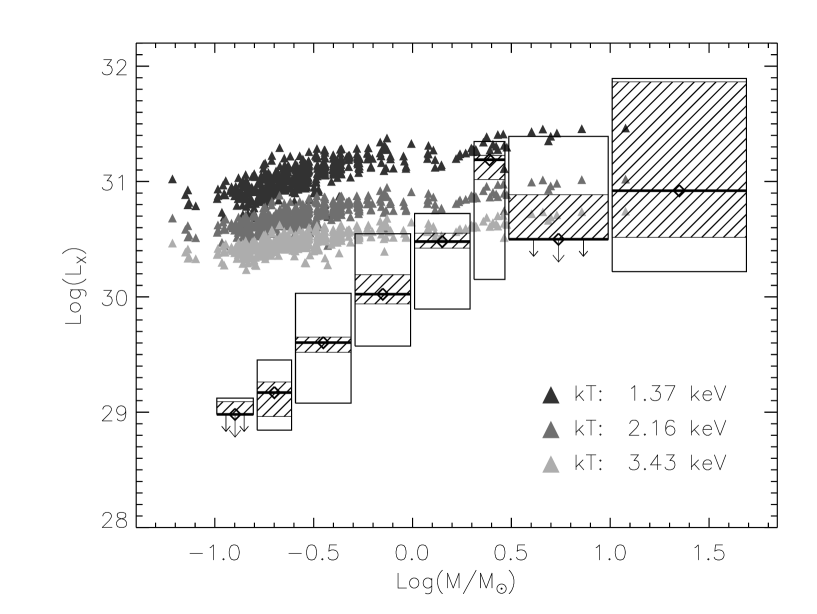
Figure 3 shows Maximum Likelihood X-ray luminosity functions (XLFs) for ONC members in eight mass bins, while Figure 4 shows a scatter plot of vs. mass with characterizations of the XLFs superposed for the same mass bins (see caption). In Figure 4 a direct correlation between median and mass can clearly be seen for , while in the mass range from 3 to 10 (where 6 of 12 stars have luminosities below detection threshold) the median drops significantly and only an upper limit can be estimated. For massive O-type stars with , rises again.
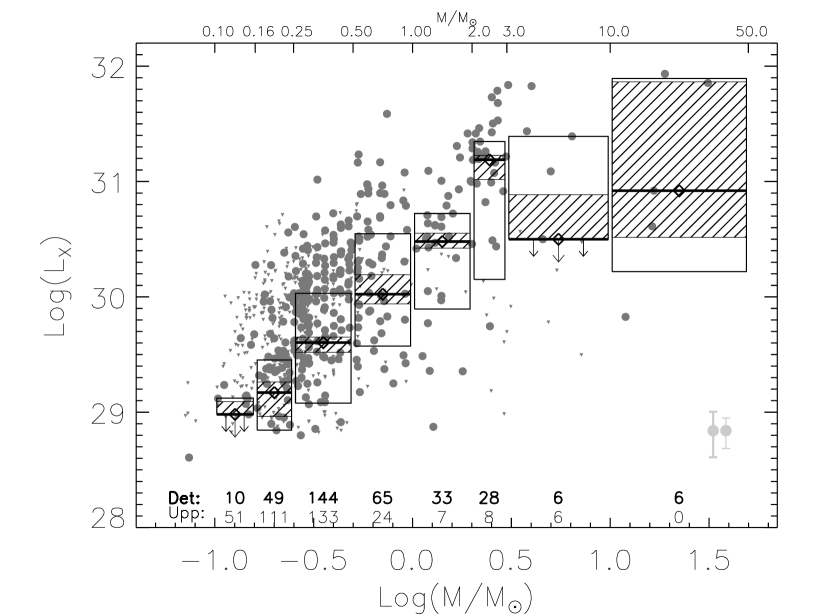
Scenarios in which a dynamo drives X-ray activity would interpret this break at 3 as the point at which stars of the ONC’s age () become fully radiative and the dynamo stops functioning. This interpretation is indeed supported by the stellar structure evolutionary tracks of Siess, Dufour, & Forestini (2000, hereafter SDF).
The drop in at 3 is even more pronounced than shown in Figures 3 and 4 if we take stellar multiplicity into account. The fact that most secondaries will have significantly lower masses than their primaries, together with the mass – relation, means that multiplicity effects on the XLFs can generally be expected to be rather small. But if primaries in the bin have very little intrinsic X-ray emission, we will detect only secondary emission. Indeed, we observe that the XLF for mass stars crosses those for stars of lower mass and is determined for about half the bin population. This lends indirect support to the hypothesis that emission for mass stars is mainly due to unresolved secondaries.
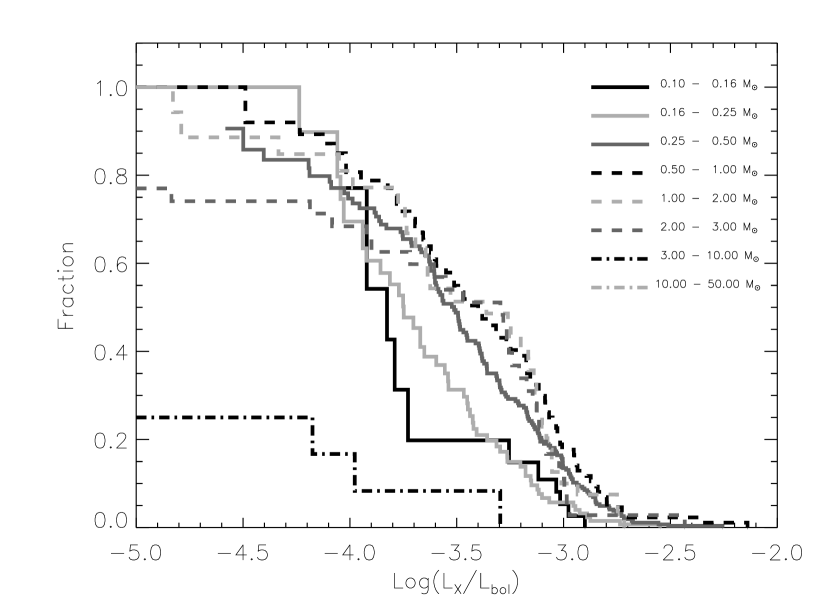
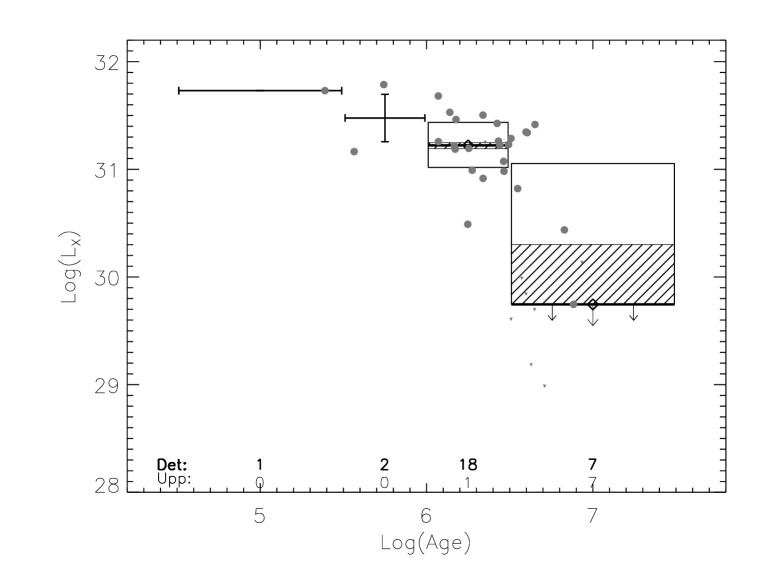
Figure 5 shows distribution functions for , in the same mass bins as defined for Figure 3, while Figure 6 follows the format of Figure 4 to show vs. mass (logarithmically). The drop in activity at is even more striking with as an indicator: more than 2 orders of magnitude (note that the median value in the range is an upper limit). It is also interesting to note that the upper envelope of for stars with is compatible (within uncertainties) with the level of , i.e. the saturation level found for both rapidly-rotating main sequence stars (Vilhu & Walter, 1987) and low mass stars in several other star formation regions (e.g., Alcala et al., 1997; Flaccomio et al., 2000). This is also apparent from Figure 5. No satisfactory theoretical explanation for the physical nature of this saturation has been found to date. Our analysis quantifies typical values in terms of the median and the scatter of points and finds somewhat lower values than the canonical -3 value, indicating either a different saturation level or perhaps the presence of a mix of saturated and non-saturated stars. There also seems to be a relationship between median level and stellar mass, with the lowest mass stars (e.g., those in the 0.10-0.16 bin) having a significantly lower median value of than those of higher mass stars. The range of the variation between the 0.10-0.16 and the 0.5-1.0 bins is 0.45 dex, larger than our estimated uncertainty in individual values (cf. Paper I). A viable theoretical explanation of activity in the PMS phase will have to account for this mass dependence of either the fraction of saturated vs. unsaturated stars or of the saturation phenomenon itself.
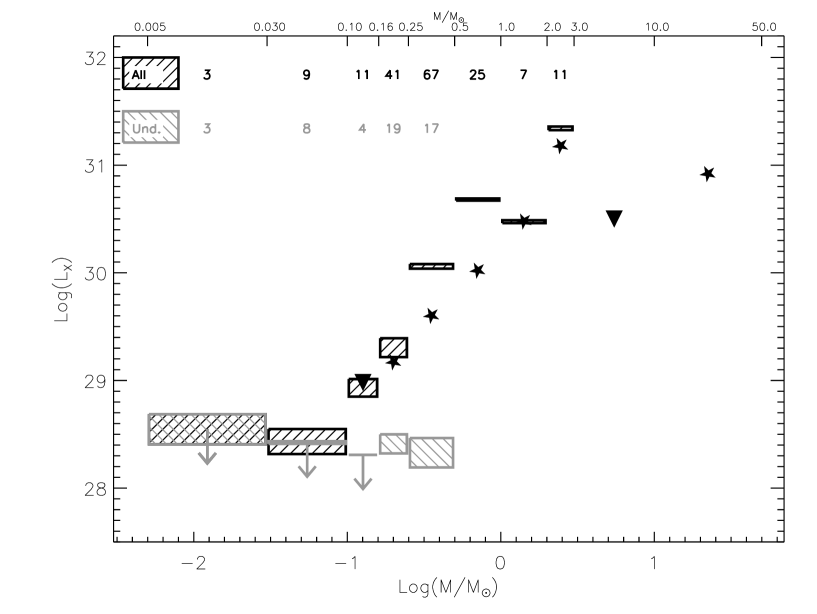
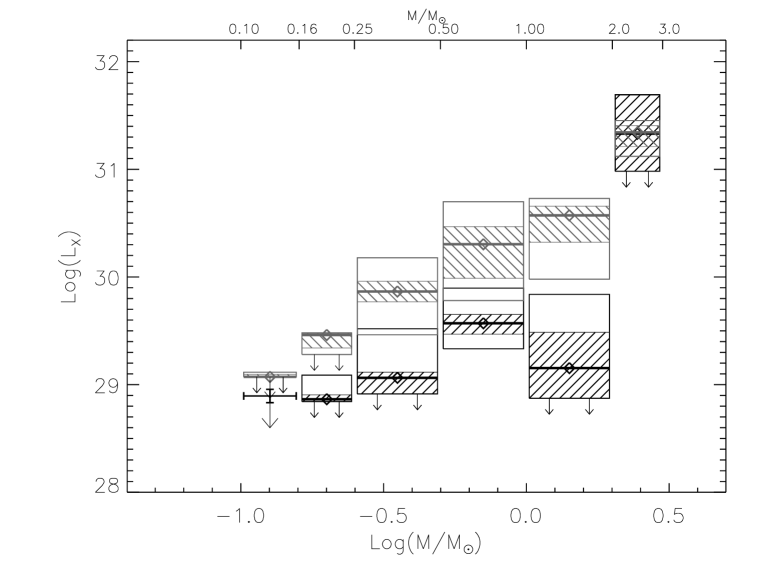
To conclude our study of X-ray activity vs. stellar mass, we now wish to address the X-ray properties of the significant fraction of undetected very low mass stars. More specifically we wonder whether non detected stars are simply located at the bottom of the distributions shown in Figure 3 or whether they constitute distinct stellar populations with significantly lower X-ray luminosities. Appendix A describes how we used our Chandra HRC data to derive (or constrain) mean X-ray luminosities for mass segregated groups of objects, some or all of which are individually undetected. The method measures the flux of a “composite” source by summing HRC photons detected at the optical positions of individually undetected objects comprising the “composite.”
Figure 7 shows the logarithm of average , both for the whole reference sample222Note that this reference sample contains fewer objects than the complete optical sample. This is due to a number of constraints imposed when selecting objects to which our method was applied (cf. Appendix A). and for undetected objects in several mass bins. The height of the boxes reflect the uncertainty in the count-rate to flux conversion factors for the “composite” source (see Appendix A). The number of summed objects in each mass bin is reported in the upper part of the figure, and for reference, the median from Figure 4 is also shown. As a “sanity check” we compared the average computed with the method described in Appendix A for the whole reference sample of detected and undetected objects with the average computed from the maximum likelihood luminosity functions (not shown in the figure). We find the two results consistent, lending support to this analysis. Note that the discrepancy of mean and median in Figure 7 is indeed due to a real difference between the two indices and indicates an asymmetry in the distributions.
From Figure 7 we therefore draw the conclusion that undetected stars in the stellar samples () have an average well below our sensitivity limit (note that the 0.1-0.16 bin has only an upper limit). This could either mean that the XLFs have very long low-luminosity tails or indicate the existence of a stellar population with quiescent/suppressed magnetic activity.
The same qualitative results found in this section are also obtained if the evolutionary tracks of D’Antona & Mazzitelli (1997) are substituted for those of SDF in estimating masses. Similarly, if we exclude the few optical sample stars with unknown astrometric membership (cf. Paper I) from our analysis, the results also remain unchanged.
2.3 Brown Dwarfs
Our optical sample contains 15 substellar mass objects () all of which were studied through IR spectroscopy by Lucas et al. (2001). Only one of the brown dwarfs (BD), with an estimated mass of , is detected in our HRC data333The brown dwarf status of this object is uncertain. The quoted mass is taken from Lucas et al. (2001). However, an independent mass estimate from the optical data of Hillenbrand (1997) and the SDF tracks (cf. Paper I) gives a larger value of .. Our XLF analysis therefore cannot be extended to such low masses. This poses the question of why so few brown dwarfs are detected: Are BDs subluminous in X rays with respect to our mass – relation, or do they fall on this relation but below our limiting sensitivity level, as a linear extrapolation of the mass – relationship in Figure 4 indeed suggests.
In order to investigate this question, we once again applied the method of Appendix A: the two substellar mass bins in Figure 7 show our results. The lowest mass bin contains just 3 undetected objects and yields only an upper limit. Nine objects lie in the brown dwarf bin ()444Although this mass range nominally extends above the BD limit, the most massive object in this bin has a mass of only . and our method yields a positive detection of the “composite” source with high confidence555An integrated flux of 40.1 photons in a total effective exposure time of 553 ksec is measured. As discussed above, one of these 9 objects is detected individually, with 16.2 extracted counts. If we exclude this object of uncertain BD status, the resulting “composite” source falls slightly below our detection threshold (), with its probability of being due to background fluctuations at (). Figure 7 indicates it as an upper limit corresponding to less than 25.1 photons accumulated over an effective exposure time of 491 ksec. Had we instead accepted it as a positive detection, an accumulated photon count of 23.9 would imply an X-ray luminosity virtually identical to the upper limit value.. Figure 7 indicates that: 1) brown dwarfs in the ONC do not depart from the - mass relationship we observe for higher mass stars, and 2) the mean BD X-ray luminosity is of the order of ergs-1. On average this is higher than the recent results obtained for BDs in IC 348 by Preibisch & Zinnecker (2001), but lower than the reported by Imanishi et al. (2001) for one detected BD and one BD candidate in the young Ophiuchi cloud.
2.4 Stellar age
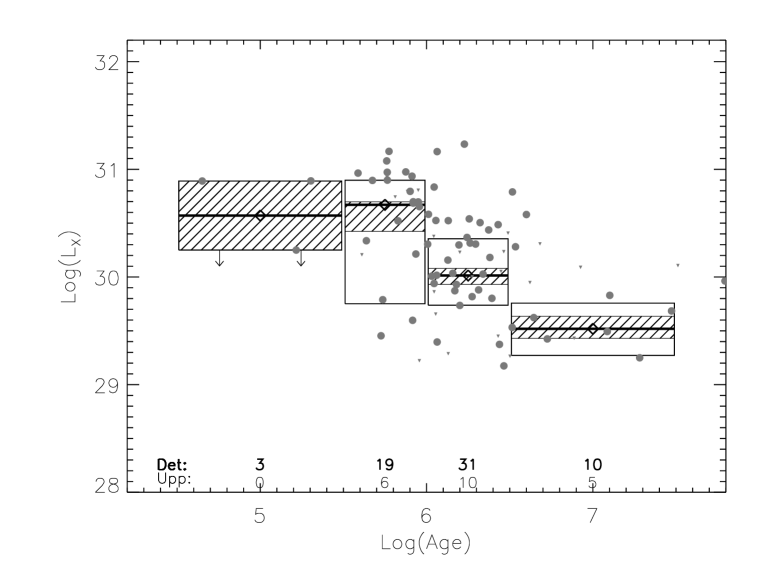
Although the relationship with mass explains a good deal of the scatter in activity levels of our sample, the deviations from this trend are still significant. The next stellar parameter we investigate in order to understand this residual scatter is the age, as inferred from the SDF evolutionary tracks. Figure 9 shows the vs. plot for stars in our sample with mass between 0.5 and 1.0 . The median appears to decrease with increasing age, but we must exercise special care in the interpretation of this trend: there is a widespread concern that the age spread indicated by the position of low mass stars still on the Hayashi tracks may be largely, or even entirely, due to an artificial spread in the bolometric luminosities (cf. Hartmann, 2001). The sources of error that may contribute to uncertainties in and consequent age are indeed numerous and include uncertainties in: adopted distance, spectral type and extinction, photometric variability, unresolved companions, and accretion luminosity. On the other hand, if one were to concede a real age spread in the ONC (plausible as star formation is still taking place at the present day), stellar ages might carry a statistical and relative significance, though still uncertain on an individual basis: stars that we place lower on the Hayashi tracks may be older, on average, than those that we place higher. This latter hypothesis is supported by the time evolution of ONC stellar radii recently observed by Rhode et al. (2001). Although our correlation of with age also seems to argue in favor of a real age spread, it could also be an artifact of an interrelation between inferred and , and the matter remains open. Indeed the trend in Figure 9 corresponds to a constant ratio of X-ray to bolometric luminosity at different ages and can be interpreted equally well in two different ways: 1) Stars of equal mass have equal bolometric and X-ray luminosities, but there are effects that act in exactly the same way on both and ; 2) These stars are saturated and stay saturated through their contraction on the Hayashi tracks, thus keeping constant.
Figure 9 presents a plot of vs. for stars in the mass bin and reveals an age dependence and a sudden drop of at (a similar drop is also seen in ). This is just the age at which a star dissipates its convective envelope according to the SDF models, lending further evidence for the convection – activity connection found in §2.2. Figure 9 also supports the existence of a real age spread in the ONC. Contrary to the situation in the mass range, evolution of these higher mass stars occurs in temperature as well as in luminosity for . The spread in age therefore cannot be due to a spurious spread in , as may be the case in the lower mass bin.
| Mass [] | ||||||||
|---|---|---|---|---|---|---|---|---|
| Log(Age) [yr.] | 0.1-0.16 | 0.16-0.25 | 0.25-0.50 | 0.5-1.0 | 1.0-2.0 | 2.0-3.0 | 3.0-10.0 | |
| 4.5-5.5 | Det. | 1 | 14 | 13 | 3 | 0 | 1 | 0 |
| ” | Upp. | 6 | 12 | 6 | 0 | 0 | 0 | 0 |
| 5.5-6.0 | Det. | 3 | 7 | 27 | 19 | 1 | 2 | 3 |
| ” | Upp. | 13 | 16 | 18 | 6 | 0 | 0 | 1 |
| 6.0-6.5 | Det. | 3 | 21 | 95 | 31 | 12 | 18 | 2 |
| ” | Upp. | 8 | 43 | 80 | 10 | 3 | 1 | 3 |
| 6.5-7.5 | Det. | 3 | 7 | 7 | 10 | 20 | 7 | 0 |
| ” | Upp. | 24 | 39 | 27 | 5 | 4 | 7 | 0 |
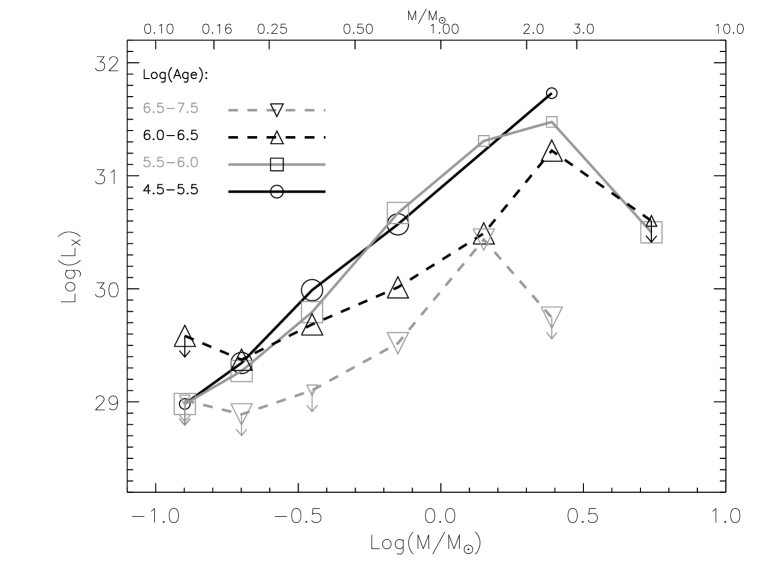
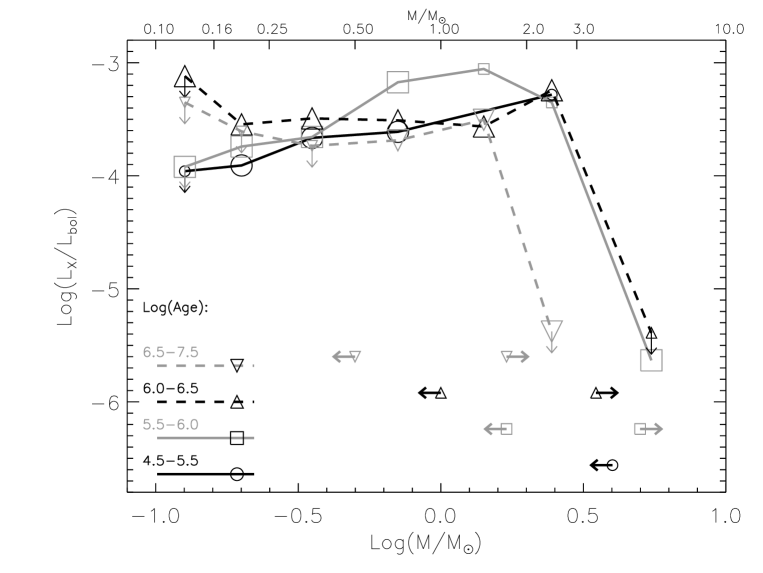
Figures 10 and 11 show trends of median and as a function of mass in each of four age bins. Care must be taken in interpreting these plots because many of the mass/age bins for which medians are computed are sparsely populated (numbers of detections and upper limits are given in Table 1) and some points are subject to rather large uncertainties. In those bins with less than four detections, we show means computed from the XLFs (instead of medians), and both medians and means are replaced by upper limits in some cases. From left to right in the lower portion of Figure 11 we show mass ranges over which stars of each age bin are fully convective, partially convective, and fully radiative according to SDF tracks. We can draw several conclusions from this presentation: 1) For all ages, increases with mass for low masses and then suffers a break at higher mass; 2) The mass at which this break occurs appears to depend on the age, being lower for the oldest stars in our sample; 3) There is good agreement between the mass at which the break occurs and the mass at which stars in that age bin become fully radiative; 4) The increase of with mass appears again at the low mass end, at least for .
2.5 Accretion/disk indicators: Ca II
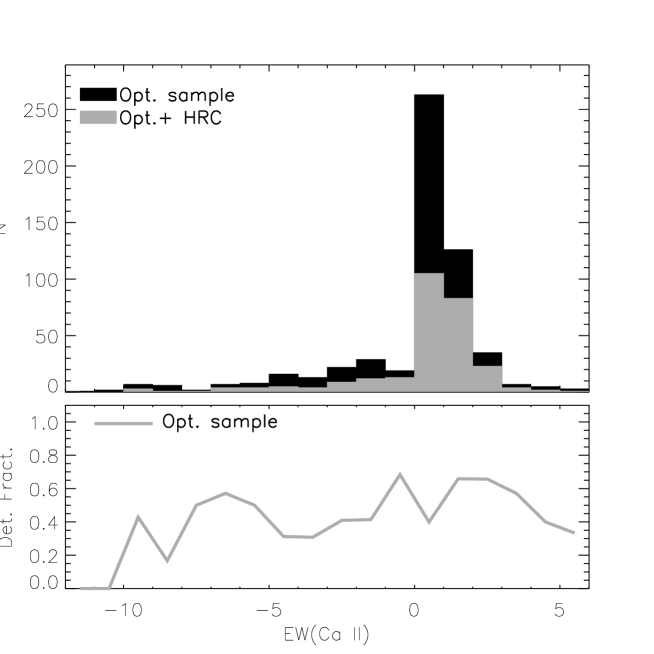
It has long been disputed whether the presence of circumstellar disks and/or circumstellar accretion plays a role in determining the activity levels of PMS stars. We are now in the position to address this problem in the ONC. We will use the equivalent width () of the Ca II triplet as an indicator of disk accretion. In main sequence and weak-line T Tauri stars, where accretion is absent, this line is seen in absorption with , a value that depends only weakly on spectral type (cf. discussion in Hillenbrand et al., 1998). Accretion has the effect of filling in the line and the is then related to the mass accretion rate (Muzerolle et al., 1998). The observational values we will use are those obtained through resolution spectroscopy by Hillenbrand (1997) for a large fraction of our optical sample (see Table 5 of Paper I). Figure 12 (upper panel) shows the distribution of the Ca II both for our optical sample and for the subset of HRC detected stars. The detection fraction as a function of is shown in the lower panel.
In order to make the distinction between accreting and non accreting stars more evident and to minimize the effects of observational uncertainties666Hillenbrand et al. (1998) quote errors of ., we divided our stars in two groups: stars whose Ca II line is seen in absorption, with Ca II, and which therefore are inferred to have low or no accretion, and stars that show the line in clear emission, with Ca II, and which are undergoing significant accretion. We exclude from our analysis stars with Ca II, about half the sample for which we have Ca II information (see Figure 12). As the majority of stars in the ONC appear to possess a circumstellar accretion disk, judging from both Ca II line and IR photometric indicators (Hillenbrand et al., 1998; Lada et al., 2000; Muench et al., 2001), we refer to stars in the two selected groups as having high and low circumstellar accretion and avoid using the terms “classical” or “weak-line” T Tauri stars.
In Figure 13 we present X-ray luminosity functions for stars in the six lowest mass ranges defined in §2.2, computed separately for the two accretion-differentiated samples. Figure 14 shows median vs. depicted in the same format as Figure 4 and separated into low- and high-accretion subsamples. For any mass bin with enough points, it is clear in either representation that stars with high accretion have lower median than low-accretion stars. The difference of the medians is about an order of magnitude in the mass range. Two-population statistical tests confirm the difference with high confidence (null-hypothesis probabilities less than , for ). Similar plots for confirm the same result, also with high confidence: low-accretion objects are more X-ray active that similar high-accretion objects. In order to check that the dependence of activity on accretion is not due to different mean ages/bolometric luminosities in the two subsets, we repeated this analysis in several mass and age slices, similar to those of Figure 10. When we did this, we invariably confirmed that the high-accretion stars are less X-ray active than the low-accretion ones. For any mass and age bin where the two subsamples are well represented, we obtain highly significant results (e.g., in the bin with and , null-hypothesis tests give better than 99.96% confidence that the two accretion categories differ).

Differences in X-ray activity level aside, trends of mean activity with mass seem to hold preferentially for low accretion stars. The scatter in X-ray activity levels in any given mass range also appears lower for low-accretion stars than for the whole sample (cf. Figures 4 and 14). A relationship of activity with mass is not apparent for high-accretion stars, which also evidence larger spreads in their activity levels.
3 The nature of unidentified sources
Forty of our HRC sources remain unidentified with any optical/IR object. In this section we will explore the nature of these sources.
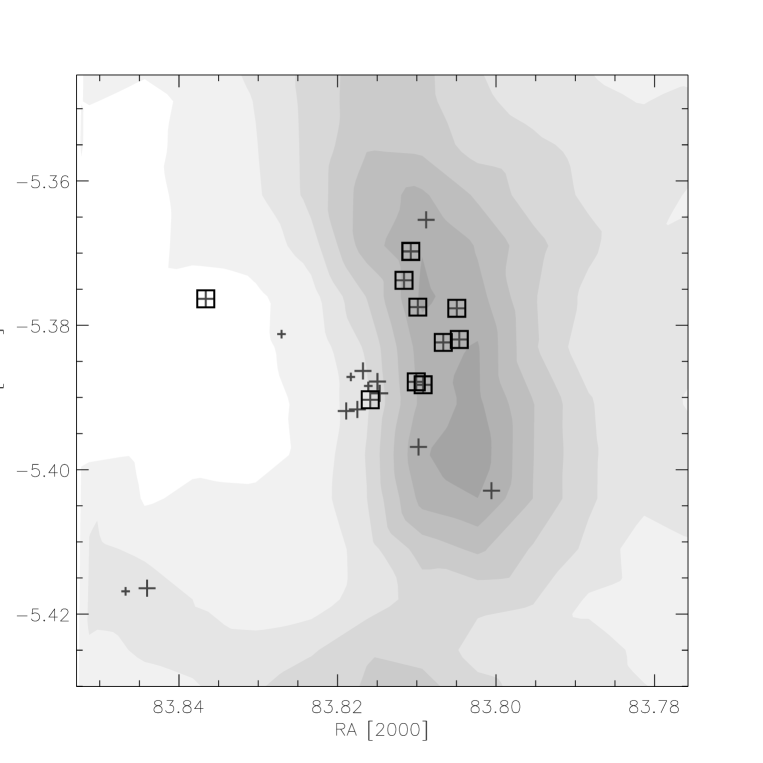
As noted in Paper I (cf. §2.2), our X-ray detection method will yield about 10 spurious detections, and virtually all of these are expected to be unidentified (Paper I, §3.2) and have near-threshold SNRs. We therefore have sources with no optical/IR identification (”non-IDs”) that are expected to be real and require some explanation777Of the 40 “non-IDs” 14 were previously detected with Chandra by Garmire et al. (2000) and/or Schulz et al. (2001); we are therefore confident that these 14 X-ray detections are not spurious. . Particularly puzzling is the fact that most of them appear in the central of the FOV (see Figure 15) where the -band coverage is quite deep (limiting ). A first clue to their nature comes from their spatial distribution and from the correlation with the Goldsmith, Bergin, & Lis (1997) 13CO data on the molecular cloud total extinction, as shown in Figure 15. If we exclude four, likely-spurious888We note that the 26 (=40 - 14, see footnote 7) unidentified detections that have not been confirmed have extremely low SNRs (median SNR = 4.94, vs. 12.45 for those previously confirmed by Chandra). sources with , the median -band total extinction at the positions of the remaining sources is 63 mag, much larger than that for all detected sources (24 mag) in this central region. This suggests that the ”non-IDs” as a group are high-intrinsic X-ray luminosity objects, which are either highly embedded in the cloud or which lie in the background.
This conclusion is supported by our analysis of the hydrogen column density, , measured directly from X-ray data (cf. Appendix A of Paper I). Since the “non-IDs” are largely low-SNR detections9, however, the hardness ratios derived from Advanced CCD Imaging Spectrometer (ACIS, Townsley et al. 2000) spectra are subject to large uncertainties.999The hardness-ratio approach suffers not only from low source statistics but also from the fact that the low-energy hardness ratio saturates at high values of extinction (see Paper I, Appendix A). Nevertheless, the fact that the low-energy portion of their spectra are extremely underpopulated with respect to higher energies is consistent with the hypothesis of high extinction: on average, “non-ID” hardness ratios suggest optical extinction magnitudes.
Having established that a majority of our unidentified sources are associated with highly absorbed objects, we next consider whether or not the hypothesis that they are high-intrinsic luminosity, embedded cluster members is compatible with the observational constraint that they are not detected in the deep -band survey. We can derive an empirical relationship between stellar mass and intrinsic, non absorbed, -band magnitude101010There is significant scatter in for this relation, probably due both to variable IR excesses induced by the presence of circumstellar disks and to a spread in stellar ages. by considering the two quantities for ONC members with low measured optical extinction (). We then derive, as a function of mass, the minimum -band extinction needed to make these sources fall below the -band sensitivity threshold of . Converting this minimum to a minimum and assuming a detection threshold of 10 photons, we then find the minimum that stars emitting at a given temperature and similar to those in our low-extinction sample should have in order to be both detected in our HRC data and too absorbed to appear in the deep -band survey.
Figure 16 shows the result of this exercise for three different assumed source temperatures within the range determined in Paper I. Any source that we detected without a -band counterpart requires an X-ray luminosity in excess of 1030.3 ergs-1. The large scatter in inferred values (for a given temperature) is due to the spread in the mass – -band magnitude relation. We also show on the same plot the relation obtained in §2.2 between stellar mass and for the optical sample. We conclude that “non-IDs” may well be embedded ONC members but must have masses larger than , i.e. lower mass ONC members of the same activity level as our optical sample, if detected in X rays, must appear in the K-band survey and hence cannot be “non-IDs.”
Thus we have established that the “non-IDs” are indeed affected by high extinction and that their HRC count rates and -band magnitude lower limits are compatible with their being highly absorbed ”high” mass PMS stars similar to those of our optical sample. In order to confirm their ONC membership, we must also exclude the possibility of their being background extragalactic objects.
We can estimate the number of expected extragalactic X-ray sources by combining information on the expected sky density of such objects, as a function of unabsorbed flux (Giacconi et al., 2001; Tozzi et al., 2001), with our knowledge of the total extinction due to the Orion Molecular Cloud (Goldsmith, Bergin, & Lis, 1997). For this exercise we make the following assumptions: 1) Extragalactic sources have power law spectra of photon index between 1.3 and 1.5, compatible with values derived by Giacconi et al. (2001); 2) The sky density of extragalactic objects as a function of unabsorbed flux follows the descriptions of Giacconi et al. (2001) and Tozzi et al. (2001)111111They give two relations, and , for the sky density of objects with unabsorbed flux larger then , measured in soft (0.5-2.0 keV) and hard (2.0-10.0 keV) spectral bands, respectively.; 3) Observed photon flux is determined by intrinsic flux and an absorption proportional to the molecular cloud total optical absorption (), as estimated from radio data by Goldsmith, Bergin, & Lis (1997); we use to denote the unabsorbed flux to HRC count rate conversion factor computed with PIMMS, which depends on , the assumed source spectrum and the spectral band under consideration; and 4) We can detect sources above count rate thresholds, , computed as the photon threshold (viz. 6, 8 or 10) divided by exposure time. With these assumptions, the surface density of extragalactic sources seen through a given hydrogen column density becomes and we can compute the expected number of extragalactic sources detected in an area as:
| (1) |
where is the infinitesimal area element and is a function of position on the sky. Computing the integral (1) for the given values of , and energy band (and therefore ), we find expected numbers of detectable extragalactic objects in the inner of our FOV ranging from 0.6 to 1.2. An extragalactic nature for most of our unidentified sources is therefore excluded, and most “non-IDs” can indeed be highly embedded ONC members never observed with optical or near-IR instruments.
We can get a rough estimate for the size of this hidden population if we assume that counterparts of the 20 unidentified field-center sources (expected to be real) have masses larger than (cf. Figure 16) and that the ratio of the number of stars with to stars with is the same as for our optical sample, namely, 25% for the field center and 16% for the entire FOV. We obtain the interesting result that the undiscovered population numbers between 80 and 125 stars, i.e., about half of the optically-well characterized members 121212About 200 stars are placed in the HR diagram, and 140 are in our optical sample. in the same region and about a quarter of the optical objects studied by Hillenbrand (1997). For comparison, there are stars seen in the infrared with , implying masses that roughly correspond to the mass range spanned by our optical sample. We conclude, therefore, that the central region of the ONC contains 100 additional stars that remain hidden from the deepest -band surveys conducted to date.
4 Discussion and Summary
Using Chandra X-ray data and recent optical/IR data from the literature, both presented in Paper I, we have studied relationships among X-ray activity indices and various stellar parameters for an optically-selected sample of ONC members. Our ultimate goal is to explain on physical grounds the mechanisms responsible for X-ray emission and magnetic activity in PMS stars.
We do not find any correlation of either or with stellar rotational period. This result has sometimes been regarded as evidence against the - dynamo explanation of activity for PMS stars. We note however that: 1) Although the sample of stars for which we have a measure of rotational period is larger than ever considered in similar past studies, it is still biased toward more active stars, as judged from distributions of X-ray activity indicators; 2) Many of the sources with known rotational properties may thus have saturated activity levels and the intensity of their X-ray emission may therefore be insensitive to the rotational period; 3) 90% of these rotational periods are shorter than 10 days; 4) As discussed by Flaccomio (2002), periods up to days might correspond to saturated activity for 1 Myr-old stars, according to the consolidated activity – Rossby number relation. We therefore do not regard the present lack of evidence of a rotation-activity relationship as conclusive for the ONC and look forward the realization of more complete rotational period databases. We also note that even if the measured rotational periods were representative of the whole ONC population (as recently indicated by Rhode et al. 2001), a lack of correlation does not necessarily require a new explanation of activity.
As previously noted for other star forming regions (e.g., Feigelson et al., 1993), we find a significant correlation of with mass for . The logarithm of the median rises quite linearly on a logarithmic mass scale from to , but for higher masses, drops sharply before rising again above . The drop in activity at is even more dramatic in (more than two orders of magnitude) and may be further enhanced if proper account for multiplicity were taken. Supported by recent PMS evolutionary models (SDF) we interpret this drop as the effect of the disappearance of a convective envelope for stars more massive than . In general we note a convincing correlation between the presence of a convective layer and activity for .
For , the median is observed to be quite stable at about -3.5, lower than (though close to) the saturation level. At lower masses however we observe a decrease of the median with decreasing mass, as it falls by a factor of ( dex) between and . We are unsure of the origin of this mass dependence but note a rough coincidence between the turning point in the - mass relation, at , and the mass at which 1 Myr stars cease to be fully convective (cf. Figure 11). We suggest this may be due to a transition from an – dynamo to a fully-convective dynamo. It may be even more relevant to note that the median value of the Ca II line equivalent width, which can be used as a proxy of disk accretion (cf. §2.5), is significantly lower for stars with masses below 0.5 (median =-0.15) than for stars with mass between 0.5 and 3.0 (median =0.94), possibly indicating a larger fraction of accreting stars at low masses131313There is indeed growing evidence that disk lifetime is longer for lower mass stars. Two examples of such a result, based on detection of disks in the IR, can be found in Hillenbrand et al. (1998) for the ONC and Haisch et al. (2001) for IC 348.. We therefore propose (cf. Flaccomio 2002) that the increase of at low masses might be the effect of a decrease, with increasing stellar mass, of the fraction of stars that are accreting and/or are surrounded by disks. We indeed found such stars to have significantly lower activity levels (§2.5).
Although we do not detect any securely identified brown dwarfs, we are able to estimate the mean X-ray luminosity for the 9 spectroscopically confirmed BDs of the BD bin in Figure 7. The mean of ergs-1 appears to be on the same vs. mass relationship we observe for higher mass stars. This is not particularly surprising because at this evolutionary stage BDs do not fundamentally differ from low mass fully convective PMS stars.
We have evidence of the presence of a population of very weak emitters at the low mass end. In the mass bin, for example, we observe that the mean X-ray luminosity of stars individually not detected in the X-ray data (Paper I) is orders of magnitude lower with respect to the mean of the whole sample, indicating either a very wide or a bimodal X-ray luminosity distribution. At least part of this dispersion can be explained by a dependence of activity on circumstellar accretion rate. By discriminating stars with high and low circumstellar accretion on the basis of the Ca II () equivalent width, we prove with high statistical significance that the X-ray activity of the two groups differs by as much as an order of magnitude. The relationships of median and with mass appear to hold exclusively for the low accretion sample. We also note that the scatter in activity at a given mass appears to be larger for the high accretion sample than for the low accretion sample. Although the origin of these differences is presently unknown, we put forward three possible scenarios:
1) Accreting stars are rotating slowly due to disk breaking and their dynamo efficiency depends on rotation, while those accreting less have broken free of their disks to spin-up and thus saturate their activity. This hypothesis seems to be contradicted by two facts: low and high accretion stars have statistically indistinguishable rotational periods (cf. Figure 1) and, as reported in §2.1, we do not observe a correlation between activity and . However, the sample of stars for which we have rotational information is not complete and may be subject to biases (see §2.1), so that we cannot rule out this possibility until a more representative sample of rotational periods becomes available.
2) Accretion and/or the presence of a disk, and/or outflows influences coronal geometry, for example, by decreasing the fraction of the stellar surface available for the closed magnetic structures from which X-ray emission is thought to emanate. Other scenarios of altered geometries have been proposed; e.g., Montmerle et al. (2000) argue that coronal structures might extend to the inner part of disk. Because of the inhomogeneous and time variable nature of accretion, variability studies and simultaneous X-ray/optical observations could help clarify this matter.
3) Accreting stars have higher X-ray extinction than assumed, so that the difference in inferred and is only apparent. Although in Paper I our ACIS spectra analysis was not able to exclude this possibility with high confidence, due mainly to the low photon statistics of sources associated with high accretion stars, we also found no supporting evidence for this scenario. Moreover, an empirical determination of the vs. relation for the Ophiuchi population (cf. Imanishi et al. 2001) also does not support this hypothesis. The reason for the departure from the assumed - relation could be that the gas to dust ratio may differ for accreting stars with respect to the average interstellar value, resulting in an underestimation of the X-ray absorption. One could imagine a scenario in which accretion gas columns that cross the line of sight would obscure X-rays and let optical/IR radiation through. The most obvious test for this hypothesis is a better determination of hydrogen absorbing columns through deeper (i.e., longer exposures) medium spectral resolution X-ray observations. As for the previous hypothesis, variability studies might also give useful clues.
Finally we have investigated the nature of sources detected in our HRC X-ray data and not identified with any optical/IR object. On the basis of their X-ray spectra and location in the cloud we conclude that, as a class, they are subject to high extinction. We exclude an extragalactic nature for most of these objects by considering the sky density of such objects as a function of X-ray flux and of the molecular cloud total extinction and conclude that most unidentified X-ray sources are likely associated with deeply embedded, high intrinsic X-ray luminosity, ONC members. Given the relationship between and stellar mass we infer that these stars are most likely fairly massive (), thus indicating the likely presence of a significant number of lower mass, as yet undetected ONC members.
In light of these results, we propose this scenario:
1) Activity in old low mass PMS stars is ultimately due to a dynamo mechanism that requires a convective layer in order to function. Rotation may or may not be a fundamental ingredient of this dynamo.
2) The same mechanism responsible for X-ray emission of low mass stars is probably also at work in brown dwarfs.
3) Many of our stars appear to be saturated. The fraction of saturated stars, or alternatively the saturation level, depends on stellar mass. At low masses we might be seeing the effect of decreasing accretion/disk fraction with increasing mass, or the transition between two kinds of dynamos: one that functions on fully convective stars and brown dwarfs and in which the saturation level depends on mass, and another at work on partially convective - partially radiative stars, characterized by a constant saturation level.
4) Highly accreting stars are seen to be less active with respect to low accretion counterparts, possibly because of (a) different rotational properties, (b) disk/accretion induced modifications of the coronal magnetic field geometry, or (c) anomalous interstellar X-ray absorption due to the presence of circumstellar material.
Additional deep X-ray and IR observations are needed to advance our understanding and enable us to identify which scenario(s) Nature prefers.
Acknowledgments
The authors would like to thank L. Hartman for useful discussion.
This work was partially supported at the CfA by NASA contracts NAS8-38248 and NAS8-39073 and by NASA grant NAS5-4967. F.D., E.F., G.M., and S.S. wish to acknowledge support from the Italian Space Agency (ASI) and MURST. E.F. would like to thank the CfA for its hospitality during his Fellow visits.
Appendix A “Composite” source analysis
Here we describe a “composite” source method we employed to study the mean X-ray properties of groups of ONC members, some or all of which were individually undetected in our HRC data. The method was applied in §2.2 to undetected low mass stars, and in §2.3, to objects of substellar mass.
The basic steps of our method are to: 1) define a suitable sample of stellar or substellar objects; 2) determine the number of photons detected in a circular region at the X-ray position corresponding to each optical object; 3) correct the photon numbers for background contributions and the fact that a (predictable) fraction of the photons from a point-like source will fall outside the extraction circle; 4) sum the contributions of single objects and derive a signal-to-noise ratio (SNR) for the “composite” source; 5) divide the “composite” source net counts (or upper limit, for SNRs below a set threshold) by the cumulative exposure time to obtain a mean count rate for objects in the sample; and finally, 6) convert the mean count rate (or upper limit) to a “composite” value.
The critical points in these six steps for estimating values for the composite sources are as follows:
1)
The selection of composite source samples was based on stellar (or substellar) mass as given by our optical sample. We also added three more requirements: a) that the objects lay in the inner 5′ of the HRC field of view, b) that the closest detected X-ray source (other than the object in question, if detected) was farther away than 5′′ and c) that the measured optical extinction was less than 2.0. Constraint (a) ensures that the PSF at the position of all the objects in the sample contains more than of the photons falling within a circle of radius, while (b) isolates the source to avoid contamination with photons from neighboring sources. Constraint (c) reduces the uncertainty in the conversion between composite source count rates and X-ray luminosities.
2)
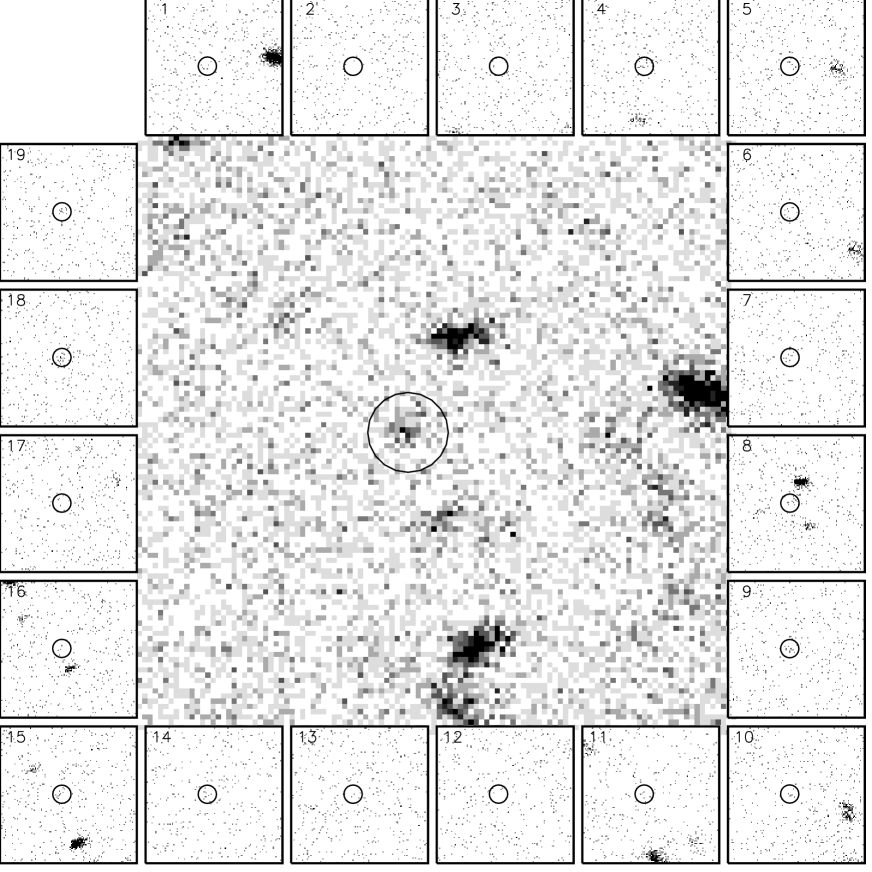
Individual source photons were extracted from a 2′′ circle centered on the optical star position. Figure 17 shows an example of the extraction regions for undetected members in the mass range as well as a graphical representation of the composite source resulting from the summation process.
3)
The background contribution in each of the extraction circles was estimated from the values of the source-free background map produced by pwdetect (cf. Paper I). The fraction of counts from the object falling within this extraction circle ranges from 60% to 95% and was estimated from the images of calibrated PSFs obtained for the position of each source using the ciao task mkpsf and the F1 standard PSF library file (Karovska et al., 2001). Sources were assumed for this purpose to be monochromatic with an energy of 2.0 keV. A visual comparison of the expected and observed shape of the PSF for bright sources in our present sample indicates a good qualitative match.
4)
From counting statistics we estimated the probability that the measured total number of extracted counts is the result of random fluctuation in the background level. In those cases in which such probability was larger than 0.135% (), we computed upper limits to the composite source counts using the same confidence threshold.
5)
The cumulative exposure time used to compute mean count rates for the objects in each mass segregated sample was obtained by summing the values of the exposure map (cf. Paper I) at the position of the objects.
6)
We converted mean count rates to X-ray luminosities in a manner consistent with Paper I, but such conversion depends critically on extinction. While we can derive conversion factors for each of the component objects, a global conversion factor for a composite source cannot be readily defined. If all the objects in the sample had the same intrinsic X-ray luminosity the conversion factor for the average source would be the average of the single conversion factors. In order to reduce the range of individual conversion factors we have limited our object sample to low optical extinction (). However some uncertainty remains: as shown in Figure 8 of Paper I, this range of corresponds to a factor of about 3 ( dex) variation in the conversion factor at our chosen source temperature (2.16 keV). We therefore report two values of luminosity for each of our average sources: one computed with the mean of the conversion factors, the other with the median.
References
- Alcala et al. (1997) Alcala, J. M., Krautter, J., Covino, E., Neuhaeuser, R., Schmitt, J. H. M. M., & Wichmann, R. 1997, A&A, 319, 184
- Bally et al. (2000) Bally, J., O’Dell, C. R., & McCaughrean, M. J. 2000, AJ, 119, 2919
- Bouvier (1990) Bouvier, J. 1990, AJ, 99, 946
- Carpenter (2000) Carpenter, J. M. 2000, AJ, 120, 3139
- Casanova et al. (1995) Casanova, S., Montmerle, T., Feigelson, E. D., & Andre, P. 1995, ApJ, 439, 752
- Damiani & Micela (1995) Damiani, F. & Micela, G. 1995, ApJ, 446, 341
- D’Antona & Mazzitelli (1997) D’Antona F., Mazzitelli I., 1997,Mem. S. A. It. Vol. 68. No. 4 (G. Micela, R. Pallavicini, S. Sciortino eds.)
- Feigelson & Nelson (1985) Feigelson, E. D. & Nelson, P.I. 1985, ApJ, 293, 192
- Feigelson et al. (1993) Feigelson, E. D., Casanova, S., Montmerle, T., & Guibert, J. 1993, ApJ, 416, 623
- Flaccomio et al. (2000) Flaccomio, E., Micela, G., Sciortino, S., Damiani, F., Favata, F., Harnden, F. R., & Schachter, J. 2000, A&A, 355, 651
- Flaccomio (2002) Flaccomio, E. 2002a Ph.D. Thesis
- Flaccomio et al. (2002) Flaccomio, E., Damiani, F., Micela, G., Sciortino, S., Harnden, F. R., Murray, S. S., & Wolk, S. J. 2002, ApJ, in press
- Gagné et al. (1995) Gagne, M., Caillault, J., & Stauffer, J. R. 1995, ApJ, 445, 280
- Garmire et al. (2000) Garmire, G., Feigelson, E. D., Broos, P., Hillenbrand, L. A., Pravdo, S. H., Townsley, L., & Tsuboi, Y. 2000, AJ, 120, 1426
- Giacconi et al. (2001) Giacconi, R. et al. 2001, ApJ, 551, 624
- Goldsmith, Bergin, & Lis (1997) Goldsmith, P. F., Bergin, E. A., & Lis, D. C. 1997, ApJ, 491, 615
- Haisch et al. (2001) Haisch, K. E., Lada, E. A., & Lada, C. J. 2001, AJ, 121, 2065
- Hartmann (2001) Hartmann, L. 2001, AJ, 121, 1030
- Herbst et al. (2000) Herbst, W., Rhode, K. L., Hillenbrand, L. A., & Curran, G. 2000, AJ, 119, 261
- Hillenbrand & Carpenter (2000) Hillenbrand, L. A. & Carpenter, J. M. 2000, ApJ, 540, 236
- Hillenbrand (1997) Hillenbrand, L. A. 1997, AJ, 113, 1733
- Hillenbrand et al. (1998) Hillenbrand, L. A., Strom, S. E., Calvet, N., Merrill, K. M., Gatley, I., Makidon, R. B., Meyer, M. R., & Skrutskie, M. F. 1998, AJ, 116, 1816
- Hillenbrand & Hartmann (1998b) Hillenbrand, L. A. & Hartmann, L. W. 1998, ApJ, 492, 540
- Karovska et al. (2001) Karovska, M. et al. 2001, ASP Conf. Ser. 238: Astronomical Data Analysis Software and Systems X, 10, 435
- Imanishi et al. (2001) Imanishi, K., Koyama, K., & Tsuboi, Y. 2001, ApJ, 557, 747
- Lada et al. (2000) Lada, C. J., Muench, A. A., Haisch, K. E., Lada, E. A., Alves, J. F., Tollestrup, E. V., & Willner, S. P. 2000, AJ, 120, 3162
- Lucas et al. (2001) Lucas, P. W., Roche, P. F., Allard, F., & Hauschildt, P. H. 2001, MNRAS, 326, 695
- Luhman et al. (2000) Luhman, K. L., Rieke, G. H., Young, E. T., Cotera, A. S., Chen, H., Rieke, M. J., Schneider, G., & Thompson, R. I. 2000, ApJ, 540, 1016
- Montmerle et al. (2000) Montmerle, T., Grosso, N., Tsuboi, Y., & Koyama, K. 2000, ApJ, 532, 1097
- Muench et al. (2001) Muench, A. A., Alves, J. ;., Lada, C. J., & Lada, E. A. 2001, ApJ, 558, L51
- Murray et al. (2000) Murray, S. S. et al. 2000, Proc. SPIE, 4012, 68
- Muzerolle et al. (1998) Muzerolle, J., Hartmann, L., & Calvet, N. 1998, AJ, 116, 455
- O’Dell (2001) O’Dell, C. R. 2001, PASP, 113, 29
- Preibisch & Zinnecker (2001) Preibisch, T. & Zinnecker, H. 2001, AJ, 122, 866
- Rebull (2001) Rebull, L. M. 2001, AJ, 121, 1676
- Rhode et al. (2001) Rhode, K. L., Herbst, W., & Mathieu, R. D. 2001, AJ, 122, 3258
- Schulz et al. (2001) Schulz, N. S., Canizares, C., Huenemoerder, D., Kastner, J. H., Taylor, S. C., & Bergstrom, E. J. 2001, ApJ, 549, 441
- Siess, Dufour, & Forestini (2000) Siess, L., Dufour, E., & Forestini, M. 2000, A&A, 358, 593
- Stassun et al. (1999) Stassun, K. G., Mathieu, R. D., Mazeh, T., & Vrba, F. J. 1999, AJ, 117, 2941
- Stelzer & Neuhäuser (2001) Stelzer, B. & Neuhäuser, R. 2001, A&A, 377, 538
- Strom & Strom (1994) Strom, K. M. & Strom, S. E. 1994, ApJ, 424, 237
- Townsley et al. (2000) Townsley, L. K., Broos, P. S., Garmire, G. P., & Nousek, J. A. 2000, ApJ, 534, L139
- Tozzi et al. (2001) Tozzi, P. et al. 2001, ApJ, 562, 42
- Vilhu & Walter (1987) Vilhu, O. & Walter, F. M. 1987, ApJ, 321, 958
- Walter & Barry (1991) Walter, F.M. & Barry, D.C. 1991, In The Sun in Time, Eds. Sonnett, C.P. et al. (Univ. Ariz. Press, Tucson), pg. 633.