Model atmosphere analyses of post-common envelope stars
Abstract
Understanding post-common-envelope evolution is important in the studies of close-binary systems. The majority of all interacting binaries with a compact object in their system (e.g. cataclysmic variables, X-ray binaries) are thought to have passed through a common-envelope (CE) phase. Current models of interacting binaries all assume, as a starting point, that there is no significant modification of the secondary star compared with a normal star of similar spectral type. The extent to which the CE significantly alters the composition of the secondary star has yet to be determined.
We are studying the M-type secondary in the pre-CV system EG UMa, in order to determine its atmospheric parameters by comparison with synthetic spectra generated using phoenix. Absorption lines due to several elements have been used in investigating the stellar parameters of effective temperature, gravity and over elemental abundance. In addition, we are searching for anomalies due to s-process elements (such as Ba, Sr, Rb, Y), which may have been deposited in the atmosphere during the CE stage, and prove that CE evolution has occurred.
EG UMa displays strong YO absorption bands, which are normally associated with giants and S stars. These bands may have been formed as a result of an Y-abundance enhancement introduced by the CE, which would be consistent with the observed possible Rb and Sr enrichment.
Astrophysics Group, School of Chemistry & Physics, Keele University, Staffordshire, ST5 5BG, United Kingdom
Department of Physics & Astronomy and Center for Simulation Physics, The University of Georgia, Athens, GA 30602-2451, USA
Hamburger Sternwarte, Gojenbergsweg 112, 21029 Hamburg, Germany
Kyoto University, Yukawa Institute of Theoretical Physics, Kitashirakawa, Sakyo-ku, Kyoto 606-8502, Japan
1. Introduction
Pre-Cataclysmic Variables (pre-CVs) are objects consisting of a white dwarf and a late, low-mass main-sequence star. The distinguishing feature of these objects is that they have already undergone a phase of common-envelope (CE) evolution, and are sometimes also called post-common-envelope binaries (PCEBs).
Initially the binary separation is large, however the CE phase allows a large amount of angular momentum to be lost in the system, and the binary separation shrinks. Pre-CV or PCEB stars have not yet reached the evolutionary stage of significant mass-transfer due to Roche-lobe overflow when they would enter the cataclysmic-variable stage. Pre-CVs are therefore excellent objects for studying the initial evolutionary stages as observations are not confused by discs or hotspots.
EG UMa was initially identified as a DA white dwarf (Stephenson 1960) and later a binary companion with emission lines was discovered (Greenstein 1965). The following system parameters have been determined (see Bleach et al. 2000 for details and references): The primary is a cool white dwarf at around 13,000 K, with a mass of 0.64 M⊙ and a radius of 0.013 R⊙, while the secondary is an M4–5 dwarf with a mass of 0.42 M⊙ and a radius of 0.45 R⊙. The orbital period of the system is around 16 hours (Lanning 1982).
However, previous work has indicated that the M dwarf might have a larger radius and mass than that for a main-sequence star of similar spectral type (Bleach et al. 2000). We can use high-resolution spectroscopy to obtain estimates of the gravity in the M dwarf, which would give some insight into the mass and radius inconsistencies.
2. Observations
Echelle spectroscopy was taken with the Utrecht Echelle Spectrograph (UES) on the 4.2-metre William Herschel Telescope (WHT) during two nights in March 1998. A total of 13 spectra of EG UMa together with 9 normal M dwarf stars, ranging in spectral types between M0–6, were observed. Wavelength ranges from 4250 – 9000 Å covering, much of the red region where the red dwarf is dominant, and also included the Na I doublet at 8170–8220 Å and the Ca II triplet around 8540 Å.
The data were reduced using the echomop (Mills, Webb & Clayton 1997) and the figaro (Shortridge et al. 1999) packages. The blaze function was removed from the spectra by normalizing with a polynomial fit to the observed continuum (Bleach et al. 2002a). A spectral atlas of EG UMa has been produced and is discussed in Bleach et al. (2002b).
3. Synthetic Spectra
We have generated a grid of high-resolution (0.05Å steps) solar-composition synthetic spectra using phoenix code and the NextGen grid of model atmospheres (Hauschildt et al. 1999 and references therein), covering the range 2500–3900 K in steps of 100 K and the range 3.5–5.5 in steps of 0.5 dex. The synthetic spectra were rotationally broadened to match the observations: EG UMa has = 27.8 kms-1 (Bleach et al. 2002a), while the standards have values less than 3 kms-1.
4. Atmospheric Parameters of EG UMa
| Star | Sp. Type | ||
|---|---|---|---|
| EG UMa | M4.0–5.0 | 3300 100 | 5.5 0.5 |
| Gl 486 | M3.5–4.0 | 3400 100 | 5.0 0.5 |
| Gl 447 | M4.0–4.5 | 3300 100 | 5.0 0.5 |
| Gl 548A | M0.0–1.0 | 3900 100 | 4.5 1.0 |
| Gl 548B | M0.5–2.0 | 3900 100 | 4.5 1.0 |
| Gl 403 | M3.0–3.5 | 3350 50 | 5.0 0.5 |
| Gl 436 | M2.5–3.5 | 3400 100 | 5.0 0.5 |
| Gl 402 | M4.0–5.0 | 3300 100 | 5.0 0.5 |
| Gl 406 | M5.5–6.0 | 2700 200 | 5.0 0.5 |
| Gl 699 | M4.0–5.0 | 3200 100 | 5.0 0.5 |
To constrain the effective temperature and surface gravity of our programme stars, line-profile fitting to prominent lines in the spectra, namely K, Na I, Rb, TiO, Ti and Fe, was performed. Table 1 gives the best-fitting parameters obtained from the line-profiles for all objects in our programme. Overall the K, TiO, Ti and Fe lines gave consistent results, indicating that this multi-line methods appears to give reliable atmospheric parameters. For example, our parameters for Gl 406 agree very well with those obtained by Basri et al. (2000).
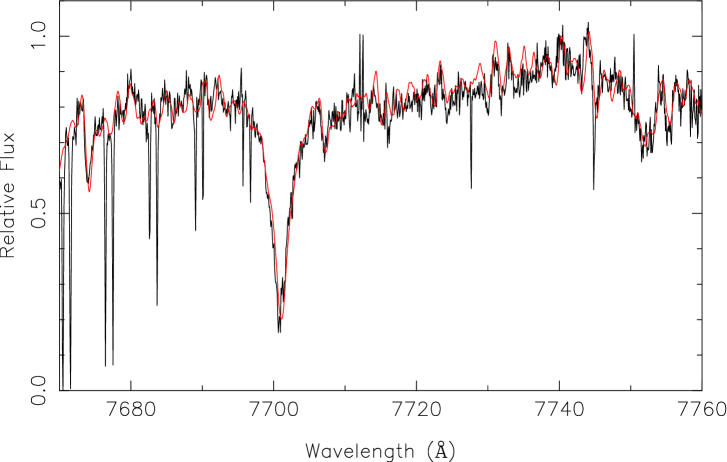
EG UMa is fitted more consistently by a higher surface gravity than normal dwarf M stars, as shown by the K (7699 Å) line in Fig. 1. Good fits to the core and wings are obtained, as well as to adjacent spectral features, by using the = 3300 K and = 5.5 solar-composition synthesis. The higher surface gravity indicates either a lower radius or larger mass (or both) than a main-sequence star of the same spectral type. This is somewhat at odds with the Bleach et al. (2000) conclusion that the radius is larger than a main-sequence star. The parameters given by Bleach et al. (2000) would indicate a value of , which is closer to the values found for the normal M dwarfs.
The equivalent widths of the Na I doublet (8170–8220Å) in EG UMa gives an associated spectral range of M4–5, which is in agreement with the previous work of Bleach et al. (2000). Inspection of Table 1 reveals that this spectral type is consistent with the obtained from the spectral fits.
Minor discrepancies do exist, however, between the synthetic spectra and the observations. The Na D lines (5896, 5890Å) and Ca II triplet (8498, 8542, 8662Å) are somewhat stronger in the syntheses. The line broadening for the strongest lines is not too well known. For example, using the Van der Waals broadening calculations based on the Anstee, Barklem and O’Mara (ABO) cross-section data give different line strengths (Barklem, Anstee & O’Mara 1998, Barklem & O’Mara 1998, Barklem, Piskunov & O’Mara 2000). In addition, possible non-LTE effects may also be important. Nevertheless, the overall fits to both EG UMa and the normal M stars are certainly very impressive. In EG UMa, however, the Na and Ca lines are affected by emission (Bleach et al. 2000, 2002b) and as such were not used in the determination of the atmospheric parameters.
Overall, the M star in EG UMa appears to be relatively normal and well fitted by a solar-composition synthetic spectrum. This indicates that the gross properties of the star might not be too far from that of a normal non-binary M dwarf. However, several spectral features revealed that EG UMa is not a totally normal star.
5. Yttrium oxide Bands
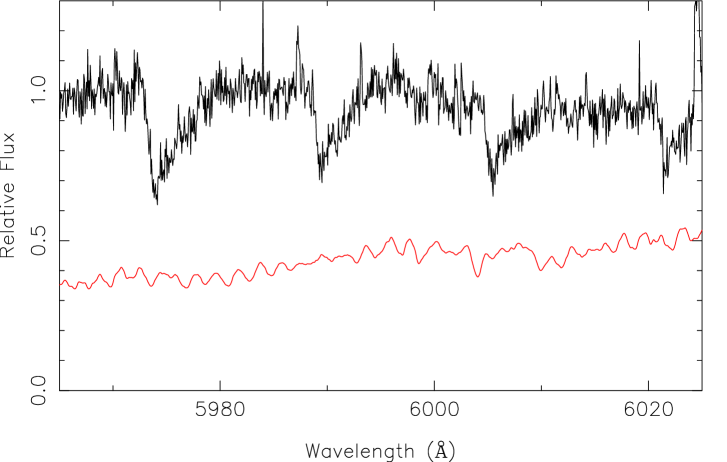
In EG UMa there are several prominent molecular bands which are not observed in the standard stars. These bands are present in both nights, and in adjacent orders, and follow the radial velocity shifts of the secondary star around the binary orbit, so they are believed to be real stellar features. They were found at 5972, 5988, 6004, 6020, and 6132 Å, and are due to Yttrium Oxide (YO) (Bernard et al. 1979, Bernard & Gravina 1983). The first four bands are shown in Fig. 2.
The discovery of YO bands in the spectrum of EG UMa was totally unexpected and potentially very significant. YO bands are usually only found in S and the latest M stars (Keenan 1966, Scalo 1974, Wyckoff & Clegg 1978, Ake 1979). EG UMa is not an S star because it displays intense TiO absorption. YO typically appears at much lower gravities due to changes in the chemistry from high to low pressures. Therefore, it is found in giants, but not usually in dwarfs.
Resolutions to this paradox are: star spots (EG UMa is an active star, Bleach et al. 2002b); a giant secondary; an extended atmosphere; or a distorted M dwarf with a low gravity region. Star spots are unlikely because the bandheads would show orbital phase variation, which is not observed. However, we cannot rule out the possibility that the stellar surface is inhomogeneous. The M dwarf cannot be a giant because log clearly is outside the range for giants, and also the star would have to remain well within its Roche lobe or it would become a cataclysmic variable. The system parameters indicate that EG UMa is not tidally distorted, and its gravity does not change by more than 0.02 dex from equator to pole (Maxted, private communication).
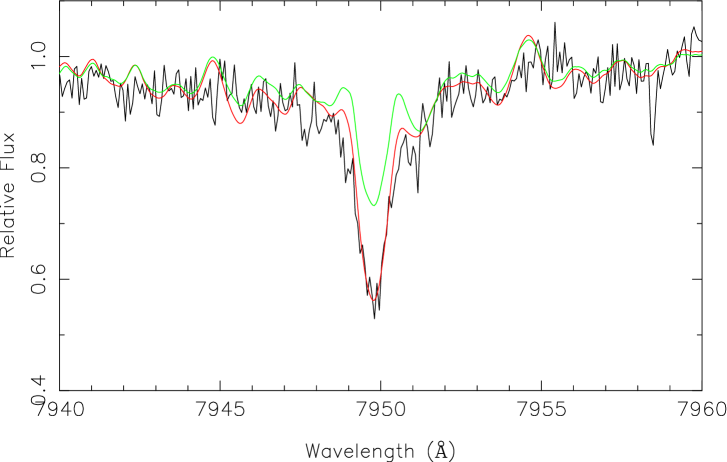
Alternatively, YO could represent an abundance enhancement of Y. This would be expected in a post-CE binary because Y, along with Ba, Sr and Rb, are all s-process elements, which could have been accreted during the CE stage. Support for this scenario is given by a strong Rb enhancement (Figure 3) and a possible enhancement of Sr. However, the Ba lines appear to be normal.
6. Conclusions
Line-profile fitting has been used to determine the atmospheric parameters of the secondary star in the EG UMa binary system. The best fitting solution gives a surface temperature of the M star as 3300 100 K and a surface gravity of = 5.5. This value of is slightly higher than the average for an early M dwarf. EG UMa is unique among the stars in the sample by displaying YO bands. These may be explained by an abundance enhancement of Y, which would be consistent with s-process enhancement from the common-envelope phase of the binary system’s evolution. Similarly, such enrichment has been inferred for Sr and Rb, but not for Ba. Further work is in progress to examine the anomalies in more detail.
References
Ake T.B., 1979, ApJ, 234, 538.
Barklem P.S., Anstee S.D, O’Mara B.J., 1998, PASA, 15, 336.
Barklem P.S., O’Mara B.J., 1998, MNRAS, 300, 863.
Barklem P.S., Piskunov N., O’Mara B.J., 2000, A&AS, 142, 467.
Basri G., Mohanty S., Allard R., Hauschildt P.H., Delfosse X., Martin E.L., Forveille T., Goldman B., 2000, ApJ, 538, 363.
Bernard A., Bacis R., Luc P., 1979, ApJ, 227, 338.
Bernard A., Gravina R., 1983, ApJS, 52, 443.
Bleach J.N., 2001, Ph.D. Thesis, University of Keele.
Bleach J.N., Wood J.H., Catalán M.S., Welsh W.F., Robinson E.L., Skidmore W., 2000, MNRAS, 312, 70.
Bleach J.N., Wood J.H., Smalley B., Catalán M.S., 2002a, MNRAS, (in press).
Bleach J.N., Wood J.H., Smalley B., Catalán M.S., 2002b, MNRAS, (in press).
Greenstein J.L., 1965, in First Conf. on Faint Blue Stars, Luyten W.J. (ed), University of Minnesota Press, p. 97.
Hauschildt P.H., Allard F., Baron E., 1999, ApJ, 512, 377.
Keenan P.C., 1966, IAU Symposium 24, Spectral Classification and Multicolor Photometry, Loden K., Lod’en L.O., Sinnerstad (eds.), Academic Press, New York, p. 26.
Lanning H.H., 1982, ApJ, 253, 752.
Mills D., Webb J., Clayton M., 1997, Starlink User Note 152.4.
Scalo J., 1974, ApJ, 194, 361.
Shortridge K., et al., 1999, Starlink User Note 86.17.
Stephenson C.B., 1960, PASP, 72, 387.
Wyckoff S., Clegg R.E.S., 1978, MNRAS, 184, 127.