Unified Cloudy Models of L and T Dwarfs – Physical Basis of the Spectral Classification in the Substellar Regime
Abstract
Based on a simple thermodynamical argument, we proposed a cloudy model with a warm dust cloud deep in the photosphere. We showed, for the first time, that a single grid of model photospheres ( K) offers a natural explanation not only for the division of dwarfs cooler than M into the two distinct types L and T but also for the changes of the spectra and colors along the L – T spectral sequence.
Institute of Astronomy, School of Science, The University of Tokyo
2-21-1 Osawa, Mitaka, Tokyo, 181-0015 Japan
1. Introduction
The new spectral type L is characterized by the red color possibly due to the dust extinction while type T by the volatile molecules such as methane and water. Initially, we considered a fully dusty model (model B) and a dust-segregated model (model C) for the L and T type dwarfs, respectively. However, it was difficult to explain why such different cases are realized in different types of cool dwarfs. Also, increasing observations on cool dwarfs could not be explained even by the use of these different kinds of models. We then showed that all these difficulties can be resolved by models with a warm dust cloud deep in the photosphere (Tsuji 2001), and we extended this idea to a grid of unified cloudy models (UCMs)(Tsuji 2002). In this contribution, we reexamine some observed data with our UCMs being updated with the use of the new solar carbon and oxygen abundances by Allende Prieto, Lambert, & Asplund (2001, 2002).
2. Unified Cloudy Models
In the photospheres of L and T dwarfs, dust forms at its condensation temperature () but grows too large to be sustained in the photosphere at the critical temperature (). For this reason, only small dust grains survive in the temperature range of . This means a formation of a dust cloud whose temperature is fixed at rather high (note that K) independently of . Since at , the dust cloud appears at the optically thin region () in L dwarfs whose ’s are relatively high and at the optically thick region () in T dwarfs whose ’s are lower. Then the dust will give direct observable effect in L dwarfs, which in fact appear to be dusty, but the dust cloud is situated too deep to give significant observable effect in T dwarfs. We then generated a grid of non-grey model photospheres in radiative-convective equilibrium under the presence of the dust cloud.
3. Observational Tests of the Unified Cloudy Models
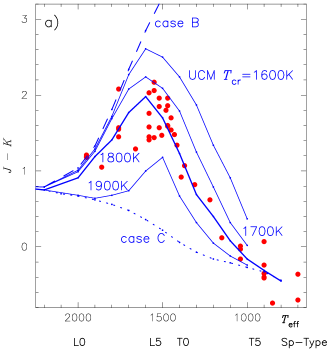
We first analyze infrared colors based on our models. As an example, observed values of (Leggett et al. 2002) plotted against spectral types (Geballe et al. 2002) and the predicted ones based on our cloudy models (UCMs) plotted against values are compared in Fig. 1a. The basic feature of the observed color, which is redder in the later spectral types at first but turns to blueward at about L5, can be well accounted for by our UCMs, but not at all by the fully dusty models B nor by the dust segregated models C. Further, the maximum value of at about L5 can be explained by our UCMs with K, and thus the critical temperature, , can be well constrained empirically.
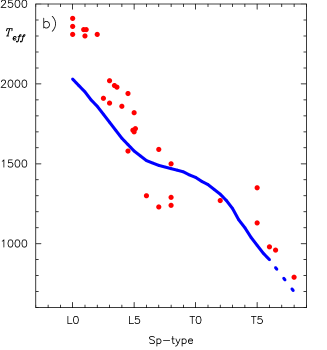
Next, effective temperatures can be estimated so that the best fit can be obtained between the observed and predicted colors, and Fig. 1a already shows the result of such a fit. The resulting - Sp. Type relationship is shown in Fig. 1b by the solid line (also Table 2 in Tsuji 2002). For comparison, empirical values based on the measured bolometric fluxes and parallaxes (assuming a fixed radius) by Burgasser (2002) are shown by the filled circles in Fig. 1b. The agreement is not so good especially in the early L dwarfs and further works should be needed before we could have a convincing scale.
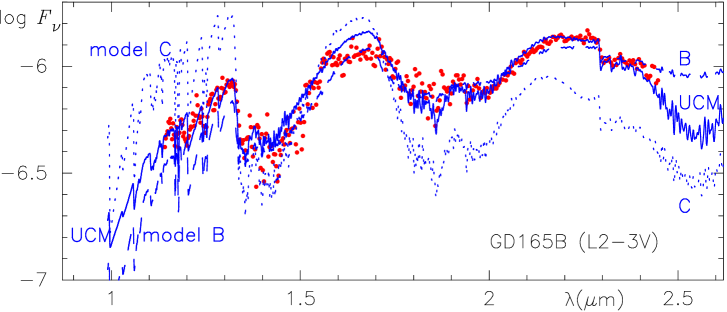
Once the infrared colors can be accounted for by our UCMs, the infrared spectra may in principle be accounted for as well. However, some details of the molecular spectra depend on the chemical composition besides , and no satisfactory interpretation was possible with the use of the solar abundances by Anders & Grevesse (1989) (see Fig.12 in Tsuji 2002). Thanks to the recent revisions not only of O but also of C abundances by Allende Prieto et al.(2001, 2002), however, the observed spectrum of the L dwarf prototype GD165B (Jones et al. 1994) can be reasonably fitted at last with the predicted one based on our UCM ( K) of K (from Fig. 1b for this L31 dwarf), but never be fitted with those based on the models B and C, as shown in Fig. 2.
4. Spectral Classification of L and T Dwarfs
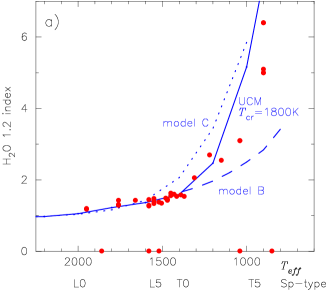
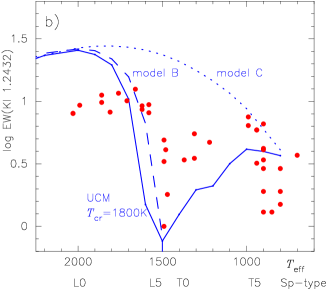
A unified spectral classification of L and T dwarfs by Geballe et al.(2002) is based on the H2O and CH4 indices derived from the near IR spectra. We compare one of them (H2O 1.2 m index) with the predicted ones from our model spectra in Fig. 3a. Also, observed EWs of K I 1.2432 m (Burgasser 2002) are compared with the predicted ones in Fig. 3b. The rather modest increase of H2O index in the L dwarf regime is due to the compensation of the increasing H2O abundance and the increasing dust extinction towards the later L dwarfs, in which the dust cloud is still in the optically thin photosphere. K I EWs show the minimum at about L5 because the dust column density of the cloud in the optically thin region is the largest at about L5 (or K). After the dust cloud penetrates into the optically thick region at K, the region above the cloud is dominated by the increasing amount of volatile molecules and mildly volatile atoms (e.g. K) towards the later T dwarfs. This explains the rapid increase of the H2O indices as well as the upturn of K I EWs in the T dwarf regime.
Thus, our UCMs will provide the physical basis for the spectral classification of L and T dwarfs. It is to be noted, however, that what matters in the L – T classification is the formation of the dust cloud at different optical depths (though at nearly fixed temperature near ) rather than the amount of dust predicted by the thermochemical theory. This shows a marked contrast to the classical spectral types O – M, which are directly related to the amount of ions, atoms, and molecules predicted by the ionization and dissociation theory.
5. Concluding Remarks
We showed that the observed spectra and colors of L and T dwarfs can be accounted for consistently with our UCMs. On the other hand, our previous models such as the fully dusty models B and the fully dust-depleted models C (and, by implication, more or less similar models by other authors) are far too short to explain the observed colors (Fig.1a), spectra (Fig.2) and spectral indices (Fig.3) of cool dwarfs, especially from middle L to early T. Thus the presence of the dust cloud deep in the photosphere should be an essential feature of L and T dwarfs, as also noted by Marley et al.(2002) from a different approach based on the planetary theory. We followed stellar approach throughout and pursued a simple model as far as possible, but it is clear that this is only an initial step towards understanding the complicated phenomena in ultracool dwarfs.
References
Allende Prieto, C., Lambert, D. L. & Asplund, M. 2001, ApJ, 556, L63
Allende Prieto, C., Lambert, D. L. & Asplund, M. 2002, ApJ, 573, L137
Anders, E., & Grevesse, N. 1989, Geochim. Cosmochim. Acta, 53, 197
Burgasser, A. J. 2002, Ph. D. thesis, California Institute of Technology
Geballe, T., et al. 2002, ApJ, 564,466
Jones, H. R. A., Longmore, A. J., Jameson, R. F., & Mountain, C. M. 1994, MNRAS, 267, 413
Leggett, S. K., et al. 2002, ApJ, 564, 452
Marley, M. S., et al. 2002, ApJ, 568, 335
Tsuji, T. 2001, in Ultracool Dwarfs - New Spectral Types L and T, ed. H. R. A. Jones & I. A. Steele (Berlin: Springer-Verlag), 9
Tsuji, T. 2002, ApJ, 575, 264