The peculiar cooling flow cluster RX J0820.9+0752
Abstract
We present observations of the cluster of galaxies associated with the X-ray source RX J0820.9+0752 and its dramatic central cluster galaxy in the optical and X-ray wavebands. Unlike other cooling flow central cluster galaxies studied in detail, this system does not contain a powerful radio source at its core, and so provides us with an important example where we expect to see only the processes directly due to the cooling flow itself. A 9.4 ks Chandra observation shows that the hot intracluster gas is cooling within a radius of 20 kpc at a rate of a few tens of solar masses per year. The temperature profile is typical of a cooling flow cluster and drops to below 1.8 keV in the core. Optical images taken with the AAT and HST show that the central galaxy is embedded in a luminous (L), extended line-emitting nebula that coincides spatially with a bright excess of X-ray emission, and separate, off-nucleus clumps of blue continuum that form part of a patchy structure arcing away from the main galaxy. The X-ray/H feature is reminiscent of the 40 kpc long filament observed in A 1795 which is suggested to be a cooling wake, produced by the motion of the central cluster galaxy through the intracluster medium. We present optical spectra of the central cluster galaxy and its surroundings, and find that the continuum blobs show stronger line emission, differing kinematic properties and more extreme ionization ratios than the surrounding nebula. Accounting for the strong intrinsic reddening and its significant variation over the extent of the line emitting region, we have fit the continuum spectra of the blobs and the nucleus using empirical stellar spectra from a library. We found that continuum emission from early main sequence stars can account for the blue excess light in the blobs. Kinematical properties associate the gas in the system with a nearby secondary galaxy, suggesting some kind of tidal interaction between the two. We suggest that the secondary galaxy has moved through the cooling wake produced by the central cluster galaxy, dragging some of the gas out of the wake and triggering the starbursts found in the blobs.
keywords:
galaxies: cooling flows – galaxies: clusters: individual: RX J0820.9+0752 – galaxies: peculiar – galaxies: starburst – X-rays: galaxies: clusters1 Introduction
The hot intracluster medium in the cores of many clusters of galaxies emits so much energy in the X-ray band that the cooling time is substantially shorter than the cluster age. The resulting decrease in gas pressure leads to a highly subsonic inflow of material towards the cluster centre – a cooling flow (Fabian 1994). Recent X-ray spectra from XMM-Newton have confirmed the short central cooling times and low central cluster temperatures required by a cooling flow, but show a surprising deficit of spectral lines from gas cooling below keV (Peterson et al. 2001; Kaastra et al. 2001). The rates of cooling (or ‘mass deposition rate’) thus appear to be reduced from those deduced from earlier X-ray missions, and in the ‘classical’ ( i.e. pre-XMM-Newton and Chandra) picture of cooling flows. It is possible that the age of the cooling flow can be substantially reduced to around a few Gyr, for example if the intracluster medium is stirred up by infall of subclusters (Allen, Ettori & Fabian 2001a). The current data are only consistent with the previously-deduced high mass deposition rates if excess intrinsic absorption is introduced to selectively remove the emission below 1 keV (David et al. 2001; Schmidt, Allen & Fabian 2001; Ettori et al. 2001).
Alternatively, a possible sink for the ‘missing’ soft X-ray luminosity expected from steady cooling flows could be the luminous (and excess) line emission seen in the ultraviolet/optical waveband (Heckman et al. 1989; Crawford et al. 1999), and dust emission in the sub-mm/far-infrared (Edge et al. 1999; Allen et al. 2001c) seen associated with many central cluster galaxies in cooling flows. In a cold mixing model, the gas below keV drops from the flow to be rapidly cooled by being churned with embedded cold gas clouds, and then the ‘missing’ energy is re-emitted at longer wavelengths (Fabian et al. 2002).
Another explanation for the observed properties has recently been put foward by Voigt et al. (2002). They suggest that cooling can be balanced by heat conduction along the temperature gradient in the outer parts of a cluster with only a small cooling flow operating at the centre ( kpc), thereby reducing the mass deposition rates to values consistent with observations.
Most cooling flow models imply some correspondence in both the spatial and luminous properties of the cooling gas seen in X-rays and the emission seen in the lower-energy wavebands – perhaps such as the X-ray/H filament extending from the central cluster galaxy in the A1795 cluster (Fabian et al. 2001a; Crawford et al. 2002 in preparation), or the associated X-ray/emission-line regions seen in objects such as A2199 (Johnstone et al. 2002), Virgo (Young, Wilson & Mundell 2002), or A2390 (Allen et al. 2001a). These line-luminous central cluster galaxies, however, are also sites for extended regions of massive star formation that are presumed to be a final sink for material cooling from the intracluster medium (e.g. Crawford & Fabian 1993). Ionization from these stars may also be a large contribution to powering the emission-line nebulae.
A further heat source which could balance radiative cooling in a cluster is a central radio source. Most central cluster galaxies have a radio source with jets supplying energy into the surrounding gas, often blowing bubbles of relativistic plasma (e.g. McNamara et al. 2000; Fabian et al. 2000). At issue here is whether these bubbles lead to local heating of the intracluster medium (Churazov et al. 2002; Churazov et al. 2001; Brüggen & Kaiser 2001; Reynolds, Heinz & Begelman 2002) or buoyantly rise and transport the energy to large radii (Fabian et al. 2002). It is also possible that cooling is balanced by a combination of heating by the radio source and conduction (Ruszkowski & Begelman 2002). In this paper we present a central cluster galaxy which has a particularly weak central radio source. (Of course such sources may go through cycles of activity and our object may just be in a low state.) It also appears to have a strong correspondence between its cooling X-ray emission and its properties at optical wavelengths. The galaxy is at the centre of the cluster associated with the ROSAT X-ray source RX J0820.9+0752111For convenience, we shall use ‘RX J0821’ throughout the rest of this paper to refer to the central galaxy and its associated line-emitting nebula., the coordinates of the nucleus of the CCG being :21:02.28, :51:46.8 (J2000). The cluster was discovered as part of the extended Brightest Cluster Sample (Ebeling et al. 2000), and optical spectroscopy on the central galaxy yielded a redshift of 0.110 (Crawford et al. 1995). It has a ROSAT keV (rest frame) luminosity of L222We assume a cosmology with a Hubble constant of and a cosmological deceleration parameter of throughout this paper., and an estimated temperature of 4.4 keV. The spectrum of the central cluster galaxy showed it to have strong H+[NII] emission lines (a slit H luminosity of around ) but with a lack of H that implied large amounts of intrinsic obscuration to be present in this system (Crawford et al. 1995).
RX J0820.9+0752 is a strong CO emitter (Edge 2001) with an implied molecular gas mass of 3.9 M⊙ and offset in velocity from the main galaxy by about . The CO emission is centred on the central galaxy but extended to the W by about 5 arcsec (Edge & Frayer 2002 in prep.). RX J0820.9+0752 is also detected by IRAS at 60m (Edge 2001) implying a dust mass of 2.2 M⊙ for a dust temperature of 40 K. A near-infrared spectrum revealed Pa extended over 2.4 arcsec to the north of the central galaxy, but there was no significant detection of any 1-0 S series H2 line emission, despite the strong CO detection (Edge et al. 2002).
2 Chandra X-ray observation
The Chandra observation of RX J0820.9+0752 was carried out on 2000 October 6, using the Advanced CCD Imaging Spectrometer (ACIS). The target was observed in the back-illuminated S3 detector and positioned near the centre of node-1 on CCD 7. The net exposure time was 9.4 ks and the focal plane temperature at the time of the observations was C. We used the CIAO software and the level-2 events files provided by the standard Chandra pipeline processing for our analysis. Only those X-ray events with grade classifications of 0, 2, 3, 4 and 6 were used.
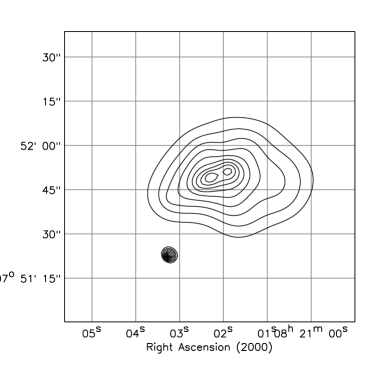
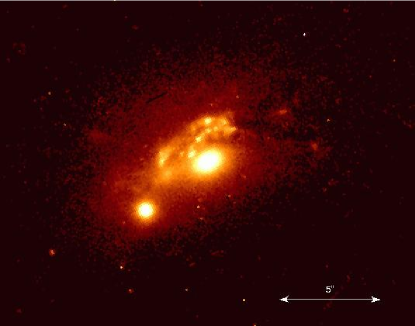
An immediate inspection of the Chandra image (Figures 1 and 4) shows that the cluster emission appears extended: the bulk of the emission is centred on the position of the central cluster galaxy, but there is a strong bright extension over 8 arcsec towards the NW ( kpc; 1 arcsec corresponds to a distance of 2.7 kpc at the redshift of RX J0820.9+0752). The 0.5-7 keV luminosity of the cluster emission is , with a bolometric luminosity of .
We also extracted separate spectra from two circular regions of 5 arcsec radius – one centred on the central galaxy, and a second offset to the NW over the bulk of the extended emission. There were too few photons in each spectrum to do precise modelling, but we found upper limits to the intrinsic absorption column density of a few by 1021.
2.1 Spectral analysis
Spectra were extracted from two circular annuli, centred on the X-ray peak (at :21:02.4, :51:48; J2000), and spanning radii of kpc (18.7 arcsec) and kpc (75.3 arcsec), respectively. The emission from point sources was masked and excluded. The spectra were grouped before fitting to contain a minimum of 20 counts per pulse invariant channel, allowing statistics to be used. A background spectrum was extracted from a source-free region of node-3 on the S3 chip. For the kpc annulus, data covering the keV energy range were used. For the kpc annulus, for which the background is more significant, our analysis was limited to the keV band. Separate photon-weighted response matrices and effective area files were constructed for each region using the 2001 August release of the ACIS-S calibration and response files.
The spectra have been analysed using the XSPEC code (version 11.01; Arnaud 1996) and MEKAL plasma emission models of Kaastra & Mewe (1993; incorporating the Fe L calculations of Liedhal, Osterheld & Goldstein 1995). We have fit the spectra using a single-temperature model, with a temperature (), metallicity (; measured relative to the solar photospheric values of Anders & Grevesse 1989, with the various elements assumed to be present in their solar ratios) and absorbed by a column density () of cold gas (Balucinska-Church & McCammon 1992). The results of the fits are summarized in Table 1. The (projected) temperature rises from a value of keV within the central 50 kpc radius, to a value of keV between radii of kpc. This type of temperature profile is typical of cooling flow clusters (e.g. Allen, Schmidt & Fabian 2001b).
| Model A | /DOF | |||
|---|---|---|---|---|
| kpc | 44.1/50 | |||
| kpc | 104/100 |
2.2 Cooling in the cluster core
The azimuthally-averaged, keV X-ray surface brightness profile for RX J0820.9+0752 is shown in Figure 2. The profile has been flat-fielded and background subtracted. The bin-size is 2 detector pixels (0.984 arcsec).
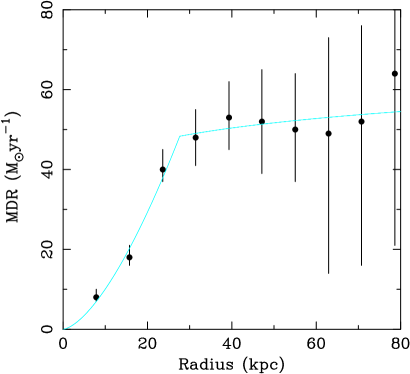
We have carried out a deprojection analysis of the cluster, using the observed temperature profile to constrain the analysis, as described by e.g. Allen et al. (2001a). The inferred electron density, cooling time and equivalent mass deposition rate (which parametrizes the luminosity distribution in the cluster core, under the assumption that the gas there is in a steady state cooling flow; e.g. White, Jones & Forman 1997) are shown in Figure 3. When accounting for projection effects, the temperature in the central 50 kpc region drops to keV. The cooling time of the cluster gas is yr within the central 20 kpc; the mass deposition rate within this radius is (assuming that the gas there is in a steady state cooling flow).
A cooling flow component (Johnstone et al. 1992) added to the model for the spectrum of the X-ray flux from within 50 kpc gives an improved fit over the single MEKAL model (). The mass cooling rate obtained is , the metallicity , and intrinsic absorption . The upper temperature of the cooling flow component (and temperature of the additional MEKAL component) is . Whether there is excess intrinsic absorption or not depends on the uncertain soft X-ray response of ACIS-S (the data were fit only above 0.7 keV); drops to about if .


3 Radio observations
RX J0821 is a relatively unusual central cluster galaxy in the radio. From a complete VLA snapshot campaign at 5 GHz (Edge et al., in preparation), RX J0821 is the weakest of all the BCS central cluster galaxies with detected optical line emission. The flux density of 0.73 mJy at 4.89 GHz coupled to the 2.260.14 mJy at 1.4 GHz in the First Survey (Becker et al. 1995) give a canonical spectral index () and low radio power ( WHz-1 at 1.4 GHz).
The radio source shows no discernible structure on the arcsec scale (our 5 GHz C-array and the First Survey data have comparable resolution), although it lies to the NW (:21:02.2, :51:48.78) of the core of the dominant galaxy. More detailed VLA imaging is required to identify whether the radio emission is directly related to the off nuclear features. (It coincides with HSB defined in Sec. 6.1.)
As an aside the most striking feature in the radio maps is a strong head-tail galaxy 30 arcsec to the south-west of the cluster core. The head of the radio emission is coincident with a moderately bright elliptical galaxy in the HST image and therefore this is very probably a cluster member. The tail of the radio emission extends to 35 arcsec in length and has a position angle approximately 35 degrees from the dust plume to the west of the central galaxy. This head-tail source is suggestive of a galaxy falling into the cluster from a western direction.
If the radio emission was only due to star formation, this would imply an (using the relation of Yun, Reddy & Condon 2001, corrected for the differing ), which is in good agreement with the X-ray results.
4 TTF observations
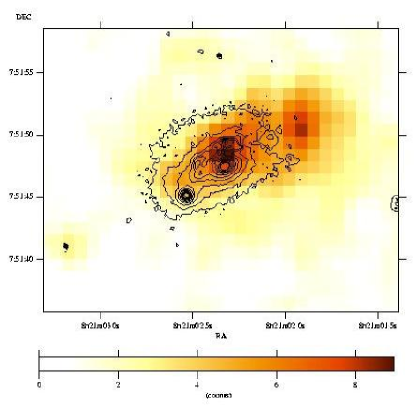
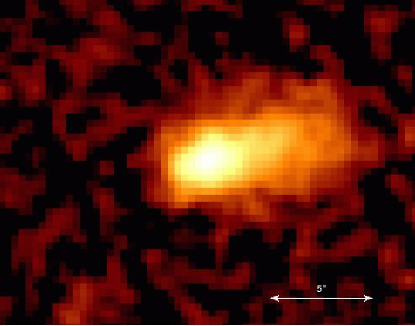
RX J0821 was observed on 2000 April 15 using the Taurus tunable filter (TTF; Bland-Hawthorn & Jones 1998) on the Anglo-Australian telescope. The TTF was tuned to a bandwidth of 30 Å, and a total exposure of 1800 s was taken through a band centred at 7291 Å to encompass redshifted H (with a small degree of contamination of [NII]). In order to estimate the continuum level at H, two neighbouring bands at 7258 Å and 7383 Å were also observed in ‘straddle shuffle’ mode, again for a total exposure of 1800s. The resulting continuum-subtracted H image (Figure 4) clearly shows that the H emission forms an extended nebula stretching over arcsec (19 kpc) to the NW.
5 Hubble Space Telescope observation
A Hubble Space Telescope (HST) WFPC2 image of RX J0821 was taken on 2000 February 12 for an exposure time of s, using the F606W filter. The two images were combined using the standard IRAF STSDAS routines to remove cosmic rays and were then filtered for hot and cold pixels. The F606W filter corresponds to wide , covering a wavelength range of Å in the restframe of the object so does not include [NII]+H. The WFPC image is shown in Figure 4.
The primary feature in the HST image is the central galaxy and its smaller companion arcsec to the SE. Two very bright lines of clumped emission arc from the NW over to the E, with several other isolated blobs also apparent scattered further out to the NW and E. The whole system is embedded in diffuse emission, although with a sharp ‘bite’ dimming this extended halo starting just beyond 3 arcseconds to the NW.
6 Optical spectra
6.1 Observations and data reduction
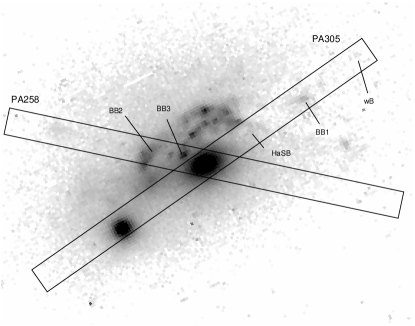
Optical spectra of RX J0821 were taken on 2000 January 3 using the 4.2 m William Herschel Telescope (WHT) of the Roque de los Muchachos Observatory. The Intermediate dispersion Spectroscopic and Imaging System (ISIS) was used to observe the object at position angles of 305∘and 258∘(henceforth PA305 and PA258 respectively; see Figure 5), using both the red and blue arms of the instrument. The 5400 Å dichroic was used to split the data, which unfortunately starts diminishing the continuum light noticeably beyond about 4600 Å in the rest frame of the system. The R158B grating was used on the blue arm, with the EEV12 chip as the detector to give a dispersion of 1.62 Å/pix centred at about 4145 Å. Similarly, using the R158R grating with the TEK4 CCD on the red arm gave a dispersion of 2.9 Å/pix centred at 6343 Å. The spatial dispersion of the data on the blue and red arms was 0.2 arcsec/pix and 0.36 arcsec/pix respectively. A one arcsecond slit was used throughout all the observations, to match the seeing conditions of arcsec. The individual exposure times were generally 1800 seconds, combining to give a total exposure time of 11,300 seconds and 10,800 seconds for the red and blue arm at PA305 respectively, and 1800 seconds each at PA258. The airmass varied between approximately 1.1 and 1.3 during the observations.
Basic reduction of the data was performed using standard IRAF procedures: bias level subtraction, cosmic ray removal and flat-fielding. The spectra were straightened to correct for any spatial dispersion due to atmospheric refraction and co-added (where appropriate) to produce a final image for each position angle and arm. Each co-added image was then wavelength-calibrated and sky-subtraction was performed by producing a sky frame from averaged cross sections well off the actual galaxy from each spectrum. Flux calibration was carried out using observations of two standard stars, taken during the same night as the object spectra, with the same wavelength coverage and instrumental setup. The flux calibration between the two arms of ISIS looks convincing and gives a consistent response function. The accuracy of the calibration is also reinforced by the perfect match of the nuclear spectrum between the R and B arms. Corrections for atmospheric extinction and Galactic reddening were applied. Appropriate hydrogen columns derived from the data of Stark et al. (1992) were used to calculate the amount of Galactic reddening as E(B-V) using the formula of Bohlin, Savage & Drake (1978). The spectra were de-redshifted using (Crawford et al. 1995), and finally the data were binned spatially to improve the signal-to-noise and to obtain a spectrum of specific regions with distinct spectral properties. Note that due to the longer exposure time, the signal-to-noise in PA305 is significantly better than that in PA258.
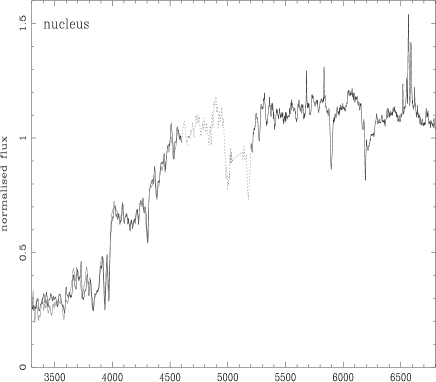
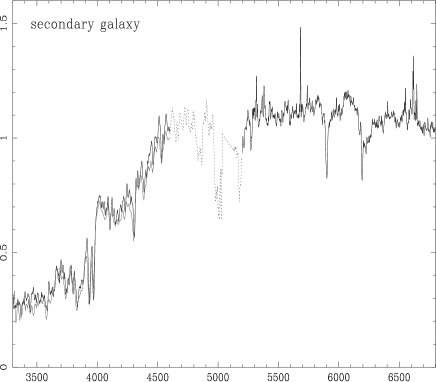
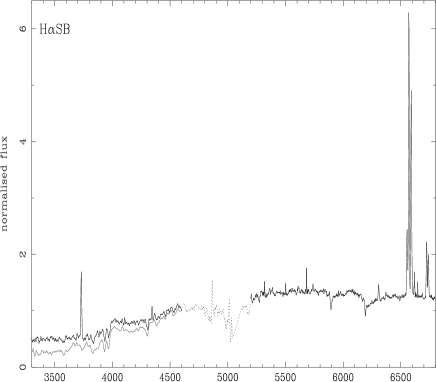
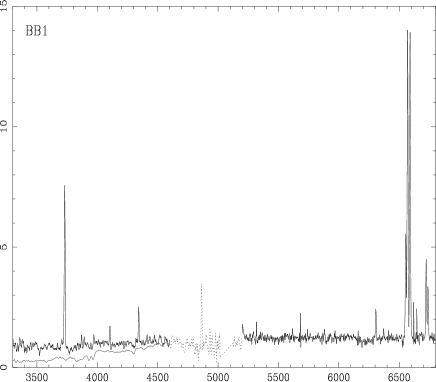
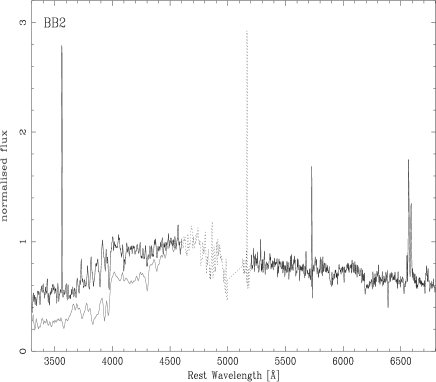
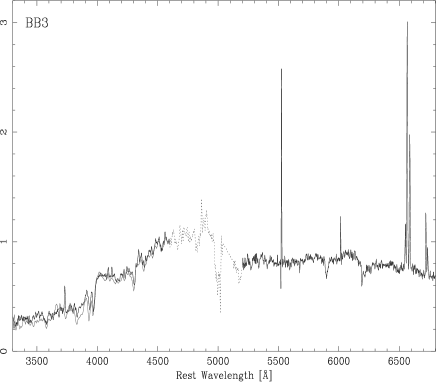
The secondary galaxy lying 4 arcsec to the SE of the central cluster galaxy is included in the PA305 observation, and has a spectrum typical of an elliptical galaxy, lacking any significant line emission (Figure 6). The continuum features show it to be marginally redshifted with respect to the central cluster galaxy (; see Sec. 8). PA305 also covers a bright isolated blob of light seen in the HST image to lie just inside the dark ‘bite’ in the faint diffuse emission, 4.5 arcsec to the NW of the central galaxy (this is hereafter denoted as ‘BB1’). PA258 samples two much brighter clumps of light (hereafter ‘BB2’ and ‘BB3’) that are representative of those forming the two arcing lines crossing over to the North of the galaxy as seen in the HST image. Finally, we also isolate a region (denoted ‘HSB’ hereafter) in PA305 that is located within the brightest part of the extended H emission nebula. Apart from its high H luminosity, the spectrum of this region is not very different to those of the other blue regions. There is only a very weak counterpart to HSB in the HST image. Figure 6 shows the combined red and blue arm spectrum of each of these regions, as well as those of the central and secondary galaxies. The dashed line represents the blue half of the spectrum of a template central cluster galaxy (see Sec. 6.3) scaled to match the spectrum in the region around 4500 Å, illustrating the excess of blue continuum light present in at least three of the blobs (see also Fig. 12).
6.2 Emission lines
The emission lines were fit in QDP (Tennant 1991) using composite Gaussian models for the lines and a linear function to represent the continuum. [OI] Å, [NII] Å, [SII] Å, and the H line were fit as a set of 7 Gaussians fixed to have the same redshift and velocity width as each other (and the flux of [NII] Å was fixed to 1/3 the value of [NII] Å). Fitting the bluer emission lines was more problematic as they are almost completely extinguished, presumably by the reddening caused by large amounts of intrinsic dust in parts of this system. H was fit as an individual Gaussian, with its velocity width fixed to the same value as measured for the H emission from that spatial region. However, we had to allow for the possibility that underlying stellar absorption had also contributed to this extinction, especially if young stars might be present in significant quantity.
As a first approximation, we simply represented any stellar absorption feature by including an underlying Gaussian absorption component into the fit where a significant continuum level was present whose properties (i.e. width) were matched from the Ca H & K lines. This enabled us to attempt a conservative estimate for the amount of intrinsic absorption to be corrected for in each spectrum. The fit to H is further complicated, as due to the redshift of RX J0821, it lies in a region where the signal is beginning to be affected by the dichroic used to split the light between the two arms of ISIS. Where no Balmer lines other than H could be detected, a upper limit for H was derived.
H is detectable in our slit spectra out to a distance of 9 arcsec ( kpc) to the NW of the nucleus in slit PA305 with a total luminosity of about . Assuming an average intrinsic reddening of E(B-V) (as determined from the Balmer decrement; see Sec. 6.2.1) over the whole slit, the corrected total H slit luminosity is about . Our slit encompasses a maximum of app. 25% of the total H flux in the TTF image, so we estimate that the total H luminosity is at least as high as . We note that the object’s L(H)/LX ratio, although not quite anomalous, is certainly very high as compared to the other BCS objects. Of all the objects with comparable LX, only one (Zw 8193) has a similar H luminosity.
The regions BB3 and HSB show particularly strong H emission, whereas BB1 and BB2 are not conspicuous (Fig. 7, central panels). However, before the correction for internal extinction is applied (see next section), a distinct peak in H emission at the position of BB1 is apparent. Given the large error on the derivation of E(B-V) here, this peak in H could have been lost (see measurements before de-reddening in Fig. 7, centre panels). BB2, however, seems to be intrinsically H-weak, which agrees with the fact that other spectral properties differ between BB1 and BB2. The extremely high value for the H luminosity from BB3 is due to the very high E(B-V) at this position; this is the one bin at this PA where the reddening determination seems to be fairly secure.
Finally, there is a weak maximum in H along slit PA305 approximately 7 arcsec to the NW, which we termed the ‘Weak Blob’ (wB) as it is not apparent on the HST image. Its H luminosity and ionization properties (see Sec 6.2.2) suggest that it might be another candidate blue blob.
6.2.1 Intrinsic extinction
The previous spectrum of RX J0821 (Crawford et al. 1995) had already suggested a very high amount of intrinsic reddening to be present, and our WHT data immediately confirm the importance of dust in this object. We compared our measured Balmer decrements to values predicted by Case B recombination, to derive a value for E(B-V) for each of our spatial bins, as the dust is most likely not distributed in a uniform screen. An additional independent determination of E(B-V) was performed using the H/H ratio in those spectral bins where a stronger Balmer series was visible.
Not surprisingly, given the patchy structure visible in the HST image, the amount of reddening varies considerably along the slit. In the upper panels of Fig. 7, the inferred E(B-V) is mapped as a function of radial distance from the central galaxy at each slit position angle. These values of E(B-V) are either weighted means of all available measurements, or, where only H was visible, lower limits. The errors shown on E(B-V) are propagated from the errors ( confidence interval) to the fits of the Balmer emission line fluxes in QDP. In PA305 reddening is unimportant around the nuclear region, with a steep rise to the NW, peaking around the position of the HSB, consistent with the edge of the dark ‘bite’ seen in the HST image. The E(B-V) then decreases continually further to the NW, with the blue blob BB1 perhaps located at a local minimum (though this dip is probably not significant).
In PA258 a very high value for E(B-V) in the nucleus suggests that either this slit position is not centred on the same bit of the main galaxy as the PA305, or that there is a comparative loss of blue light due to atmospheric refraction (and thus the amount of H is underestimated relative to H and the reddening inferred is overestimated). The parallactic angle at the time of the observations was about 309∘, so we expect that only PA258 could possibly be affected by this. There is evidence that reddening is insignificant in the nucleus (see Sec 6.3.3), so we assume the E(B-V) derived for this region in PA258 to be an upper limit. Similarly, although the data suggest that BB3 seems to be associated with a region of intrinsically very high reddening, the large errors on this derivation and the possibility of a slight comparative loss of blue light at PA258 suggest we should employ caution and use this value of E(B-V) only as an upper limit.
The average value of E(B-V) for the whole object as determined from a sum of all the available hydrogen Balmer light was found to be . This value agrees within the error bars with that given in Crawford et al. (1999; E(B-V)).


6.2.2 Ionization
Whilst the high levels of intrinsic dust extinction strongly limit our ability to measure the properties of the blue emission lines (such as [OII], H+[OIII]), the strength of the red emission lines means that these lines can be fit with some precision. We fit and measure the red diagnostic line intensity ratios [NII]6584/H, [SII]6717/H and [OI]6300/H, which are relatively unaffected by the local variations in reddening. Marked changes in ionization across RX J0821 are obvious (Fig. 8).
At the location of the blobs, the ionizational behaviour deviates from the general trend, in that they show more extreme values in ionization-sensitive ratios than their immediate environments (Fig. 7, lower panels). All blue blobs (including the Weak Blob wB; but with the possible exception of BB2) are characterised by a clear local minimum of the [NII]/H (and also the [SII]/H and [OI]/H ratios).
There is also a clear correlation between the H flux and [NII]/H, such that stronger H is associated with a lower value of [NII]/H; i.e. regions where photoionization is more important (lower [NII]/H) are stronger H emitters (Fig. 9). PA258 confirms the trend found in PA305, but is not included in Fig. 9 due to its lower S/N. The exception to this correlation (for both slit position angles) is the region around the galaxy nucleus. Interestingly, this correlation matches the general trend found from object to object in the BCS (Crawford et al. 1999, fig. 7).


6.2.3 Kinematics
The QDP fits to the emission lines enable us to measure any velocity shifts of the emission line nebula, as well as variations in line width across the system. The upper panels in Fig. 10 show the radial velocity (relative to the nuclear bin) of the H as a function of radius for both slit position angles. The values measured from PA305 show a sharp initial increase in from SE to NW of around over a distance of only 2 arcsec (5.5 kpc), which then levels off to small variation around +100. To this NW section at least two kinematically distinct regions can be distinguished: one local minimum of at about arcsec, another one at around arcsec. These locations coincide well with positions in between HSB and BB1, and BB1 and wB, respectively, and are associated with local maxima of [NII]/H. As a corollary, these blobs themselves are associated with the higher values of . The worse S/N in the PA258 slit means that it is difficult to draw any firm conclusions about the relative kinematics of BB3 and BB2: BB3 may be also associated with a local extremum of , but the lack of further line emission ENE along the slit makes this difficult to assess.
The asterisks in Fig. 10 mark the values of derived from the Ca H & K absorption lines to check for any kinematic difference between the stellar and gaseous components. The stellar component associated with the HSB is blueshifted relative to the nucleus by about the same amount the H emission is redshifted. Due to the weakness of the Ca H & K lines in BB1, the error bars here are very large and the result has not been included in the plot. However, the result of is at least consistent with a similarly strong velocity offset as HSB, confirming some degree of independence between the gas and stars NW of the galaxy. A similar but less significant kinematic separation is observed in BB3, and there might also be an even smaller velocity offset in BB2, although the velocities here are still consistent with each other within the error bars. Measurements of using [OII] Å rather than H confirm this qualitative picture. We note that this can be interpreted both in terms of a spatial, as well as purely kinematical separation.


The lower panels of Fig. 10 show the linewidth measured from H (corrected for instrumental resolution) as a function of radius for both position angles. The discrepancy of the nuclear FWHM for the two different slit orientations could be another indication that the slit was not centred on exactly the same position during the two observations (see Sec. 6.2.1). The blobs seem to be associated with regions of systematically smaller linewidth, although again the lower S/N in PA258 renders it more difficult to judge the kinematic behaviour around BB2 and BB3. Even so, there is a very low upper limit at BB3 that could indicate a real drop, and it appears that again BB2 is different from the other blobs, having a larger FWHM. The nucleus is generally associated with high values of FWHM. There is also a strong correlation between the FWHM and [NII]/H to the NW of the galaxy (Fig. 11), in that the regions showing higher [NII]/H have broader lines. As in Fig. 9 the nucleus and its immediate environment do not conform to this trend.

6.3 The continuum
The nuclear spectra of the main and secondary galaxies extracted from PA305 are well fit by an average spectrum formed from the spectra of 24 central cluster galaxies without line emission or excess blue light (from Crawford et al. 1999; Figure 6). All of the four other regions, however, are characterised by their blue continuum in comparison to either the main galaxy nucleus or the template central cluster galaxy spectrum (and hence their nomenclature ‘blue blobs’). The blue excess is somewhat less noticable in BB3, with a spectrum that is close in shape to that of the nucleus of the central galaxy. Note however that due to being so close to the bright galaxy core ( arcsec), BB3 clearly is not fully resolved, and it is very likely that its spectrum is diluted by the spectrum of the nucleus itself (and vice versa), and the blue excess here could be attenuated. Further support for this is provided in Sec 6.3.3.
Closer inspection of the spectrum of BB2 (Fig. 12) shows that it has a clear Balmer absorption sequence (extending beyond H) immediately suggesting a strong, relatively undiluted population of A/F stars.
This blue excess is apparent in the spectra as observed (Fig. 6) but becomes more so after correction for intrinsic reddening is made (Fig. 12). The values of E(B-V) adopted for HSB, BB1, BB3, and BB2 are 0.70, 0.30, 0.00, and 0.01 respectively. Due to the low S/N ratio in PA258, it was difficult to derive a sensible value for E(B-V) for BB3. Hence we use an assumption of E(B-V) rather than 0.73 (the value suggested by the Balmer decrement) as a conservative minimum estimate, meaning that the real blue excess might be significantly higher.
In order to estimate the dominant stellar populations responsible for the excess light, we carried out an empirical stellar spectral synthesis, similar to that described in Allen (1995) or Crawford et al. (1999).
6.3.1 The tools
We fit the spectra from the different spatial regions of RX J0821 by combinations of main sequence dwarf and giant stars, as well as the featureless central cluster galaxy template. We aimed to reproduce both certain spectral features and the general spectral slope. We made use of the ‘specfit’ package in IRAF (Kriss 1994). This software allows one to fit spectra with a range of pre-defined models as well as user-defined ones, that can be fed into specfit in the form of an ASCII table. The algorithm fits the user spectra to the input spectrum with the normalization and – if required – the redshift as free parameters. As it is principally the blue light that we wish to fit, and which contains the most strongly discriminating stellar spectral features, we fit models to the blue-arm ISIS spectra only, over a wavelength range of about Å.
6.3.2 The models
The template spectra used in ‘specfit’ were taken from Pickles’ extensive stellar spectral flux library (Pickles 1998), and the template central cluster galaxy spectrum constructed from 24 featureless central cluster galaxies (Crawford et al. 1999). We have confidence in the validity of this template, as it only requires a simple normalization to be a good fit to the nuclear spectrum of RX J0821 – where our Balmer line ratios indicate no intrinsic reddening to be present. The fit is very good, confirming that the centre of this object is consistent with a normal, elliptical galaxy, and that the determined reddening of E(B-V) is a realistic value. The red half of the spectrum is also well fit by the model. However, can be reduced further if some A/F stars are included ‘manually’. One explanation for this could be the above mentioned dilution of the stellar continuum in the nucleus with light from the only partially resolved blob BB3 (which is strong in A/F stars), and/or maybe even smaller, completely unresolved blobs.
The procedure thus fits the combination of main sequence stars (O5, B5, A5, F5 to sample the young stellar component, and G5, K5, and M5 stars to fine-tune the old galaxy population) and template central cluster galaxy to the main continuum regions blueward of 4600 Å. Wavebands containing emission lines were excluded from the fit. The code was run iteratively, with all components included in the first go. The algorithm automatically sets to zero components that are not required. The fitting procedure was repeated until no significant improvement of could be achieved.
Obviously the results obtained are sensitive to the intrinsic reddening inferred from the Balmer line ratios (as discussed in section 6.2.1) and the error bars on the assumed values of E(B-V) are still relatively large. There is the additional possibility that the young stellar populations causing the blue light also have an increased Balmer absorption that may affect this ratio. (Also see Sec. 8 for a discussion of the applicability of E(B-V) derived from the properties of the gas to the stellar component.) Hence we fit both, the uncorrected and corrected spectra, so that the results on the ones without any de-reddening can be taken as a very conservative lower limit for the true amount of blue light and number of early stars present. For BB3 we are only discussing the results from the fit to the uncorrected data, as it is not possible to achieve a good fit assuming the value of E(B-V) originally derived from the Balmer decrement for this region (see discussion in Sec. 6.3).
6.3.3 Stellar synthesis results
Although it is possible to obtain apparently acceptable fits to the nucleus with simply the template central cluster galaxy spectrum, could be reduced further if small amounts of A/F stars were included. At PA305 there is even the possibility that a marginal O star component is present. This, and the varying relative importance of the A and F stars in the nuclear spectra at PA305 and PA258 respectively, agrees with the earlier suggestion in section 6.2.1 that the PA258 either suffers from a small amount of atmospheric dispersion or that it is not centred on exactly the same region as the other PA.
The best fits to the spectra of the different regions in the RX J0821 system are shown in Fig. 12. The fit to the HSB continuum is very good, although the slight under-estimation of the redwards side of the 4000 Å break is typical for these kind of fits (e.g. figs in Crawford & Fabian 1993). The model includes significant proportions of both A- and O-stars added to the template/late star component spectrum. Note that before de-reddening, even though there is an additional F-component, still a significant number of O-stars is required.
BB1 shows quite a different spectrum (Fig. 12, lower left), with a remarkably strong Balmer series and [OII]3727 Å line in emission. The model uses mainly O-stars, plus a significant A-star component added on to the template galaxy, again confirming the presence of a blue excess. The apparent absence of any B-stars in BB1 and even more obviously in HSB can be explained by two separate starbursts having taken place in these blobs. However, it cannot be ruled out that there is a certain amount of confusion between O and B stars due to the similarity of their spectra and the scarcity of distinguishing spectral features in these stars. (Note that the regions with prominent Balmer lines had to be excluded from the fit due to the strong emission lines in the blobs.)
The best fit to BB3 (Fig. 12, upper right panel) includes statistically insignificant proportions of O- and B-stars, as well as significant contributions of A- and F-stars added on to the late component indicating an older starburst. Note, however, that we are using a minimum assumption of E(B-V) for this region. Any amount of reddening to be corrected for would increase the importance of early stars in this fit significantly.
Finally, the fit to the region BB2 is shown in Fig. 12 (lower right panel). The fit reproduces the general shape and strong Balmer absorption series seen in the spectrum by using a marginally significant O-star component and significant amounts of all other stellar components. (The strong emission feature at 3560 Å is a cosmic ray event.)
The difference spectrum (data minus the old component) for every blob is shown as a dotted line in this figure. A strong blue excess is obvious for HSB and BB1. BB2 and BB3 show a somewhat less pronounced blue light component stemming from older starbursts than the other two.


Tab. 2 shows the monochromatic slit fluxes at Å for each stellar component and the template galaxy used in the respective model before and after correction for internal reddening. Whenever the code did not require a stellar component for the final fit, a upper limit is given. The slit fluxes have been converted into luminosities and then into approximate numbers of stars of each type (Kurucz 1979; Allen 1995) also given in Tab. 2. The errors are the () confidence limits on a single interesting parameter, derived by manually stepping the individual fluxes in space.
| Region | O5 | B5 | A5 | F5 | Galaxy | |
|---|---|---|---|---|---|---|
| nuc | 0.21 | 0.50 | 3.4 | 31.2 | ||
| () | () | () | () | |||
| HSB | 2.18 | 2.8 | 3.7 | 15.1 | ||
| () | () | () | () | |||
| 100.3 | 66.5 | 100.6 | ||||
| () | () | () | () | |||
| BB1 | 0.60 | 0.54 | 1.44 | |||
| () | () | () | () | |||
| 2.71 | 1.64 | 4.60 | ||||
| () | () | () | () | |||
| nuc | 2.92 | 15.09 | ||||
| () | () | () | () | |||
| BB3 | 0.22 | 0.3 | 7.5 | 4.6 | 21.7 | |
| () | () | () | () | |||
| BB2 | 0.43 | 4.80 | 5.24 | 2.12 | 6.53 | |
| () | () | () | () | |||
| 0.45 | 5.14 | 5.34 | 1.84 | 6.57 | ||
| () | () | () | () |
If we assume the respective masses of O5, B5, A5, and F5 stars to be 40.0, 6.5, 2.1, and 1.3 (Zombeck 1990) and their typical lifetimes to be , , , and yr, respectively (Shapiro & Teukolsky 1983; Allen 1995), we can make a rough estimate of the mass deposition rate in stars () for each blob using , where is the number of stars. If we sum over the stellar components, we obtain 3.2, 0.1, 0.2, and 0.3for HSB, BB1, BB3, and BB2, respectively, which gives a total . In order to correct this for the mass contained in late type stars, we can make a crude estimate using Kroupa, Tout & Gilmore’s (1993) IMF
| (1) |
The total mass of stars associated with a burst of star formation is then
| (2) |
Assuming our stellar components as representative for the mass range of stars of types O – F, we adopt , for the early stars used in our model. The late type stars are assumed to span the range from to . By integrating over the IMF we can work out the correction factor for the late-type stars, and obtain a corrected total . Hence we are accounting for less than one third of the total mass deposition rate within the central 20 kpc of the cluster as derived from the X-rays (see Sec. 2.2). Of course, the actual will be somewhat higher, considering that the slits only sample a certain fraction of the object. For this reason, and because of the large uncertainties associated with the reddening, we refrain from carrying out a more detailed study, and merely note that as a first approximation the cooling flow provides enough material to be able to “feed” the starbursts. In order to attempt answering the question of precisely what percentage of the material deposited by the flow could actually be turned into stars, we would need spectra covering the entire extent of the star-forming region, while at the same time being of sufficiently high quality to give us a much better handle on the intrinsic reddening. It is quite possible that .
7 Summary of observational results
The Chandra data show that the central galaxy of RX J0820.9+0752 is embedded in cluster gas with a central temperature of 1.8 keVand moderate X-ray luminosity. Assuming that no heat sources are present, the observed surface brightness profile implies that the hot intracluster gas is cooling within a radius of 20 kpc at rates of a few tens of solar masses a year. The X-ray emission is clearly extended by around 22 kpc towards the NW of the central galaxy. The scale and orientation of this extended emission is well matched to the region within the break of the profile, the luminous H nebula, and the strong CO emission. The line-emitting nebula cannot be seen in the HST image due to the latter’s relatively blue passband. The image shows, if anything, a sharp decline in the diffuse continuum in this system in the same region at radii beyond around 8 kpc. Thus it appears the strong extended X-ray/H feature is heavily obscured by dust at shorter wavelengths which agrees with our estimates of E(B-V) obtained from the Balmer decrement in this region. The HST image does, however, reveal large clumps of emission (blue continuum and/or blue emission lines) that cross in an arc from this region to the SE of the central galaxy; a secondary galaxy lies 11 kpc in this direction, opposite to the X-ray/H extension.
The radio power of RX J0821 is the third lowest of all line-emitting CCGs in the BCS (only A262 and RX J1733.0+4345/IC1262 have lower powers) and may not be associated with the core of the CCG (as is found in the vast majority of BCS line-emitting CCGs) but instead be coincident with the main star-forming regions. The discovery of radio emission from star formation rather than nuclear activity is intriguing and needs more detailed radio imaging to verify.
We have taken spectra from two slit position angles across the main galaxy, including the extended nebula to the NW and across the two arcing lines of clumps seen in the HST image to the ENE. We detect H in emission out to 24 kpc to the NW of the galaxy. The gas in this extended nebula is redshifted by a roughly constant amount of relative to the central galaxy, and then undergoes a strong gradient of about 150in 8 kpc as it crosses this galaxy and out to the SE. The nucleus of the main galaxy shows little line emission, no intrinsic reddening or evidence for an excess blue continuum component. The radial velocities of the stellar and nebular components in the nucleus of the CCG are in very good agreement, but they are offset significantly by to the NW, and this separation appears to be gradually decreasing to almost zero towards the E.
There is a marked overall decline in line-width from about 300 to just below 200 over the extent of the nebula from the NW towards the nucleus, followed by a sharp increase back to 300 about 3 kpc from the nucleus. The line-width then decreases again over the inner region of the galaxy.
We isolate two main regions of excess line and continuum emission to the NW of the central cluster galaxy. The HSB feature lies at the end of the inner arc of clumped emission seen in the HST image, where it tails off into the core of the H nebula. Consistent with its position also at the edge of the sharp ‘bite’ of extinction, the strong line emission shows a Balmer decrement indicating a large degree of intrinsic reddening, with E(B-V). The excess blue continuum is well fit by a combination of O and A-type stars.
A more isolated blue blob (BB1) lies further to the NW, still within the core of the H nebula. Its spectrum again shows a strong excess blue continuum (again well fit by O and A main sequence stars), and a strong Balmer series in line emission. Again, the Balmer decrement indicates a degree of intrinsic reddening at E(B-V). Generally reddening is found to be very high within the region occupied by the H nebula.
We also obtain the spectra of two continuum blobs, one from each of the clumped lines of emission to the ENE of the main galaxy. BB3 is a conspicuous bright blob forming part of the inner arc, that is bright in H, lying within the peak of emission. A high level of intrinsic reddening is indicated by the strong Balmer decrement (E(B-V)) and evidence for a small amount of excess blue continuum, fit by a range of main sequence stars. BB2 forms part of the outer crossing arc to the ENE, and shows little line emission and an insignificant amount of intrinsic reddening. Its blue continuum, however, – otherwise quite similar to that of BB3 – is remarkable in showing a clear Balmer line sequence in absorption that is fit by a complex mixture of stars of all types.
The emission line gas at the locations of BB1, BB3 and HSB has a lower [NII]/H, smaller linewidths and stronger H emission than found in the surrounding regions. BB2 deviates in this and other respects from the other blobs.
8 Discussion
The immediate environment of the central galaxy of the RX J0820.9+0752 cluster is very complex. The primary region of cooling X-ray gas contains a luminous H nebula, high intrinsic absorption, and a weak radio source. The total slit H luminosity of the nebula is around ; as our slit covers an area of about 35 kpc2 at the object’s redshift, this corresponds to a H surface brightness of . RX J0821 is therefore an intermediate H emitter in terms of both H luminosity and surface brightness when compared to the BCS objects (Crawford et al. 1999; compare also their Fig. 6). The equivalent hydrogen column density derived from the measured Balmer decrement is atom cm-2(assuming a gas-to-dust ratio of N(HI)/E(B-V) atom cm-2 mag-1; Bohlin, Savage & Drake 1978). This does not seem to agree very well with the value of X-ray determined atom cm-2 given in Tab. LABEL:xmodel. However, given the large region covered by the X-ray annulus, the uncertainties associated with both the value for used in the X-ray model and that derived from the Balmer decrement, and especially projection effects, this may not be significant. Furthermore our slit was chosen so as to sample the most interesting regions of the object which are associated with heavily obscuring dust clouds. Hence the high average E(B-V) derived from the slit is probably not representative for the whole object.
It is interesting that the surrounding cluster hosts a cooling flow, despite the complicated morphology of the CCG and a head-tail radio source that could indicate a cluster that is not fully relaxed. The coincidence between the X-ray and H emission is reminiscent of the filament found in A1795 (Fabian et al. 2001a), where a 40-kpc-long X-ray filament is also associated with a similar region of high optical reddening and strong line emission. Half-way down this filament lies a large clump of blue light very similar to the blue blobs we find around RX J0821 (Cowie et al. 1983; McNamara et al. 1996). Hu et al. (1985) show that the outer emission line nebulosity in A1795 is offset in velocity by an average 150from the galaxy whereas the line emission at the position of the galaxy shares its redshift. The current best explanation for the observed X-ray/H filament in A1795 is that it is a cooling wake prompted to collapse from the intracluster medium by the passage of the CCG through the cluster core. Fabian et al. (2001a) give other explanations for such a feature as well, but state that the only likely mechanism apart from the cooling wake is that the filament is a contrail produced by the ram pressure of a radio source passing through a multiphase medium. The similarity of the extended X-ray/H structure in RX J0820.9+0752 to that of A1795 strongly suggests that similar mechanisms are at work here. Given that the radio source in RX J0820.9+0752 is very weak, its similarity to A1795 strengthens the interpretation that a cooling wake rather than radio source is responsible for these features in both galaxies. In addition, the velocity gradient within the extended ionized gas around RX J0821 is of the same magnitude (150) as in A1795.
We find a velocity offset between the emission line gas and the stars that diminishes from about 200at the position of the HSB to the NW to being practically consistent with each other in the region of the eastern arcs. This is sampled reliably at only three points (HSB, BB3, and BB2), but the data seem consistent with the velocity offset vanishing somewhere near the secondary galaxy. Furthermore, the latter’s stellar radial velocity of relative to the CCG is consistent with that of most of the off-nucleus gas. The connection of the extended X-ray/H feature to the CCG suggests that it is clearly produced by the CCG, but we also see a kinematic suggestion for an association of the gas with the secondary. It is plausible that some kind of tidal triggering has taken place in the past, contributing to the formation of the observed arcs with their blue blobs on the Eastern side of the galaxy. For example, if the second galaxy passed through the cooling wake left by the CCG, it could have dragged some of the gas out of the wake in the process.
We can use the break in the mass-deposition profile (Fig. 3, bottom panel) to estimate the effective age of the cooling flow. Allen et al. (2001c) identify this break with the outermost radius at which cooling occurs. In RX J0820.9+0752 the break occurs at kpc. The cooling time, and therefore the effective age of the flow, at this radius is Gyr: the cooling flow is relatively young, which is additional support for some kind of recent merger activity.
In Tab. 3 a comparison between H luminosity as observed and predicted from the ionizing flux of the O-stars derived from the continuum fits applying the method described in Allen (1995) both before and after correction for intrinsic reddening is given. The results for BB1 and BB2 are in good agreement, even though BB2 does allow for an additional source of ionization to be present. This is even more true for BB3, where the observed luminosity is significantly higher than the calculated one. (We note however, that if reddening is underestimated, this could also account for the observed H.) In the HSB the calculated luminosity is significantly higher than the observed one. However, if we consider the result for E(B-V), it is the other way around, which could be an indication that the reddening might have been over-estimated somewhat.
As a caveat, we note that their velocity offset means that the stellar and gas components of the blobs may not be cospatial. Furthermore, if most of the dust responsible for the Balmer decrement was associated with the gas rather than the stars, the E(B-V) derived from the emission lines would over-correct the stellar component. This is one reason why we have regarded the reddening corrections with great caution and have included results assuming E(B-V) throughout the paper as well.
| HSB | 7/37 | / |
|---|---|---|
| BB1 | 1.7/3.0 | / |
| BB2 | 1.0/1.0 | / |
| BB3 | 5 |
This interpretation would imply that the stars might not be a viable ionization source for the gas. Therefore it is worth while to consider other possible sources for the excess H emission such as the cold mixing process described in Fabian et al. (2001b). If the material that has cooled to about 1 keV mixes with cold (K) gas, it then undergoes a rapid phase of further cooling. The ‘missing’ soft X-ray luminosity is thus re-radiated at optical/UV wavelengths and could explain the strength of the emission lines in this object. If we assume that all the observed slit H luminosity is due to re-radiated X-ray emission from cold mixing and convert it into an equivalent mass deposition rate using
| (3) |
(Fabian et al. 2002), we obtain for the uncorrected slit mass deposition rate. This increases to if correction for reddening is applied. Obviously, comparing to the previously derived even when including ionization due to star formation, there is more than enough room for emission due to cold mixing.
Taken together, it seems that several processes are at work in the central region of RX J0820.9+0752: although there are no redshift measurements for other potential cluster members that could provide us with a redshift for the whole cluster and thus we cannot test the motion of the CCG, it is consistent with our observations that the CCG moves within the cluster potential, leaving behind a wake of cooling gas as observed in the X-ray and H light. A certain degree of interaction with the secondary galaxy (be it direct interaction between the two galaxies or the secondary passing through the cooling wake of the CCG) has helped produce dense, off-nucleus clumps of gas in which star formation is triggered as apparent from their blue continua. The observed strong H emission could be explained by either cold mixing or (if stars and gas are cospatial) stellar ionization. Most likely both processes have made a contribution to produce the observed line luminosity.
It is clear further features similar to our ‘blue blobs’ exist around RX J0821, not only in the two HST arcs of emission, but there also appears to be another isolated bright blob at the edge of the absorbed region, around 5.5 arcsec to the WNW of the main galaxy. Studying more of these blobs in detail should allow us to learn more about the intricate interplay of a massive galaxy moving through the ICM of a cooling flow cluster, the associated cooling wake, possible tidal interaction with the secondary galaxy, the role of the weak radio source, and strong star formation activity triggered by one or more of these processes.
9 Acknowledgments
CMB-K thanks the Austrian Bundesministerium für Bildung, Wissenschaft und Kunst and the Cambridge European Trust for financial support, and Robert Schmidt, Dougal Mackey and Eduardo Delgado Donate for valuable discussions and general help. ACF, ACE, CSC and SWA thank the Royal Society for financial support. We thank Richard Wilman for his assistance with collection of the data during the WHT observing run, and Drs Frayer and Ivison for knowledge of their SCUBA and OVRO results in advance of publication. For the preparation of this paper we made use of data acquired with Chandra (NASA-MSFC, Huntsville, Alabama), HST (Space Telescope Science Institute, Baltimore, USA), AAT (Anglo-Australian Observatory, Siding Spring, Australia), and WHT (Observatorio del Roque de los Muchachos, La Palma, Spain). We acknowledge the use of STScI’s Digital Sky Survey (DSS).
References
- [1] Allen S.W., 1995, MNRAS, 276, 947
- [2] Allen S.W., Ettori S., Fabian A.C., 2001a, MNRAS, 324, 877
- [3] Allen S.W., Schmidt R.W., Fabian A.C., 2001b, MNRAS, 328, L37
- [4] Allen S.W., Fabian A.C., Johnstone R.M., Arnaud K.A., Nulsen P.E.J., 2001c, MNRAS, 322, 589
- [5] Anders E. & Grevesse N., 1989, GeCoA, 53, 197
- [6] Arnaud K.A., 1996, in Astronomical Data Analysis Software and Systems V, eds. Jacoby G. and Barnes J., ASP Conf. Series volume 101, p17
- [7] Balucinska-Church M., McCammon D., 1992, ApJ, 400, 699
- [8] Becker R.H., White R.L., Helfand D.J., 1995, ApJ, 450, 559
- [9] Bland-Hawthorn J., Jones D.H., 1998, Publ. Astron. Soc. Aust., 15, 44
- [10] Bohlin R.C., Savage B.D., Drake J.F., 1978, ApJ, 224, 132
- [11] Brüggen M., Kaiser C.R., 2001, MNRAS, 325, 676
- [12] Churazov E., Brüggen M., Kaiser C.R., Böhringer H., Forman W., 2001, ApJ, 554, 261
- [13] Churazov E., Sunyaev R., Forman W., Böhringer H., 2002, MNRAS, submitted (astro-ph/0201125)
- [14] Cowie L.L., Hu E.M., Jenkins E.B., York D.G., 1983, ApJ, 272, 29
- [15] Crawford C.S., Fabian A.C., 1993, MNRAS, 265, 431
- [16] Crawford C.S., Edge A.C., Fabian A.C., Allen S.W., Böhringer H., Ebeling H., McMahon R.G., Voges W., 1995, MNRAS, 274, 75
- [17] Crawford C.S., Allen S.W., Ebeling H., Edge A.C., Fabian A.C., 1999, MNRAS, 306, 857 (BCS III)
- [18] David L.P., Nulsen P.E.J., McNamara B.R, Forman W., Jones C., Ponman T., Robertson B., Wise M., 2001, ApJ, 557, 546
- [19] Ebeling H., Edge A.C., Allen S.W., Crawford C.S. Fabian A.C., Huchra J.P., 2000, MNRAS, 318, 333
- [20] Ebeling H., Rangarajan F.V.N., White D.A., 2002, MNRAS, submitted
- [21] Edge A.C., 2001, MNRAS, 328, 762
- [22] Edge A.C., Ivison R.J., Smail I., Blain A.W., Kneib J.-P., 1999, MNRAS, 306, 599
- [23] Edge A.C., Wilman R.W., Johnstone R.M., Crawford C.S., Fabian A.C., Allen S.W., 2002, MNRAS, submitted
- [24] Ettori S.E., Fabian A.C., Allen S.W., Johnstone R.M., 2001, MNRAS in press
- [25] Fabian A.C., 1994, A&AR, 32, 277
- [26] Fabian A.C., Sanders J.S., Ettori S., Taylor G.B., Allen S.W., Crawford C.S., Iwasawa K., Johnstone R.M., Ogle P.M., 2000, MNRAS, 318, 65
- [27] Fabian A.C., Sanders J.S., Ettori S., Taylor G.B., Allen S.W., Crawford C.S., Iwasawa K., Johnstone R.M., 2001a, MNRAS, 321, L33
- [28] Fabian A.C., Mushotzky R.F., Nulsen P.E.J., Peterson J.R., 2001b, MNRAS, 321, L20
- [29] Fabian A.C., Allen S.W., Crawford C.S., Johnstone R.M, Morris R.G., Sander J.S., Schmidt R.W., 2002, MNRAS, 332, L50
- [30] Heckman T.M., Baum S.A., van Breugel W.J.M., McCarthy P., 1989, ApJ, 338, 48
- [31] Hu E.M., Cowie L.L., Wang Z., 1985, ApJS, 59, 447
- [32] Johnstone R.M., Allen S.W., Fabian A.C., Sander J.S., 2002, astro-ph/0202071
- [33] Kaastra J.S., Mewe R., 1993, Legacy, 3, 16, HEASARC, NASA
- [34] Kaastra J.S. et al. , 2001, A&A, 365, L99
- [35] Kriss G.A., 1994, PASP Conf. Ser., 61, 437
- [36] Kroupa P., Tout C.A., Gilmore G., 1993, MNRAS, 262, 545
- [37] Kurucz R.L., 1979, ApJS, 40, 1
- [38] Liedhal D.A., Osterheld A.L., Goldstein W.H., 1995, ApJ, 438, L115
- [39] McNamara B.R. et al. , 2000, ApJ, 534, L135
- [40] McNamara B.R., Wise M., Sarazin C.L., Jannuzi B.T., Elston R., 1996, ApJ, 466, L9
- [41] Peterson J.R et al. 2001, A&A, 265, L104
- [42] Pickles A.J., 1998, PASP, 110, 863
- [43] Reynolds C.S., Heinz S., Begelman M.C., 2002, MNRAS, 332, 271
- [44] Ruszkowski M., Begelman M.C., 2002, ApJ, submitted (astro-ph/0207471)
- [45] Schmidt R.W., Allen S.W., Fabian A.C., 2001, MNRAS, 327, 1057
- [46] Shapiro S.L., Teukolsky S.A., 1983, Black Holes, White Dwarfs and Neutron Stars. John Wiley & Sons, New York
- [47] Stark A.A., Gammie C.F., Wilson R.W., Bally J., Linke R.A., Heiles C., Hurwitz M., 1992, ApJS, 79, 77
- [48] Tennant A.F., 1991, NASA Technical Memorandum, 4301
- [49] Voigt L.M., Schmidt R.W., Fabian A.C., Allen S.W., Johnstone R.M., 2002, MNRAS, submitted (astro-ph/0203312)
- [50] White D.A., Jones C., Forman W., 1997, MNRAS, 292, 419
- [51] Young A.J., Wilson A.S., Mundell C.G., 2002, ApJ, submitted (astro-ph/0202504)
- [52] Yun M.S., Reddy N.A., Condon J.J., 2001, ApJ, 554, 803
- [53] Zombeck M.V., 1990, Handbook of Space Astronomy & Astrophysics, 2nd edn., Cambridge Univ. Press, Cambridge