Abstract
The detection of a massive jet-ejection event from SS 433 with RXTE is reported. SS 433 in its high state has been monitored with RXTE from 2001/11/09 (MJD = 52222) to 2001/11/25 (MJD = 52238), following a radio flare on 2001/11/02 (MJD = 52215). An irregular temporal variation with time scales of s appears in the light curve, and the amplitude increases day by day. This is the first detection of such a fast variation from the source. In addition to the fast variations, the daily light curve scatters with a time scale of day from 2001/11/17 (MJD = 52230). Following the scatter, another radio flare has been detected on 2001/11/22 (MJD = 52235), which has been obviously formed during the X-ray scatter. This is a preliminary report on a massive jet-ejection event witnessed in X-ray band for the first time.
1 Introduction
The famous microquasar SS 433 shows two distinctive states; the quiescent state in which the continuous jet flow is emanated, and the high state in which massive jet blobs are successively ejected[1]. While the former state has been well studied with numerous X-ray missions, few massive jet-ejection events were observed in X-ray band, except for a possible snapshot or two taken with Einstein[2] and RXTE [3, 4]. Because the ejection of a massive jet blob is a rare (2.6 yr-1) and short (a few days) event, it is difficult to observe with an X-ray mission unless the observation is specially coordinated for that purpose.
The situation is same for other microquasars such as GRS 1915+105. While minor jet-ejection events in GRS 1915+105 have been observed with RXTE in multi-wavelength campaigns and several other occasions (e.g., [5, 6]), there are few X-ray observations of a massive ejection event like the one reported in the famous paper by Mirabel & Rodiríguez[7]. X-ray data of a massive jet-ejection event in microquasars are needed to fill the void in our understanding. With such data, we can measure the mass of the massive blob, determine the energy budget of the system, etc.
We planed TOO monitoring observations of SS 433 with RXTE. In the plan, a long-term monitoring is triggered with a radio flare, which indicates that the source enters its high state. In the high state, the source is expected to experience a second flare within 30 days. If the second flare occurs, we can observe it from the onset. Our plan is different from the common TOO strategy for transient sources aiming at the first flare. The formation of a massive jet blob would not be observed with an X-ray pointing observation after the detection of the flare. SS 433’s radio activity is monitored with the RATAN-600 radio telescope, which performs such a several-month-long monitoring observation of SS 433 occasionally.
2 The Observations and the Data Reduction
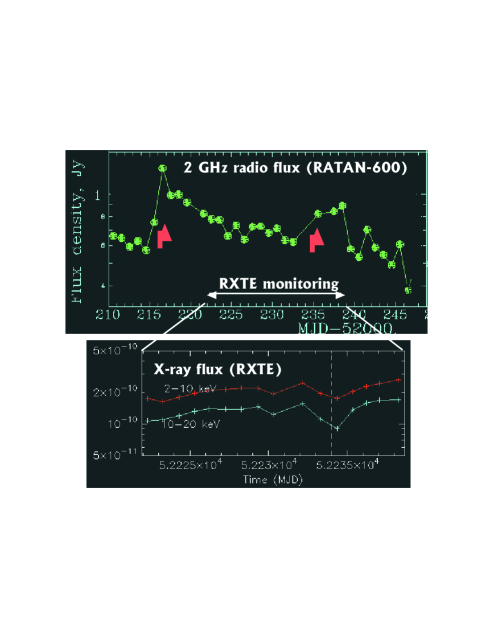
A radio monitoring observation of SS 433 with RATAN-600 started on 2001/09/15. After two months of static activity, a remarkable flare occurred on 2001/11/02 (MJD = 52215). The radio and X-ray light curves are shown in figure 1. Flux densities reached 1.3 Jy at 2.3 GHz at MJD = 52216.6[8]. We triggered RXTE monitoring observations as shown in Table 1. Except for a break at 2001/11/18, the source was observed for 3 ks everyday until 2001/11/25. Both anodes of layer 1, 2, and 3 of the PCA have been used in the Standard-2 mode. The raw count rate of a data segment taken on 2001/11/19 is shown in figure 2. Irregular variations are clearly seen. The spectrum and the response matrix have been made from each segment and fitted with the traditional model used for the data of SS 433 taken with Ginga and RXTE (e.g., [9, 4]):
| (1) |
The hydrogen column density is fixed to . From the fit, BGD-subtracted X-ray light curves are obtained as shown in figure 1. For more detailed spectroscopy, see [3].
| Start (MJD) | End (MJD) | PCU |
|---|---|---|
| 2001/11/09 07:10 (52222.299) | 2001/11/09 08:11 (52222.341) | 0234 |
| 2001/11/10 05:19 (52223.222) | 2001/11/10 06:21 (52223.265) | 0234 |
| 2001/11/11 06:47 (52224.283) | 2001/11/11 07:47 (52224.325) | 0234 |
| 2001/11/12 06:35 (52225.275) | 2001/11/12 07:35 (52225.316) | 0234 |
| 2001/11/13 04:46 (52226.199) | 2001/11/13 05:46 (52226.240) | 0234 |
| 2001/11/14 06:11 (52227.258) | 2001/11/14 07:13 (52227.301) | 0234 |
| 2001/11/15 06:00 (52228.250) | 2001/11/15 07:01 (52228.293) | 0234 |
| 2001/11/16 07:26 (52229.310) | 2001/11/16 08:32 (52229.356) | 023 |
| 2001/11/17 07:14 (52230.302) | 2001/11/17 08:20 (52230.349) | 023 |
| 2001/11/19 03:41 (52232.154) | 2001/11/19 04:33 (52232.190) | 0234 |
| 2001/11/20 06:40 (52233.278) | 2001/11/20 07:46 (52233.324) | 02 |
| 2001/11/21 08:05 (52234.337) | 2001/11/21 09:16 (52234.387) | 023 |
| 2001/11/22 07:54 (52235.330) | 2001/11/22 09:05 (52235.379) | 024 |
| 2001/11/23 04:32 (52236.189) | 2001/11/23 05:29 (52236.229) | 024 |
| 2001/11/24 01:11 (52237.050) | 2001/11/24 01:54 (52237.080) | 02 |
| 2001/11/25 05:45 (52238.240) | 2001/11/25 06:47 (52238.283) | 012 |

3 Discussion
The X-ray emitting part of the continuous jet flow with a speed of 0.26 c was estimated to be as long as cm, and the cooling time of the X-ray emitting plasma as short as s [10]. According to this picture, an X-ray variation faster than s is difficult to detect. So, the discovery of the fast variation clearly seen in figure 2 is surprising, and our understanding of the system must be somehow changed. The fast variation suggests that either the X-ray emitting part of the jet was as short as cm, or other source than the jet, e.g., the inner part of the accretion disk or the surface of the compact object was seen. To distinguish the two possibilities, a temporal analysis of the Doppler-shifted iron lines is quite promising. If the jet itself was flickering, the iron line would also show flickering, and if the variation was caused by some instability of the accretion disk, the iron line would be stable through the variation. This report is preliminary and spectrally-resolved temporal study is not yet done. The data taken on 2001/11/19 has been divided into two, data with count rate larger than 220 counts s-1 and with count rate less than 220 counts s-1, and a spectrum has been made from each data. The fit results are not different significantly. So far, there is no evidence of an X-ray source other than the jet. And from the quick-look analysis, it can be said that the fast variation is not periodic; no pulsation or QPO has been found from the power spectra. We can not determine whether the variation comes from the accretion disk or a neutron star at this stage of analysis.
If we assume that the fast variation is resulted from the sudden change of the power of the jet, the parameters of the jet would be derived. The shortest time scale of the fast variation seems to be 50 s, i.e., cm, which corresponds to an initial electron density of cm-3, assuming an initial temperature of 20 keV [10]. Assuming a X-ray luminosity of erg s-1, the mass outflow rate of the jet would be M⊙ yr-1, or a kinematic luminosity of erg s-1.
It should be noted that these estimated parameters are rather smaller than those based on the data taken in the quiescent state. Is the jet weaker in the high state than in the quiescent state? Or the previous estimations are simply wrong and the jet is always short and weak? Further analysis is going on.
References
- 1. Fiedler, et al. , 1987, AJ, 94, 1244.
- 2. Band, 1989, ApJ, 336, 937.
- 3. Safi-Harb & Kotani, 2002, in this volume.
- 4. Band, et al. , 2002, in preparation.
- 5. Mirabel, et al. , 1998, AA 330, L9.
- 6. Greiner, et al. , 1996, ApJ, 473, L107.
- 7. Mirabel, & Rodiríguez, 1994, Nature, 371, 46.
- 8. Kotani & Trushkin, 2001, IAUC 7747.
- 9. Kawai, 1989, in Proc. 23rd ESLAB Symp. on Two-Topics in X-Ray Astronomy, (European Space Agency, Noordwijk), 453
- 10. Kotani, 1997, Doctoral Thesis, U. of Tokyo