A high resolution picture of the intracluster gas
Abstract
Chandra has significantly advanced our knowledge of the processes in the intracluster gas. The discovery of remarkably regular “cold fronts”, or contact discontinuities, in merging clusters showed that gas dynamic instabilities at the boundaries between the moving gases are often suppressed, most likely by specially structured magnetic fields.
Cold fronts are not limited to mergers — Chandra observed them in the cores of more than 2/3 of the cooling flow clusters, where they often divide the cool central and the hotter ambient gas phases. The natural state of the low-entropy central gas in clusters thus appears to be to slosh subsonically in the central potential well, with several interesting implications. Hydrostatic equilibrium is not reached and the hydrostatic total mass estimates cannot be valid at small radii ( kpc). The kinetic energy dissipated by the sloshing gas may be sufficient to compensate for radiative cooling. In the absence of a recent merger, the cause of such sloshing is unclear. It might be related to the mechanical energy generated by the central AGN, evidence of which (the bubbles) is also observed by Chandra in a large fraction of the cooling flow clusters.
Heat conduction across cold fronts is suppressed completely. In the bulk of the gas, it is reduced by a factor of or more relative to the classic value, as shown by merger temperature maps. A spatial correlation between the gas temperature maps and the radio halo maps is observed in several mergers, which may provide clues for the relativistic particle acceleration mechanisms.
Smithsonian Astrophysical Observatory, Cambridge, MA 02138, USA
1. Introduction
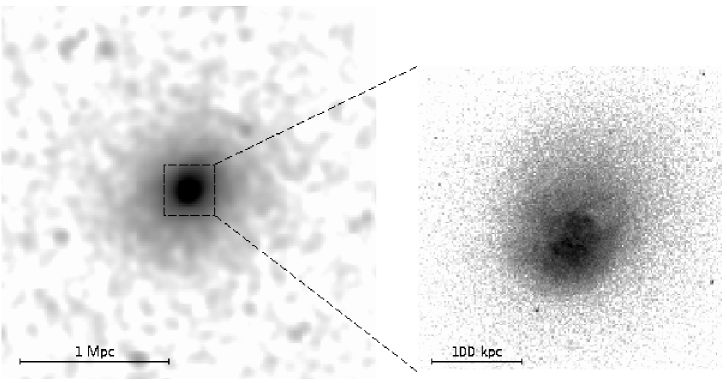
Chandra X-ray Observatory’s salient feature is its 1′′ resolution. The difference it makes for the galaxy cluster studies is illustrated in Fig. 1, which shows images of one of the most relaxed nearby clusters, 2A0335+096, made by ROSAT PSPC and Chandra. On large linear scales accessible to ROSAT, the cluster is symmetric and, apparently, in hydrostatic equilibrium. However, in the central 100 kpc, Chandra reveals a very dynamic gas core. In this article, we will review the published results and report some new findings on dynamic phenomena in the cluster gas. Some other interesting Chandra work, such as the accurate total mass profiles and studies of the AGN interaction with the cluster gas, is presented elsewhere in these proceedings. We use =50 km sMpc-1.
2. Gas motion in merging clusters
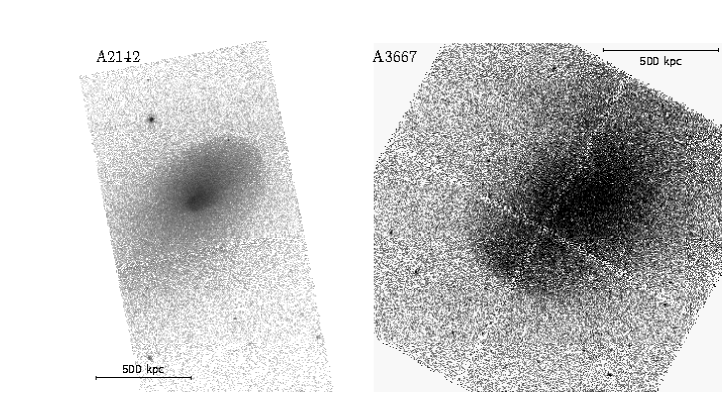
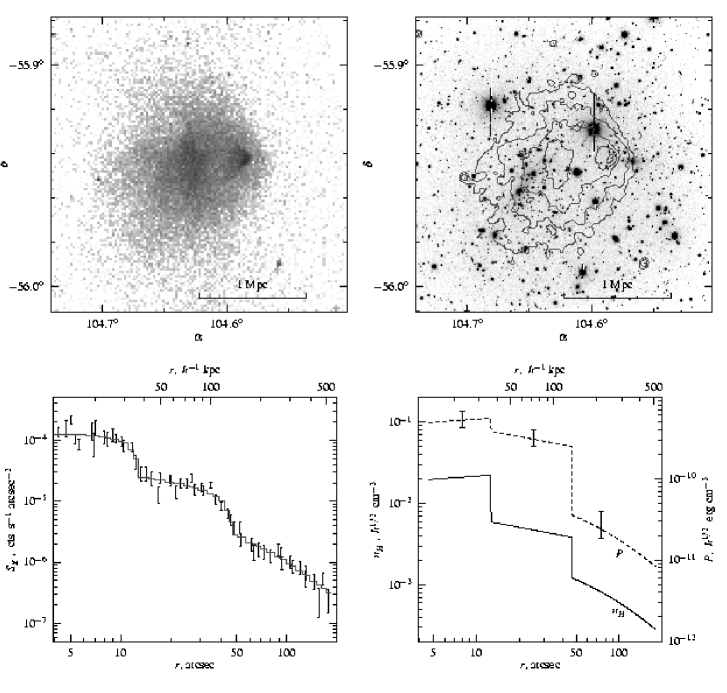
Among the first Chandra cluster results was a discovery of “cold fronts” in merging clusters A2142 and A3667 (Markevitch et al. 2000; Vikhlinin, Markevitch, & Murray 2001ab). Figure 2 shows ACIS images of A2142 and A3667 with prominent X-ray brightness edges. A close examination (Fig. 3) shows that (a) these edges are perfectly modeled by an abrupt, spherically symmetric (within a certain sector) jump of the gas density, (b) the gas on the denser side of the edge is cooler, the opposite to what is expected for a shock front, and (c) there is approximate pressure equilibrium across the edge, or at least no large pressure jump such as expected in a shock front. We proposed that these edges are contact discontinuities, or “cold fronts”, delineating the boundaries of the dense cool cores of merging subclusters that have survived shocks and destruction of a merger and are now moving, along with the underlying dark matter clumps, through a shock-heated surrounding gas. A more recent observation of another merging cluster, 1E0657–56 (Fig. 4), illustrates this quite clearly (Markevitch et al. 2002). It reveals a cool gas “bullet” moving westward, that lags behind its underlying galaxy subcluster seen in the optical plate, because of ram pressure. The bullet’s sharp front edge is a cold front; further ahead in front of the bullet, there is a gas density jump of a similar amplitude which is a genuine bow shock. Cold fronts have since been observed in several other mergers (e.g., Sun et al. 2001; Kempner et al. 2002) and reproduced in simulations (e.g., Nagai & Kravtsov 2002; Bialek et al. 2002), although the spatial resolution of the present simulations is far behind that of the X-ray data. Shock fronts are less easily observed, and only one other than the shock in 1E0657 has been unambiguously detected so far, a weak one in A3667.
Cold fronts and shocks offer unique insights into the cluster physics, including determining the gas bulk velocity, its acceleration, growth of plasma instabilities, strength and structure of magnetic fields, and thermal conductivity. From the pressure profile across the cold front in A3667, Vikhlinin et al. (2001b) determined the Mach number of the subcluster to be . The temperature and density jumps at the shock in 1E0657 give the Mach number of the “bullet” as (Markevitch et al. 2002).
The extent and regularity of the observed cold fronts (Fig. 2) is unexpected. Vikhlinin et al. (2001a) estimated that, given the measured subcluster velocity, the front in A3667 should have been destroyed by Kelvin-Helmholtz instability. Its existence thus requires partial suppression of the instabilities, for example, by surface tension of a layer of the magnetic field parallel to the front, with a field strength of G. Such a field configuration may be created by the tangential gas flow. Once formed, it would effectively stop the plasma diffusion and heat conduction across the front (as is indeed observed, see §4), and may inhibit gas mixing during the subcluster merger.
The gas bullet in 1E0657 (Fig. 4) is near the final stage of being destroyed by ram pressure and gas dynamic instabilities. A longer Chandra exposure has just been obtained and will show these processes in exquisite detail.
The cold fronts discussed above are observed in merging clusters, with orbiting subclusters driving the gas motion by their gravitational pull. In A3667, the X-ray surface brightness distribution inside the cold front even allows a determination of the precise center of the underlying dark matter clump (inside the front but well ahead of the cool gas centroid; Vikhlinin & Markevitch 2002). There is a different class of cold fronts observed in clusters with no signs of merging; it is discussed below.
3. Non-hydrostatic gas in cores of relaxed clusters
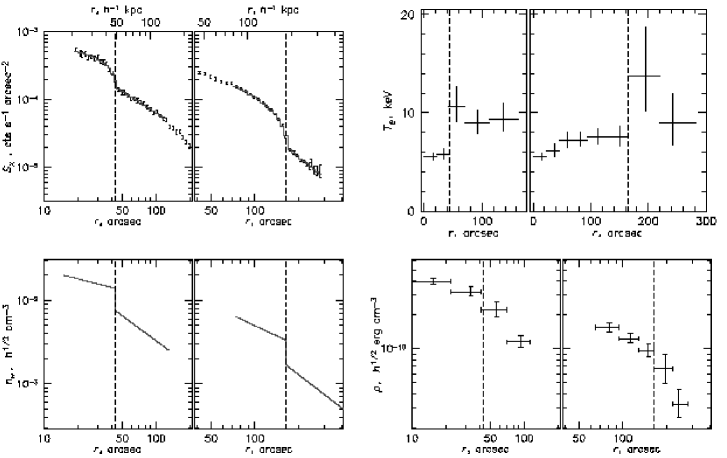
Cold fronts similar to those in A2142 and A3667, but much less prominent, were reported in the cores of relaxed clusters RXJ1720.1 (Mazzotta et al. 2001) and A1795 (Markevitch, Vikhlinin & Mazzotta 2001). The latter is shown in Fig. 5 (a subtle brightness edge in the southern sector) along with the radial profiles of the gas density, temperature and pressure. This small density jump has interesting implications which we review here in detail. The pressure is continuous across the front, indicating that the current relative velocity of the gases is near zero, making the edge appear to be in hydrostatic equilibrium. However, a total mass profile derived, under the equilibrium assumption, from the radial profiles of the gas density and temperature in this sector, exhibits an unphysical jump by a factor of . For comparison, we also derived a mass profile from the data at the opposite, smooth side of the cluster. Outside the radius of the edge, the two profiles are in agreement, as they must be if the gas on both sides traces the same centrally symmetric potential. Such an apparent mass discontinuity was first reported in RXJ1720.1 (Mazzotta et al. 2001).
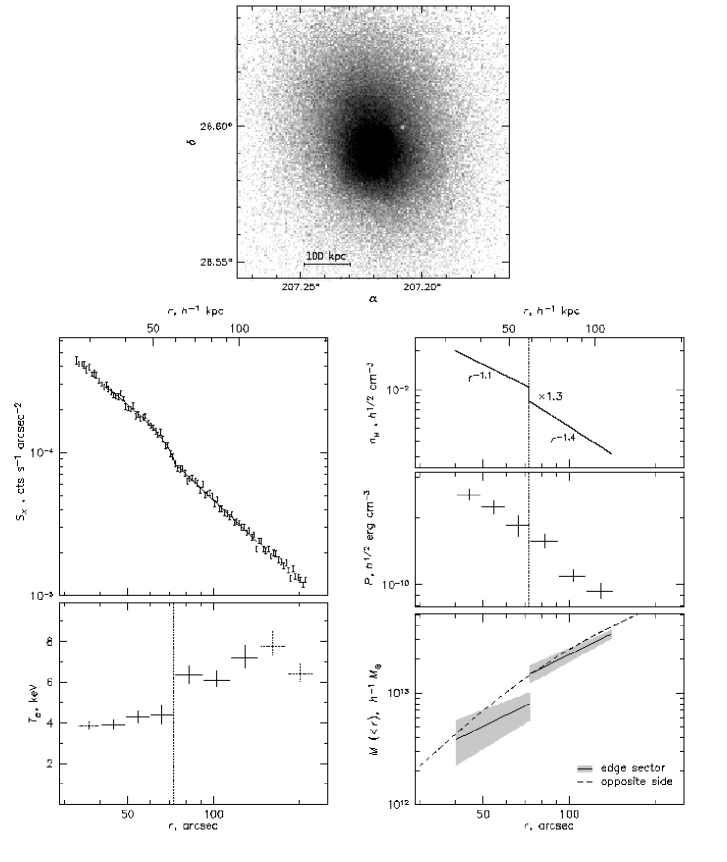
We proposed that the cool central gas is “sloshing” in the cluster gravitational potential well and is now near the point of maximum displacement, where it has zero velocity but nonzero centripetal acceleration. The distribution of this non-hydrostatic gas should reflect the reduced gravity force in the accelerating reference frame, resulting in the apparent mass discontinuity. Assuming that the gas outside the edge is hydrostatic, the acceleration of the moving gas can be estimated from the mass jump as , where is the radius of the edge. There is a cool gas filament at the position of the cD galaxy (Fabian et al. 2001), aligned with the apparent direction of the gas motion. If the galaxy is at rest in the cluster potential while the gas is flowing around it, then the length of the filament, kpc, shows the amplitude of the gas sloshing.
The cold front in A1795 is a boundary between the cool (cooled in situ, or fallen in) gas in the core and the ambient cluster gas; apparently, they do not mix readily when stirred, similarly to the gases belonging to different subclusters in the mergers A2142 and A3667. Gas motion in the centers of relaxed clusters has other interesting implications which will be discussed below (§§ 3.2-3.3), but first we will check how widespread this phenomenon is.
3.1. Prevalence of gas sloshing
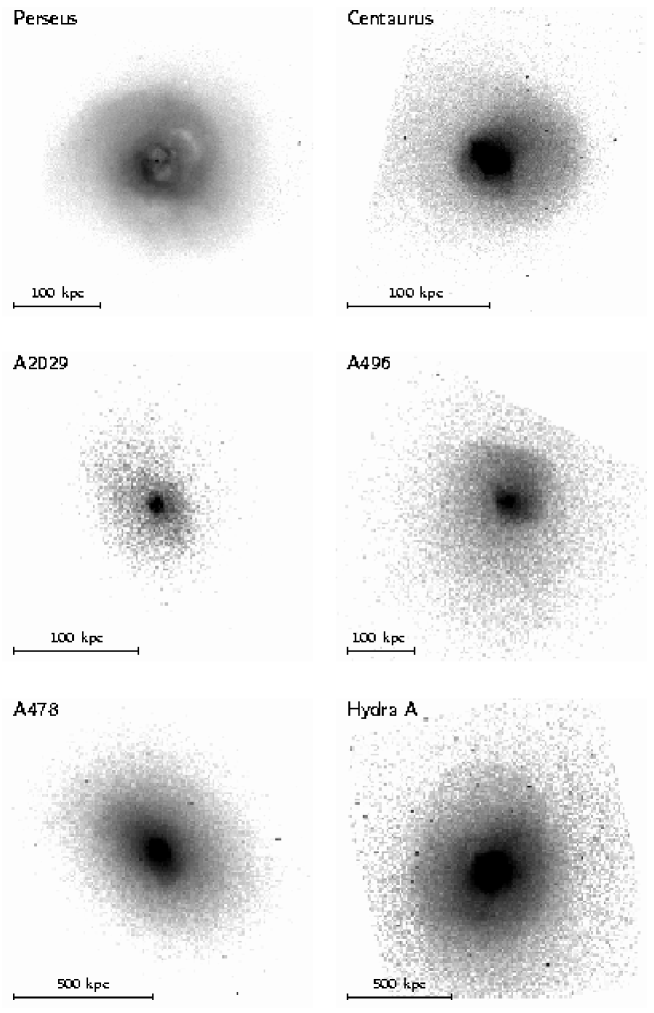
We have selected 37 nearby clusters known from earlier X-ray studies to be symmetric and “relaxed”, that have archival Chandra data of good statistical quality. Although the sample is not objective, for our qualitative purposes it is sufficiently representative of “relaxed” clusters. Chandra images for 25 of these clusters (or 2/3) exhibit one or more X-ray brightness edges in their cores similar to or more prominent than that in A1795. Of the 37 clusters, 18 are in the Peres et al. (1998) ROSAT list of cooling flows; among those, 14 (or 80%) have edges. Given the projection, such frequency implies that cold fronts should be present in the cores of most if not all “relaxed” clusters. Several particularly interesting examples are shown in Fig. 6 and Fig. 1 (more details will be given in Markevitch et al., in preparation).
3.2. Gas sloshing and the total mass estimates
Most cold fronts in cooling flow clusters are within kpc of the cluster center (although some, e.g., in Hydra A, are at greater distances). The gas at these small radii is not in hydrostatic equilibrium, and if one makes this wrong assumption and calculates a total enclosed mass, one would obtain an underestimate, as shown above for A1795. This should be the case for most clusters. It is at these radii where for many clusters, strong lensing indicates a 2–3 times higher mass than X-ray estimates (e.g., Miralda-Escudé & Babul 1995 and later works). Note, however, that the volume inside the radii of these edges typically contains only % of the gas within the virial radius, so this finding cannot be generalized to the whole cluster; indeed, at greater radii, there is an agreement between the lensing and X-ray masses when accurate gas temperature and density profiles are used (Allen, Schmitt, & Fabian 2002 and references therein; these proceedings).
3.3. Gas sloshing and cooling flows
Another interesting implication is related to the energetics of the cooling flows. XMM grating results (Peterson et al. 2001 and later works) showed unambiguously that the amount of cool gas in the cooling flow regions is much less than expected in the simple cooling flow models, implying that some steady source of heat balances radiative cooling. A number of explanations was proposed (e.g., David et al. 2001; Nulsen et al. 2001; Fabian et al. 2002ac; Churazov et al. 2002). Gas sloshing may provide just such a source. As the gas moves, it dissipates kinetic energy into heat. An estimate for A1795 showed that the available potential energy of the moving gas is comparable to its thermal energy, thus, in principle, such sloshing can offset radiative cooling (Markevitch et al. 2001). For the Perseus cluster, one can make a more detailed estimate, comparing the gas gravitational potential energy in the present non-equilibrium configuration (Fig. 6) w.r.t. the equilibrium distribution that the same gas would have, for example, when it settles down in the NFW potential. This energy should dissipate into heat on several free fall timescales, . An order of magnitude estimate shows that , where is the X-ray luminosity — or the radiative cooling rate — of the same central region of the cluster (Vikhlinin & Markevitch, in preparation). In a steady state process (if something continually stirs the gas), the present gas kinetic energy is of order , so there is more than enough heat being generated by the sloshing gas to compensate for radiative cooling.
The original source of this kinetic energy is a separate issue, but in Perseus, the observed asymmetric gas distribution is probably the result of the central AGN activity producing hot bubbles that are so prominent in the Chandra and even ROSAT HRI images (Böhringer et al. 1993; Fabian et al. 2002b and references therein). The AGN was proposed as the source of energy to compensate for cooling (e.g., Churazov et al. 2000, 2002; David et al. 2001; Böhringer et al. 2002). But it is an intermittent source, and the kinetic energy of the gas bulk motions may provide the necessary intermediate reservoir to release it more steadily.
3.4. Origin of gas sloshing
The cluster gas is expected to have small residual bulk velocity (streams and turbulence) from a recent merger. However, many of the clusters considered in this section do not show any traces of recent mergers — in fact, A2029 and A1795 have very symmetric gas halos on scales kpc and are the most relaxed among the nearby clusters according to some measures (e.g., Buote & Tsai 1996). Unlike the cold fronts in such mergers as A3667 and 1E0657 where the moving gas clouds have obvious underlying moving dark matter clumps, the gas in these clusters apparently sloshes by itself. Perhaps a localized gas motion in the core might be caused by a disturbance of the central gravitational potential by an infalling small subcluster. Such a disturbance would supply kinetic energy to the low-entropy gas accumulated over time in the cluster center, which is more responsive to small potential perturbations than the hotter outer gas. In the very center (), the gravitational potential of the NFW radial mass profile has a beak of the form , compared to for a profile with a core. If both the cluster and the infalling subcluster have such cuspy central profiles, it may be possible to create a localized disturbance that would last sufficiently long; simulations are needed to study this possibility.
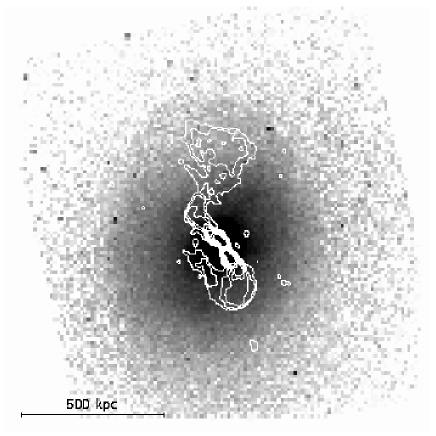
Another possible origin of the gas sloshing is hinted at by the X-ray cavities and bubbles observed in many cooling flow clusters (for a review, see McNamara 2002). In many clusters, these cavities coincide with radio lobes from the central AGN, and where they don’t, a more sensitive study reveals fainter radio lobes at the locations of the cavities (e.g., Fabian et al. 2002b). The gas is evacuated from the cavities by expanding ejecta from the AGN; the resulting bubbles then rise buoyantly and expand (e.g., Churazov et al. 2001). In a number of clusters, these bubbles are located just inside cold fronts. An example is Hydra A, whose central, bright radio lobes coincide with the X-ray cavities discovered by McNamara et al. (2000). Those radio lobes have a much larger, fainter extensions (Taylor et al. 2002, in preparation), one of which is just inside the cold front (Fig. 7). Such coincidences suggest causal relation between the gas sloshing and the bubbles (although, of course, it may simply be a coincidence — in fact, the southern radio lobe in Hydra A is bent in the presumed direction of the gas sloshing, as if the lobes are simply entrained by the moving gas). One can speculate that when the bubbles rise, they may induce bulk motion of the surrounding gas, as is indeed seen in some simulations (e.g., Quilis et al. 2001). More detailed simulations are needed to study the viability of this hypothesis.
4. Thermal conduction
4.1. Across cold fronts
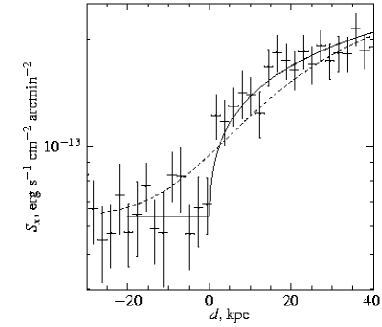
Ettori & Fabian (2000) pointed out that the observed temperature jumps in A2142 require that thermal conduction across cold fronts be suppressed by a factor of 100 or more, compared to the classical Spitzer or saturated values. Although their argument does not take into account the possibility that as the subclusters move, the heated boundary layer may be continually stripped and the temperature gradient thus continually sharpened, their conclusion should be qualitatively correct. As shown by Vikhlinin et al. (2001b) for A3667, the gas density discontinuity at the cold front is very narrow — in fact, several times narrower than the electron mean free path, as shown in Fig. 8. (In some other clusters, e.g., A2142, the front width is also unresolved by Chandra, but the data quality does not allow such accurate constraints.) This means that diffusion, and, by inference, thermal conduction, are suppressed across the front, most likely by a magnetic field parallel to the front, the same field configuration that suppresses the growth of instabilities (§2) and prevents gas stripping.
Another place where thermal conduction was estimated is the boundary between the hot cluster gas and the dense cool gas clouds observed by Chandra in the centers of two cD galaxies in Coma (Vikhlinin et al. 2001c). For these clouds to survive evaporation, conduction at their outer boundaries has to be strongly suppressed (presumably due to the disjoint magnetic field structures). Inside the clouds, conduction of order the classical value is required to maintain the observed temperature gradient.
4.2. Conduction in the bulk of the gas
Both measurements mentioned above correspond to very special places in clusters — the boundaries of different gas phases that are likely to have disjoint magnetic fields. They do not give the conduction in the bulk of the gas, which has attracted renewed attention, e.g., due to the recent works proposing that heat transport from the outer cluster regions into the cool center can offset radiative cooling if the conduction is above 1/10 of the Spitzer value (Fabian, Voigt, & Morris 2002c; also references therein).
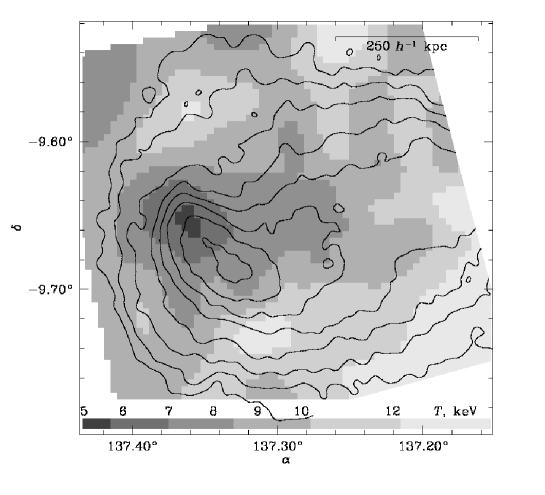
Conduction in the bulk of the gas can be estimated from the temperature maps of merging clusters, such as A754 shown in Fig. 9 (Markevitch et al., in preparation). In the absence of obvious strong shocks, the merger Mach number is near 1, which gives the timescale of a merger, yr, where is the size of the merger region and is the sound speed. The temperature map in Fig. 9 exhibits spatial variations on linear scales starting from kpc and greater. Assuming Spitzer conductivity , these small-scale nonuniformities should disappear on a timescale yr. However, they are still observed throughout the merger region and therefore should have survived for the time . This requires that conduction be suppressed by a factor from the Spitzer value.
The published Chandra temperature map of A2163 (Markevitch & Vikhlinin 2001) also gives a similar estimate of the conductivity; the recent long reobservation of A2163 will provide a more accurate constraint. In the future, a more direct measurement may come from temperature profiles across shock fronts, such as that in 1E0657.
5. Relativistic electrons and thermal gas
At radio frequencies, some clusters exhibit large, low surface brightness halos with relatively steep spectra (for recent work see, e.g., Giovannini, Tordi, & Feretti 1999 and these proceedings). They are generated by a population of ultra-relativistic electrons that emit synchrotron radiation in the cluster magnetic field. The source of such electrons that can support a cluster-size halo for a sufficient time is still unclear; several possibilities were proposed (e.g., Harris et al. 1980; Tribble 1993; Dolag & Enßlin 2000 and references therein) and extensively discussed at this conference (see, e.g., contributions by Blasi; Enßlin; Jones). A slightly favored view is reacceleration by high- merger shocks of moderately relativistic electrons that were either accelerated in the past by merger/infall shocks and/or turbulence, or produced by the interaction of cosmic ray protons with the ICM protons.
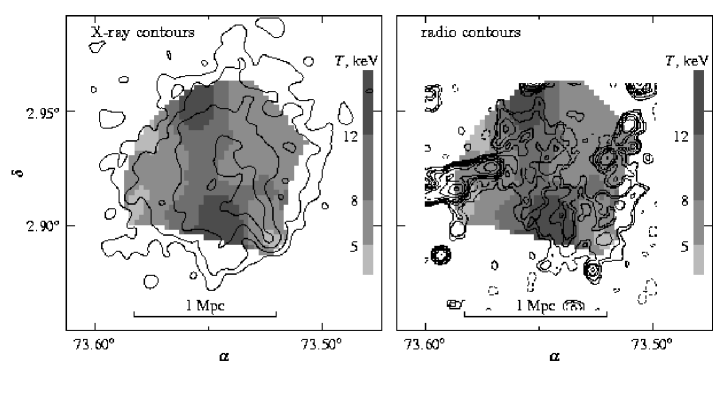
Chandra temperature maps of clusters with radio halos can provide useful data for this discussion. Maps of the mergers A2163 and A665 (Markevitch & Vikhlinin 2001) and 1E0657 (Markevitch et al. 2002) showed a correlation (although somewhat ambiguous) between the temperature and the radio surface brightness, suggesting that relativistic electrons are accelerated in merger shocks. A more convincing example of such a correlation is A520 whose temperature map is shown in Fig. 10 along with the radio contours from Govoni et al. (2001). The X-ray data indicate a merger of a small dense subcluster and a more diffuse main cluster. The subcluster appears to have left a trail of shocked hot gas, and the radio halo emission comes predominantly from that hot region.
According to the current view, shocks with are needed to accelerate the radio halo electrons (see, e.g., these proceedings). It is unlikely that in either of the above clusters the Mach number of the merger reaches such high values (except maybe in 1E0657), so these correlations are difficult to explain. However, more accurate X-ray and radio measurements for a greater cluster sample are needed to draw conclusions on acceleration mechanisms.
6. Summary
Shock fronts and cold fronts discovered by Chandra provide unique tools to study the physics of the ICM. In particular,
1. In merging clusters, we can estimate the velocity of the infalling subclusters. The cold fronts are too sharp and regular for their velocity, indicating that gas dynamic instabilities at the boundaries between the gas phases are often suppressed, most probably by specially structured magnetic fields.
2. Cold fronts are also observed in the cores of most “relaxed” clusters, showing that the dense, cool central gas in such clusters is constantly sloshing in the central potential dip. This has several interesting implications: (a) the X-ray hydrostatic method should systematically underestimate the total cluster mass inside kpc; (b) the dissipated kinetic energy of the sloshing gas is sufficient to compensate for radiative cooling and thus disrupt cooling flows. Typically, such sloshing involves only a small fraction of the total gas mass, so these findings cannot be generalized to the whole cluster.
3. Thermal conduction appears to be suppressed, compared to the Spitzer value: (a) across cold fronts, completely, which follows from the sharpness of the gas density jumps; (b) in the bulk of the gas, by a factor , from the existence of small-scale temperature variations in mergers.
Also, we find that relativistic electrons appear to concentrate in the recently shock-heated gas, even though in most clusters, the merger Mach numbers are apparently insufficient to accelerate electrons to the radio halo energies.
References
Allen, S. W., Schmitt, R. W., & Fabian, A. C. 2002, astro-ph/0205007
Bialek, J., Evrard, A., & Mohr, J. 2002, astro-ph/0207183
Böhringer, H., Voges, W., Fabian, A. C., Edge, A. C., & Neumann, D. M. 1993, MNRAS, 264, L25
Böhringer, H., Matsushita, K., Churazov, E., Ikebe, Y., & Chen, Y. 2002, A&A, 382, 804
Buote, D. A. & Tsai, J. C. 1996, ApJ, 458, 27
Churazov, E., Forman, W., Jones, C., & Böhringer, H. 2000, A&A, 356, 788
Churazov, E., Brüggen, M., Kaiser, C. R., Böhringer, H., & Forman, W. 2001, ApJ, 554, 261
Churazov, E., Sunyaev, R., Forman, W., & Böhringer, H. 2002, MNRAS, 332, 729
David, L. P., Nulsen, P. E. J., McNamara, B. R., Forman, W., Jones, C., Ponman, T., Robertson, B., & Wise, M. 2001, ApJ, 557, 546
Dolag, K., & Enßlin, T. A. 2000, A&A, 362, 151
Ettori, S., & Fabian, A. 2000, MNRAS, 317, 57L
Fabian, A. C., Allen, S. W., Crawford, C. S., Johnstone, R. M., Morris, R. G., Sanders, J. S., & Schmidt, R. W. 2002a, MNRAS, 332, L50
Fabian, A. C., Celotti, A., Blundell, K. M., Kassim, N. E., & Perley, R. A. 2002b, MNRAS, 331, 369
Fabian, A. C., Sanders, J. S., Ettori, S., Taylor, G. B., Allen, S. W., Crawford, C. S., Iwasawa, K., & Johnstone, R. M. 2001, MNRAS, 321, L33
Fabian, A.C., Voigt, L. M., & Morris, R. G. 2002c, astro-ph/0206437
Giovannini, G., Tordi, M., & Feretti, L. 1999, New Ast., 4, 141
Govoni, F., Feretti, L., Giovannini, G., Böhringer, H., Reiprich, T. H., & Murgia, M. 2001, A&A, 376, 803
Harris, D. E., Kapahi, V. K., & Ekers, R. D. 1980, A&AS, 39, 215
Kempner, J., Sarazin, C., & Ricker, P. 2002, astro-ph/0207251
Markevitch, M., et al. 2000, ApJ, 541, 542
Markevitch, M., & Vikhlinin, A. 2001, ApJ, 563, 95
Markevitch, M., Vikhlinin, A., & Mazzotta, P. 2001, ApJ, 562, L153
Markevitch, M., Gonzalez, A. H., David, L., Vikhlinin, A., Murray, S., Forman, W., Jones, C., & Tucker, W. 2002, ApJ, 567, L27
Mazzotta, P., Markevitch, M., Vikhlinin, A., Forman, W. R., David, L. P., & VanSpeybroeck, L. 2001, ApJ, 555, 205
McNamara, B. R. et al. 2000, ApJ, 534, L135
McNamara, B. R., 2002, astro-ph/0202199
Miralda-Escudé, J., & Babul, A. 1995, ApJ, 449, 18
Nagai, D., & Kravtsov, A. 2002, astro-ph/0206469
Nulsen, P. E. J., David, L. P., McNamara, B. R., Jones, C., Forman, W. R., & Wise, M. 2002, ApJ, 568, 163
Peres, C. B., Fabian, A. C., Edge, A. C., Allen, S. W., Johnstone, R. M., & White, D. A. 1998, MNRAS, 298, 416
Peterson, J. R. et al. 2001, A&A, 365, L104
Quilis, V., Bower, R. G., & Balogh, M. L. 2001, MNRAS, 328, 1091
Sun, M., Murray, S. S., Markevitch, M., & Vikhlinin, A. 2002, ApJ, 565, 867
Tribble, P. 1993, MNRAS, 263, 31
Vikhlinin, A., & Markevitch, M. 2002, Astronomy Letters, 28, 495
Vikhlinin, A., Markevitch, M., & Murray, S. S. 2001a, ApJ, 549, L47
Vikhlinin, A., Markevitch, M., & Murray, S. S. 2001b, ApJ, 551, 160
Vikhlinin, A., Markevitch, M., Forman, W., & Jones, C. 2001c, ApJ, 555, L87