Ground-Based Optical Deep Pencil Beam Surveys
Abstract
The initial results of the Deep Lens Survey (http://dls.bell-labs.com) to identify possible brown dwarfs and extremely metal poor red halo subdwarfs near the hydrogen burning limit are presented. Individual deep CCD high galactic latitude survey fields appear to offer a low probability of discovering field BD’s, but taken collectively offer an opportunity to begin addressing questions regarding the scale height and distribution of these objects. In all likelihood, the very depth of such surveys will greatly increase our knowledge of the coolest extreme halo objects, which currently are known in far fewer numbers than T dwarfs. Ultimately, the large volume surveyed by the Large Synoptic Survey Telescope will identify vast numbers of such objects, providing a more complete picture of their spatial distribution.
Drew University
Bell Laboratories, Lucent Technologies
1. Introduction
Since the early 1980’s, CCD’s have been employed on large telescopes to obtain deep images of small sections of the sky. With better than quantum efficiency ranging from the atmospheric UV cutoff to the drop in their sensitivity at , these first surveys readily reached a limiting magnitude of 26 in all of the broad bandpasses encompassed by this wavelength range. Until the mid-1990’s the 1 cm size of the CCD chip limited the area on the sky covered with each exposure to a few sq. arcmin. Consequently, the actual volume surveyed per field was very small, typically a few or tens of , up to the scale height of 325 pcs for late type disk population dwarf stars. As such, they proved an ineffective method to discover the latest M dwarfs, let alone L or T brown dwarfs with unknown scale height and local volume densities estimated to be in the range of per L or T class of objects (Liu et al. 2002). Complicating the picture was the fact that these untargeted surveys had multipurpose science drivers, often were focused at higher galactic latitudes, and employed many different filter systems.
More recent developments leading to larger CCD chips and mosaics have increased the sizes of individual deep survey fields to tens of arc minutes across, but have not significantly increased survey depth. With the success of the large area SDSS optical survey in discovering BD’s, and the marked absence of similar results from the many deeper pencil beam surveys over two decades, the latter do not appear to be a very efficient method to discover such objects. Yet despite continued limited spatial coverage, because of their increased depth, serendipitous discoveries of BD’s by existing pencil beam surveys may help to address questions surrounding the uncertainties regarding the spatial distribution of field BD’s.
2. Recent Observations
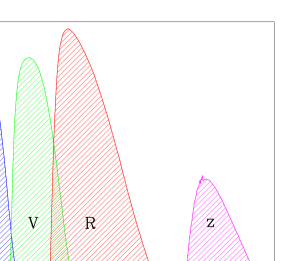
This paper will focus on the initial results of the Deep Lens Survey (DLS, http://dls.bell-labs.com). The DLS is composed of 7 “random” fields to be surveyed over a five year period, each 2 degrees on a side, selected to avoid bright stars and areas with high galactic extinction. Taken with Mosaic CCD imagers on NOAO’s Blanco and Mayall Telescopes, each field is split into a 3x3 array of roughly 35 sq. arcmin Mosaic-size subfields (0.257 arcsec per pixel) called p11 through p33. These subfields are imaged in four bands: B, V, R and z’. See Fig. 1 for the combined filter plus CCD plus telescope response curves. Twenty 600 second exposures are obtained in each of the B, V, and z’ filters, with twenty 900 second exposures in the R filter. We estimate limiting magnitudes (Vega) for 5 sigma stellar detection in 1 arcsec seeing of 26.3 in B, 26.4 in V, 26.5 in R and 24.1 in z’, with seeing to date averaging 0.8 arcsec in R and 1.0 arcsec in the other filters.
The data reduction has been completed for several subfields and is available for public access at the DLS web site listed previously. This site contains information regarding the survey specifics (such as field coordinates, completeness, etc), matched catalog 2.5 arcsec aperture magnitudes produced by SExtractor (version 2.1.6) for objects detected in each released subfield, as well full images in each filter for download, and the tools for analysis. One of our survey fields overlaps one in the NOAO Wide Deep Survey (Tiede et al. 2002) and will have K-band coverage also.
2.1. Initial Results in Detection of Brown Dwarfs
We have completed the data reduction and analysis of two 1600 sq. arcmin subfield areas, F1p22 (, ) and F4p22 (, ) to search for BD candidates as well as red halo subdwarfs at/near the hydrogen burning limit. Using average absolute magnitudes for L and T dwarfs obtained from Dahn et al. (2002), we estimate that we could detect early L dwarfs ( or greater) out to a distance of 410 pc, mid L dwarfs ( or greater) out to 140 pc, and T dwarfs () out to 90 pcs. By way of comparison, using the SDSS z* (AB mag) detection limit of 20.3 alone, the SDSS limiting distances fall to roughly of our values. Searching our images for stellar BVR dropouts (i.e. detected in a z’ image alone) should more than double our line of sight distance.
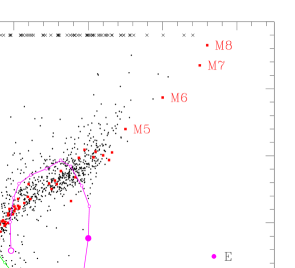
Fig. 2 presents the vs. data for all objects in the F4p22 subfield morphologically classified as stellar using an algorithm based on the out-of-roundness deviations. Similar results are obtained for F1p22. Those objects which are too faint for detection in the bluer band have been indicated by a small at their given color along the top of the plot. The filled large squares represent Gunn-Stryker spectrophotometric standards, with additional notations to indicate the approximate positions of M5, M6, M7, and M8 dwarfs. The tracks reflect expected evolution and K-corrections for elliptical (circle), irregular (triangle), and Sb+Sc (diamond) galaxies with increasing redshift (steps of are indicated by filled symbols, starting with the large open symbol at ) based on spectral energy distribution templates from Bruzual and Charlot (1993). These are shown to indicate regions free of contamination by compact high redshift galaxies, a point which will be especially important in searching for red halo subdwarfs near the hydrogen burning limit. Note that QSO’s of increasing redshift fall well blueward of the stellar locus.
We discovered no objects with colors indicative of BD’s, i.e. and . Such objects are probably too faint to be detected in , let alone . Furthermore, assuming that some BD’s would be too faint in our R band for detection, a check was made in each field for stellar-like objects which dropped out of the R, V, and B images. To an R limit of 26.5 mag, we typically find galaxies and 2,000 to 3,000 stars per subfield. We detect approximately 7,000 BVR dropout objects in each subfield, only 10 of which are stellar. Upon closer individual inspection, none of these appeared to be good BD candidates. Though the DLS subfields cover slightly more area, go roughly as deep, and had similar seeing to the IfA Deep Survey subfields (Liu et al. 2002), we detect no brown dwarf candidates; while they discovered one T dwarf in their first field. At a mag and , such an object would have been easily detectable by the DLS. No additional detections have been reported (Liu 2002b) even though both surveys cover a similar range of galactic latitude.
In a similar survey covering a much smaller area, comparable results for late M dwarfs were found by Boeshaar and Tyson (1986). No stars with (equivalent to ) were discovered in twelve 12 sq. arcmin deep CCD fields. Yet in one high latitude 40 sq. arcmin field Boeshaar et al. (1994) detected six M dwarfs ranging from dM6 to dM8-9. Furthermore, the late dM’s all appear to be located within an area of less than 20 sq. arcmin. Few surveys report null results when searching for objects with low probability of detection. Often only the serendipitous discoveries are announced. Our cursory evaluation of late dM, L, T stars found in similar deep CCD surveys lends support to the contention that small area high galactic latitude pencil beam fields have a low probability of discovering large numbers of stars at or below the tail end of the main sequence.
2.2. Detection of Cool Halo M Subdwarfs
All extremely red field halo subdwarfs have been identified initially from photographic high proper motion surveys. To date, there are only 4-5 extremely metal poor subdwarfs with known (Gizis 1997, Gizis and Reid 2002). These objects would be the best candidates to have masses near the halo hydrogen burning limit. Large uncertainties remain both theoretically and observationally regarding the relations between mass, metallicity, and color for these stars. Consequently, very large uncertainties in the number density of such objects exist (Hawley and Gizis 2000). Do red subdwarfs exist at , comparable to the most metal poor hotter subdwarf population (Beers et al. 1998)? Answers to these questions will be important to understanding the early history of low mass star formation in our Galaxy. While the initial surveys have sampled only the immediate solar neighborhood, i.e. out to approximately 100 pc, very deep multicolor CCD surveys are ideally designed to sample the halo out beyond 1 kpc for the intrinsically faintest subdwarfs, and beyond 3 kpc for objects of Mv.
Dahn et al. (1995) have demonstrated that extremely metal poor M subdwarfs (esdM’s) appear well-separated from disk M dwarfs by more than 0.5 mag in the vs. color plane. Observing M dwarfs of known metallicity, Gullixson et al. (1995) show a similar effect using the broad band , and bands of a deep 4-meter CCD survey. This population separation is most noticeable between B and other filters due to the effects of differential molecular oxide blanketing in the V, R, I and z’ filters in comparison to the B band, which is dominated by atomic lines. Conversely, the color is an inaccurate temperature index for M dwarfs. With reduced molecular blanketing of the spectra, one expects M subdwarfs to fall closer to the black body line in broad band color plots. In Fig. 2, esdM’s of fall in a region from , with , well above the colors of the M disk population.
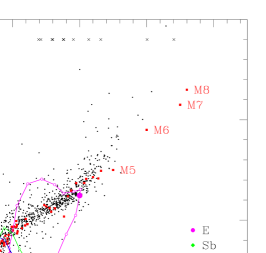
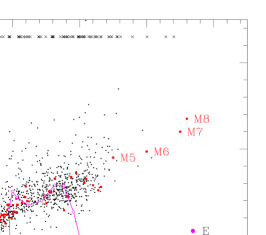
Since a metallicity gradient exists among the M dwarfs, extending from young disk to extreme halo (Hartwick et al. 1984), we would expect to see a continuous distribution of stars in or for a given red color index, as shown. Note in Fig. 3, which plots vs. for the same F4p22 subfield, that without B magnitudes it is more difficult to distinguish among the M main sequence () population classes than in Fig. 1. Here, changes in molecular blanketing with decreasing metallicity affect both V and R almost equally at a given temperature. In the vs. plot of Fig. 4 for our F4p22 subfield, the separation among the M dwarf distribution becomes more pronounced as expected.
To address the question of contamination of the ground-based colors used to identify red subdwarfs by an unresolved population of high red shift elliptical galaxies at faint magnitudes (Reid et al. 1996), we have superimposed the redshift-evolutionary plots of several galaxy types on all of our color-color plots. The elliptical galaxies fall well below the esdM regime in Fig 1; and they fall among the disk population M dwarfs in Fig.3. Thus negligible galaxy contamination should be encountered in the region where the extreme M subdwarfs are located. In a previous deep CCD survey, Tyson and Boeshaar (1997) found that the six identified subdwarf candidates lay within the numbers expected, extrapolating from the luminosity function of Dahn et al. (1995, 1996). Follow-up multi-slit spectroscopy on three of these candidates using the CTIO 4-meter confirmed their identity as M subdwarfs. The combination of accurate predictions of galaxy colors, B filter data, plus careful analysis of the point spread function in our color images indicates that we should be able to identify M-type halo subdwarfs with confidence even at our faint magnitude limits.
3. Discussion
Very deep multicolor pencil beam surveys provide a rich data base which can be utilized to provide information on the scale height distribution of field brown dwarfs and more accurately define the luminosity function of lowest mass stellar halo population. Though each individual mosaiced CCD subfield in itself offers a low probability of detection, the combined data from larger abutted areas, such as those covering 4 sq. deg. in the DLS, should allow for a meaningful sample of objects to be evaluated. Using each for the local volume density of L and T dwarfs as estimated by Liu (2000), we might expect to find T dwarfs and L dwarfs in each 4 sq. degree DLS field when our survey in completed. This assumes detection in and a uniform spatial distribution with a vertical scale height of no more than 200 pcs. Reducing the scale height to 100 pcs lowers the expected number of L dwarfs by a factor of 8. If we simply search for stellar objects which drop out of all bands except z’, then the number of T dwarfs per field should drop from (indicating a scale height pc) to about 4 (scale height pcs). Whereas only a relative handful of the coolest halo subdwarfs have been identified to date using other techniques, carefully analyzed deep CCD observations including B band data should discover in one DLS field numbers of very red esdM’s similar to those currently known. Extrapolating from the luminosity function of Dahn et al. (1995, 1996), we expect to find at least 4 extreme subdwarfs similar to LHS 1742a (esdM 5.5) or LHS 1826 (esdM6) per each LHS field and 15 stars similar to LHS 453 (esdM3.5). The observations for esdM’s should prove equally important as the search for additional L and T dwarfs since we know far less about the coolest halo population.
When the 30 sq. degree DLS is finished, more will be known about these subluminous halo objects and field BD’s. The problem with current pencil beam surveys is that the numbers of halo stars found do not permit cutting the sample in multiple ways, testing their distribution with galactic coordinates, etc. Enabled by a confluence of optics and microelectronics advances, the proposed Large Synoptic Survey Telescope (, http://lsst.org), will produce a large volume optical multi-color survey of sq. degrees to magnitude. Completion of the facility is expected by 2012, and the data will be public. Image quality is expected to be as good or better than the current generation of new technology telescopes ( fwhm), and each field of the sky will be covered hundreds of times, permitting proper motion studies and enhanced rejection of galaxies due to the low surface brightness achieved. Moreover, due to higher quantum efficiency at , the filter set will most likely include an additional filter near this spectral region, complementing the SDSS filter set. The combination of broad area coverage, survey depth and increased near IR sensitivity will allow for a direct determination of the local disk distribution of field brown dwarfs. Furthermore, the will create a sample of thousands of subluminous halo stars, probing deep into the halo as well as spanning the full range of galactic coordinates. The role of these stars in the evolution of the structure of our galaxy will then be more apparent.
Acknowledgments.
The DLS data are taken on the 4-meter Blanco and Mayall telescopes, operated by the National Optical Astronomy Observatories (NOAO). NOAO is operated by the Association of Universities for Research in Astronomy (AURA), Inc., under Cooperative Agreement with the National Science Foundation.
References
Beers, T.C., Rossi, S., Norris, J.E., Ryan, S.G., Molaro, P., Rebolo, R. 1998, Space Science Reviews, 84, Issue 1/2, 139
Boeshaar, P.C., Tyson, J.A., Seitzer, P.O., 1986, Dark Matter in the Universe, G. Knapp and J. Kormendy eds. (Dordrecht, Reidel), 32
Boeshaar, P.C., Tyson, J.A., Bernstein, G. 1994, A.S.P. Conf. Ser., 64 ed. J.P. Caillault, 64
Bruzual, G., Charlot, S. 1993, ApJ405, 538
Dahn, C.C., Liebert, J.W., Harris, H.,Guetter, H.C. 1995, in The Bottom of the Main Sequence and Beyond, ed. C.J. Tinney, Springer, Heidelberg, 239
Dahn, C.C. 1996, private communication.
Dahn, C.C., Harris, H.C., Vrba, F.J. et al. 2002, AJ, in press (astro-ph/0205050)
Gizis, J. E. 1997, AJ, 113, 806
Gizis, J.E., Reid, I.N. 2002, PASP, 112, 610
Gullixson, C.A., Boeshaar, P.C., Tyson, J.A. 1995, ApJS, 99, 281
Hartwick, F,D.A., Cowley, A. P. , Mould, J. R. 1984, ApJ, 286, 269
Liu, M.C., Wainscoat, R., Martin, E.L., Barris, B., Tonry, J. 2002a, ApJ, 568, L107
Liu, M.C., 2002b, private communication.
Reid, I.N., Yan, L., Majewski, S., Thompson, I., Smail, I. 1996, AJ, 112, 1472
Reid, I.N., Hawley, S.L., 2000, New Light On Dark Stars: Red Dwarfs, Low Mass Stars, Brown Dwarfs, 436
Tiede, G.P., Dey, A., Jannuzi, B.T., Brown, M.J.I., Ryan, E., Najita, J.R. 2002, BAAS, 33, 1487
Tyson, J. A., Boeshaar, P.C. 1997, Proceedings of Dark Matter ’96: The Physics of Dark Matter, ed. N. Spooner, World Scientific, 164