GMRT and VLA observations of H i and OH from the Seyfert galaxy Mrk 1
We present Giant Meterwave Radio Telescope (GMRT) observations of the H i 21 cm line and Very Large Array (VLA) observations of the OH 18 cm line from the Seyfert 2 galaxy Mrk 1. H i emission is detected from both Mrk 1 and its companion NGC 451. The H i emission morphology and the velocity field of Mrk 1 are disturbed. We speculate that the nuclear activities of Mrk 1 are triggered by tidal interactions. We estimate the H i masses of Mrk 1 and NGC 451 to be M⊙ and M⊙ respectively. We have also detected the H i 21 cm line and the OH 18 cm line in absorption toward the nucleus of Mrk 1 at a blueshifted velocity with respect to its systemic velocity indicating an outflow of atomic and molecular gas. Two OH lines, at 1665 and 1667 MHz, are detected. Each of the profiles of the H i and OH absorption consists of two components that are separated by 125 km s-1. Gaussian fitting gave dispersions of km s-1 for both the components of the H i absorption. The profile of the OH absorption is qualitatively similar to that of the H i absorption. Both components of the OH absorption are thermally excited. The peak optical depths of the two components of the H i absorption are and . The corresponding peak optical depths of the 1667 MHz OH absorption are and . The higher velocity components of the H i and OH (1667 MHz) absorption lines are blueshifted from the [O iii], [O i], and the systemic velocity by 100 km s-1, but are consistent with the [O ii] velocity. We explain these velocity discrepancies as due to shock ionization of a region which is pushed forward due to shocks in front of the radio nucleus thereby giving apparent blueshift to H i, OH, and [O ii] velocities. The optical depth ratios of both the components of the H i and OH absorption are 3, indicating their origin in dense molecular clouds. Using OH/Av values for the Galactic molecular clouds, we obtain 9 A 90 toward the line of sight of Mrk 1.
Key Words.:
galaxies: active – galaxies: interactions – galaxies: individual (Mrk 1, NGC 451) – galaxies: ISM1 Introduction
Both the AGN and the nuclear starburst activities in galaxies which require inflow of material toward the centre either to fuel the central black hole or to cause rapid burst of nuclear star formation can be accomplished by tidal interactions (Hernquist & Mihos (1995)). It is not clear, however, in the case of Seyfert galaxies whether nuclear activities in these low luminosity active galactic nuclei (AGN) are due to interactions as found in QSOs, radio galaxies, and BL Lacs (see De Robertis et al. (1998) for a review on the subject). It is generally accepted that interactions leading to mergers (bound interactions) may play a significant role in triggering nuclear activities than unbound or hyperbolic encounters (De Robertis et al. (1998)). Interactions can be effectively traced via H i 21 cm line emission from galaxies as H i disks often extend well beyond the optical radii of galaxies where the disks respond quickly to gravitational perturbations. H i emission studies may be particularly useful since most often the H i morphology provides evidences of interactions which are undetectable at optical wavelengths (e.g., Simkin et al. (1987)).
H i in absorption can trace kinematics and distribution of atomic gas near the centres of active galaxies on the size scales of their background radio sources. The advantage of absorption studies is that it can detect relatively small quantities of gas irrespective of the redshift of the object. Recently, Gallimore et al. (1999) have found H i rich absorbing disks on the scales of a few hundred parsecs in several Seyfert galaxies. As a result of intense nuclear activities, gas in the central regions of active galaxies may be perturbed due to interactions of the radio plasma with the surrounding ISM which may result in bulk outflows of material (e.g., Tadhunter et al. (2001), Morganti et al. (1998)). The molecular gas near the centres of active galaxies can be traced via 18 cm OH line in absorption. The 18 cm OH absorption line is sensitive to molecular gas in both the diffuse ISM and in the dark clouds with OH to H2 ratio being almost constant over a large variety of Galactic clouds (Liszt & Lucas (1996)). Studies have shown that chances of detecting OH absorption are higher in infrared luminous galaxies (Schmelz et al. 1986).
In this paper, we present synthesis observations of the H i 21 cm line obtained with the GMRT and the OH 18 cm line obtained with the VLA of the infrared luminous active galaxy Mrk 1 and its companion NGC 451. The global properties of Mrk 1 are summarized in the next section. The details of observations and data analyses are given in Sect. 3. The results are presented in Sect. 4. Sect. 5 discusses the radio continuum properties, H i emission, and H i and OH absorption. The conclusions are in the last section.
2 Global properties of Mrk 1
| Parameter | Value | Reference |
|---|---|---|
| Right Ascension (J2000) | 1 | |
| Declination (J2000) | 33°05′22″ | 1 |
| Distance (Mpc) | 68 | 2 |
| Hubble type | SB O/a | 1 |
| Seyfert type | 2 | 1 |
| Inclination | 45° | 3 |
| Optical diameter (kpc) | 1 | |
| Corrected blue magnitude B | 14.53 | 4 |
| Total blue luminosity (L⊙) | ||
| Total H i mass (M⊙) | 5 | |
| H i mass to blue luminosity ratio (M⊙/L⊙) | 0.07 | 5 |
| Total FIR luminosity (L⊙) | 6 | |
| 1.4 GHz radio luminosity (W Hz-1) | 5 | |
| Spectral index (S) (2.7 GHz – 10.5 GHz) | 0.8 | 7 |
| X-ray luminosity (erg s-1) | 8 | |
| Systemic velocity (km s-1) | 47802 | 9 |
| 5007 velocity (km s-1) | 482225 | 10 |
| 3727 velocity (km s-1) | 469725 | 10 |
| 6300 velocity (km s-1) | 481725 | 10 |
| Mean velocity of H i emission (km s-1) | 4780 | 5 |
| H2O maser velocity (km s-1) | 3 | |
| Mean velocity of CO emission (km s-1) | 4850 | 11 |
| Notes: H0 = 75 km s-1 Mpc-1. The velocity definition is optical and Helio-centric. | ||
| 1: Markarian et al. (1989); 2: White et al. (1999); 3 Braatz et al. (1997); 4: NED (NASA Extra-galactic Database); 5:This paper; 6:IRAS faint source catalog, (1990); 7: Dickinson et al. (1976); 8: Fabbiano et al. (1992); 9: Keel (1996); 10: De Robertis & Shaw (1990) 11: Vila-Vilaro et al. (1998) | ||
The global properties of Mrk 1 are listed in Table 1. Mrk 1 (NGC 449; B = 14.53) is a member of a poor group (WBL 035) at a redshift of 0.017 (White et al. (1999)). The other two members of this group viz., NGC 447 and NGC 451, are at projected separations from Mrk 1 of 38 kpc and 130 kpc respectively. Mrk 1 is classified as a SB O/a galaxy with a Seyfert type 2 nucleus (Markarian et al. (1989)) with no signatures of interactions in the optical images. Mrk 1 is also a luminous Infrared galaxy (LL⊙), indicating a high rate of star formation. Mrk 1 is one among 16 galaxies detected in the 22 GHz water megamaser emission in a sample of 354 active galaxies (Braatz et al. (1994)). The nuclear optical spectrum of Mrk 1 studied by Koski (1978) and Weedman et al. (1968) shows strong emission lines typical of an active galaxy photo-ionized by hard continuum. The broad lines indicative of a hidden Seyfert nucleus are not found either in the infrared (Veilleux et al. (1997)) or in the polarized light (Kay et al. (1994)). High dispersion spectroscopic observation of the [O iii] line by Bergeron & Durret (1987) shows a distinct blue asymmetry indicative of an outflow of gas. Keel (1996) suggested that the nuclear activities of Mrk 1 are due to an ongoing interaction with the nearby galaxy NGC 451.
The radio continuum emission from Mrk 1 is known to have a steep spectrum with a spectral index (S) of 0.8 (Dickinson et al. (1976)). The 1.6 GHz EVN image (resolution 30 pc) of Kukula et al. (1999) shows the nuclear emission to consists of an unresolved core surrounded by a weak diffuse emission with a total flux density of 34 mJy. The NVSS flux density at 1.4 GHz is 75.4 mJy
The Arecibo observations by Hutchings (1989) detected H i emission and blueshifted H i absorption from Mrk 1. This single dish spectrum could not separate H i emission from Mrk 1 and NGC 451. Observations with the Nobeyama Radio Telescope detected CO (J = 1–0) emission with a total flux integral of K km s-1 from the central 5 kpc region of Mrk 1 (Vila-Vilaro et al. (1998)). The search for the 18 cm OH absorption by Schmelz et al. (1986) with the Arecibo reflector resulted in a non-detection with an rms sensitivity to an optical depth of 0.02.
3 Observations and data analyses
3.1 The GMRT observations
| Parameter | GMRT | VLA |
|---|---|---|
| Dates of Observations | 2000 Oct 25, 28 | 2001 Mar 26, 27 |
| Pointing centre (RA J2000.0) | ||
| Pointing centre (Dec J2000.0) | +33°05′222 | +33°05′222 |
| Observing duration (hrs) | 8 | 4.5† |
| Range of baselines (km) | 0.1–25 | 0.1–11 |
| Observing frequency (MHz) | 1395.00 | 1640.22 |
| Bandwidth per IF (MHz) | 8.0 | 6.25 |
| Number of spectral channels | 128 | 128 |
| Polarizations | 2 | 1 |
| Frequency resolution (kHz) | 62.5 | 48.8 |
| Velocity resolution (km s-1) | 13.7 | 9.0 |
| Amplitude calibrator | 0137+331 | 0137+331 |
| Phase calibrator | 0137+331 | 0137+331 |
| Bandpass calibrator | 0137+331 | 0137+331 |
| † Usable time, see section 3.2 for details |
The GMRT observations of Mrk 1 were carried out in October, 2000. A summary of the main observational parameters are given in Table 2. At the time of the observations, the GMRT was not fully operational and hence not all 30 antennas were available for observations at any given time. Two runs of observations with 18–20 antennas, each with a field of view (FWHM) 24′ centered on Mrk 1, were carried out on two different days. The GMRT has a mix of both short and long baselines (see Swarup et al. (1991) for more details), making it sensitive to diffuse emission of extent as much as while having a maximum resolution of at 1.4 GHz. The GMRT uses a 30-station FX correlator which produces complex visibilities over 128 spectral channels in each of the two polarizations. The bandwidth can be selected in multiples of 2 between 62.5 kHz and 16 MHz. These observations were carried out with a bandwidth of 8 MHz centered at 1395.0 MHz, which covered H i velocities in the range km s-1 with a velocity resolution of 14 km s-1.
The complex gains of the antennas were determined every 30 minute using observations of an unresolved nearby () source (3C 48) for 5 minutes. 3C 48 was also used for the flux and the bandpass calibrations. The data were reduced, following standard calibration and imaging methods, using the Astronomical Image Processing Software (AIPS) developed by the NRAO. The data were calibrated for the amplitude, phase, and frequency response for all antennas separately for each polarization. The flux density of 3C 48 was estimated to be 16.228 Jy at the observing frequency using the 1999.2 VLA flux densities of the standard VLA flux calibrators and the formula given in the AIPS task ‘SETJY’. Due to the close proximity of 3C 48 to Mrk 1 and based on some previous test experiments, we expect that the flux calibration is accurate to within 5%.
A continuum data set was formed by averaging 80 line-free channels. The data were self calibrated in both phase and amplitude. The resulting antenna gain corrections were applied to all channels. The continuum images were made using the self-calibrated averaged data from the line-free channels. The continuum flux density from each individual channel was subtracted in the (u,v) dataset by a linear fit to the visibilities in the line-free channels. Since these observations were also sensitive to H i emission, the data points were “natural-weighted” to enhance sensitivity to extended features. The resulting spectral cubes were CLEANed for signals greater than 4 times the rms noise in the channel images. The cube was blanked for emission below a level of 1.5 in the images after applying a Hanning smoothing of three velocity channels and Gaussian smoothing of five pixels (pixel size = 6″) in the spatial co-ordinates. The zeroth and first order moment maps were generated from the blanked channel images containing H i emission and two additional channels on both the sides.
3.2 The VLA observations
The VLA ‘B’ configuration observations were carried out in March, 2001. The observational parameters are summarized in Table 2. The data were recorded in the 1A correlator mode with a total bandwidth of 6.25 MHz divided into 128 channels. These observations covered a velocity range of km s-1 for the 1667 MHz line of OH with a velocity resolution of 9 km s-1. These observations also covered the 1665 MHz line of OH in the velocity range of km s-1. A large fluctuation in the system temperature was noticed on the first day of observations which were carried out at a centre frequency of 1640.5 MHz. These fluctuations were later identified as due to strong signals from a external interfering source operating near the frequency of observations. The observations on the next day were carried out after reducing the front-end bandwidth from 25 MHz to 12.5 MHz and shifting the centre of the band to 1640.22 MHz to avoid the external interference. The data from the first day of observations were discarded.
The VLA observations and data analyses were carried out following the same strategy as adopted for the GMRT observations described in section 3.1. The flux density of 3C 48 was estimated to be 14.270 Jy at the observing frequency. The image cube was generated using “natural-weighted” continuum-free data to get maximum signal to noise ratio. The image cube was box-car smoothed along the frequency axis using a window of 3 channels and every second channel was discarded. The resulting image cube has a resolution of km s-1. The continuum images were made using the self-calibrated averaged data from the line-free channels.
4 Results
4.1 Radio continuum


The radio continuum images shown in Fig. 1 have a resolution of at 1.4 GHz, and at 1.6 GHz. These images were made using only short (u,v) spacings to enhance the sensitivity to extended features. These images have an rms of mJy beam-1 at 1.4 GHz, and mJy beam-1 at 1.6 GHz. Continuum emission is detected from both Mrk 1 and NGC 451. NGC 447 is marginally detected () at both 1.4 and 1.6 GHz. The flux density of Mrk 1 is estimated to be mJy at 1.4 GHz, and mJy at 1.6 GHz. The spectral index between 1.4 and 1.6 GHz is 0.8. The flux density of NGC 451 is mJy at 1.4 GHz and mJy at 1.6 GHz. Mrk 1 remains unresolved down to a resolution of kpc.
4.2 H i emission


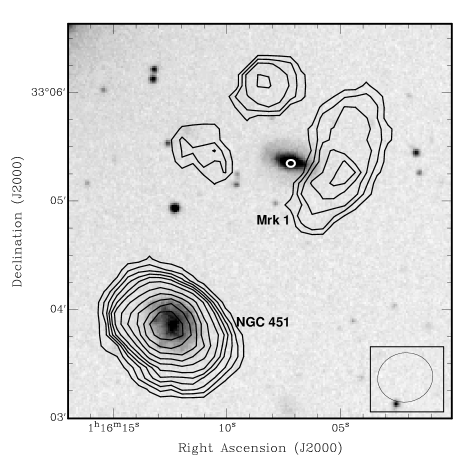
The H i cube was made with a resolution of km s-1. The channel images have an rms of 0.92 mJy beam-1. The corresponding 3 sensitivity in H i column density is cm-2. The channel images of H i emission and absorption are shown in Figs. 2 and 3. The results are summarized in Table 3. H i emission is detected in the velocity range of 4698 to 4984 km s-1. H i emission from Mrk 1 appears from 4698 to 4848 km s-1. The flux integral () of H i emission in this range is Jy km s-1 which at the distance of Mrk 1 corresponds to a total H i mass of M⊙ for Mrk 1. The estimated HI mass is a lower limit due to the effects of absorption. H i emission from NGC 451 is detected from 4807 to 4984 km s-1 with a total flux integral of Jy km s-1 corresponding to a H i mass of M⊙ assuming a distance to NGC 451 of 68 Mpc. The summed flux integral of Mrk 1 and NGC 451 is Jy km s-1, which is consistent with the value obtained by the single dish observations of Hutchings (1989). See Fig. 4 for a global H i profile.
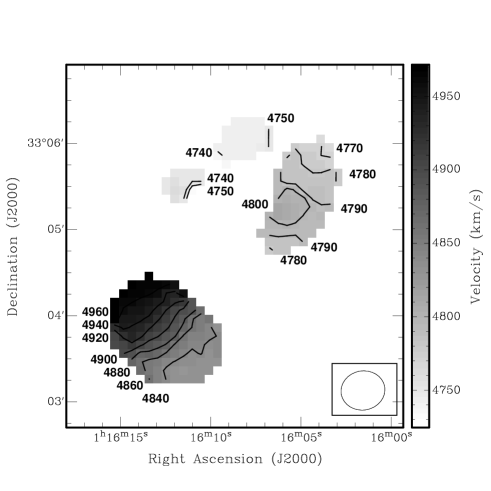
The moment zero map shown in Fig. 5 indicates that the H i emission from Mrk 1 is distributed in three clumps with almost all H i seen outside the optical extent of Mrk 1. The individual clumps having velocity dispersions of 30 to 60 km s-1 are distributed over an extent of kpc. The velocity field of Mrk 1 shown in Fig. 6 indicates that there is a smooth rotation of H i from one end to the other.
The H i emission from NGC 451 shown in Fig. 5 looks like that of a disk galaxy with a total projected velocity width of 170 km s-1. The H i diameter of NGC 451 is 20 kpc which is about twice that of the optical disk. The global parameters of NGC 451 given in Table 3 were derived from a fit to the velocity field made using a higher resolution () H i cube which is not shown here.
| Parameter | Mrk 1 | NGC 451 |
|---|---|---|
| S (mJy) | ||
| S (mJy) | ||
| V (km s-1) | 120 | 170 |
| Systemic velocity (km s-1) | ||
| Maximum rot. velocity (km s-1) | – | |
| Inclination (degree) | – | |
| H i extent (kpc) | ||
| dV (Jy km s-1) | ||
| H i mass (108 M⊙) | ||
| : Estimated from the mean velocity of H i emission | ||
| : Estimated from a fit of curves of constant velocities to the H i velocity field | ||
4.3 H i absorption


The channel images shown in Fig. 3 also show H i absorption from Mrk 1 (dotted contours at the location of Mrk 1) in the velocity range 4589 km s-1 to 4752 km s-1. The H i absorption spectrum shown in Fig. 7 is extracted at the radio position of Mrk 1 from a H i cube made with a resolution of km s-1. The rms in this cube was 0.6 mJy beam-1. The spectrum shows a broad multi-component absorption in between the velocities 4500 km s-1 and 4800 km s-1. Two Gaussian components were fitted to the H i absorption profile. The resulting parameters of the fit are given in Table 4. The peak optical depths of the two components are and respectively and the velocity dispersions are 44 km s-1 for both the components. The column density of H i is estimated using the relation cm-2; where is the spin temperature of H i in kelvin, is the covering fraction of H i gas, is the velocity integrated optical depth in km s-1. We assume to be unity. is an unknown quantity and we adopt a value of 100 K, typical of cold clouds in our Galaxy. The H i column densities are then cm -2 and cm -2 for the two components respectively.
| Parameter | H i | OH(1667) | OH(1665) |
|---|---|---|---|
| (km s-1) | |||
| (km s-1) | |||
| (km s-1) | |||
| (km s-1) | 43.4 |
4.4 OH absorption
The OH spectrum shown in Fig. 8 was extracted at the radio position of Mrk 1 from the image cube made using the VLA data with a resolution of km s-1. The cube has an rms of 0.5 mJy beam-1.
The velocity axis of Fig. 8 corresponds to the 1667 MHz OH line. In this velocity system, the 1665 MHz line will appear at +360 km s-1 from the 1667 MHz line. Since the spectrum of Fig. 8 does not have enough baseline for the 1667 MHz line and not enough signal to noise ratio for both the 1665 MHz line to get reliable estimates for velocity dispersions of individual components, only peak optical depths and center velocities were fitted while the velocity dispersions were fixed at those values found in fitting the H i absorption profile. This is a reasonably good assumption since both the 1665 and 1667 MHz profiles are qualitatively similar to the H i absorption profile. This procedure gave a reasonably good, though not unique, fit to the OH spectrum. The fitted parameters are given in Table 4.
The peak optical depths of the two components of the 1667 MHz absorption are and respectively. The column density of OH is estimated using the relation cm-2; where is excitation temperature which is assumed to be 10 K and is the velocity integrated optical depth of the 1667 MHz line in units of km s-1. The OH column densities are estimated to be cm-2 and cm-2. The peak optical depth ratio of the stronger OH component is , indicating that this component is excited under LTE conditions – the ratio is predicted to be in between 1.0 and 1.8 for LTE excitations. This ratio for the weaker component, viz., indicates that this is also most likely thermally excited.
5 Discussion
5.1 Interaction of Mrk 1 with NGC 451
The disturbed H i morphology of Mrk 1 (Fig 5) indicates a gravitational interaction possibly with the nearest companion NGC 451. We explore this possibility using the two body interaction described in Binney & Tremaine (1987). The dynamical masses of galaxies are estimated using rotation curves. Since the H i morphology of Mrk 1 is disturbed, it was not possible to obtain a reliable H i rotation curve. We used the H rotation curve of Mrk 1 (Keel 1996). The dynamical mass of NGC 451 was estimated using the H i rotation curve. The dynamical masses of Mrk 1 and NGC 451 are M⊙ and M⊙ respectively. The interaction parameters are listed in Table LABEL:tab:int.
| Parameter | Value |
|---|---|
| Projected velocity difference (km s-1) | 117 |
| Projected separation (kpc) | 38 |
| Total dynamical mass (M⊙) | |
| Tidal radius (Mrk 1) (kpc) | 24 |
| Tidal radius (NGC 451) (kpc) | 29 |
| Impact parameter | |
| Dynamical friction time (Gyr) | 0.2 |
| Orbital time (Gyr) | 2.0 |
The projected velocity difference between Mrk 1 and NGC 451 of 117 km s -1 indicates a minimum dynamical mass of this pair to be M⊙. This value of dynamical mass is in close agreement with the dynamical masses of Mrk 1 and NGC 451, indicating that Mrk 1 and NGC 451 are most likely in a bound system. Tidal radii (cf. eq. 7-84, Binney & Tremaine 1987) for the given masses of Mrk 1 and NGC 451 indicate that the outer regions of the H i disk of Mrk 1 can be perturbed easily. The dynamical friction time scale (cf. eq. 7-26 and 7-13b, Binney & Tremaine 1987) of Gyr for this system is much smaller than their orbital time scale of 2 Gyr. This implies that the interaction is bound and will lead to a merger within a small fraction of the orbital time period of the two galaxies.
5.2 Comparison of H i and OH velocities with other velocity systems
From the comparison of the H i and OH absorption velocities of Mrk 1 with the optical line velocities listed in Table 1, it appears that the higher velocity components of the H i and OH absorption are consistent with the [O ii] line velocity, but are blueshifted by 100 km s-1 from the [O iii], [O i] and the systemic velocity. We explain this discrepancy in terms of co-existence of photo-ionized and shock ionized gas in active galaxies. The [O iii] line is primarily due to excitation from a hard continuum, and therefore, should be arising close to the nucleus. The [O ii] line intensity is enhanced in shock ionized regions (Dopita & Sutherland (1995)). Most often, optical line profiles are asymmetric and only peak line velocities are quoted without fitting a line profile. Mrk 1 is known to be such a case (Bergeron & Durret 1987, Dickinson et al. (1976)). Such an analysis of the optical spectrum may bias the line velocities of different species toward different regions, e.g., the peak of the [O ii] line may indicate a region which is shock ionized while the [O iii] line velocity may indicate gas which is close to the nucleus. We speculate that the higher velocity H i and OH absorption component in Mrk 1 arises in a region which is pushed forward due to shocks, thereby giving an apparent blueshift to H i, OH, and [O ii] lines. The fact that the [O i] line velocity is close to the [O iii] line velocity, and hence associated with photo-ionized regions, is not surprising since the [O i] line intensity is suppressed in the shock excited regions (Dopita & Sutherland (1995)).
The water megamasers are seen from Mrk 1 at a velocity of 4868 km s-1 (Braatz et al. (1994)). Since these masers are redshifted by 90 km s-1 from the systemic velocity of the galaxy, they are most likely the high velocity “satellite” features commonly seen in water megamaser galaxies (Braatz et al. (1997)) and thought to originate in the accretion disks near the nuclei (Neufeld et al. (1994)). Since the observed H i and OH absorption velocities in Mrk 1 are blueshifted from both the water megamaser velocity and from the systemic velocity of the galaxy, the absorption in the present case is most likely not related either to the gas in the accretion disk or to the torus close to the nucleus. The mean velocity of the CO emission from Mrk 1 is 4850 km s-1 (Vila-Vilaro et al. (1998)), which is redshifted by 150 km s-1 from H i and OH absorption velocities, implying that the gas traced via H i and OH absorption in Mrk 1 is also not related to the molecular gas traced by CO emission.
5.3 Kinematics and composition of the absorbing gas
| Parameter | Value |
|---|---|
| (H i)† (cm-2) | |
| (H i)† (cm-2) | |
| (OH)‡ (cm-2) | |
| (OH)‡ (cm-2) | |
| (H i) (cm-2) | |
| (OH) (cm-2) | |
| (1) | |
| (2) | |
| (1) | |
| (2) | |
| (H2)†† (cm-2) | |
| (OH)/(H i) | |
| Av (mag) | 9–90 |
| cm-2 | |
| 30 | |
| : Assuming =100 K; : Assuming =10 K; : Assuming OH/H2=10-7 | |
The general properties of the gas seen in absorption are summarized in Table 6. The total column density of OH is comparable to that observed in other active galaxies (e.g., Schmelz et al. 1986, Baan et al. 1985, 1992). Both components of the OH transitions appear to be thermally excited as their optical depth ratios () are between 1.0 and 1.8; the values predicted for excitations in LTE conditions. The optical depth ratios for both the components of the absorbing gas are 3. This ratio has been found to be varying from as low as 5 to more than 400 in Galactic clouds (Dickey et al. (1981)). The smaller values correspond to the molecular clouds while larger values correspond to the diffuse clouds. It is therefore suggested that the H i and OH absorption, in the present case, are associated with dense molecular clouds.
The observed velocity dispersion () of the 1667 MHz OH absorption, viz., 44 km s-1 is higher than the typical velocity dispersions ( = 3–7 km s-1) in giant molecular clouds (GMCs) of the Galactic disk. However, several high dispersion clouds ( km s-1) have been detected in 18 cm OH absorption within a kpc of the Galactic centre (Boyce & Cohen (1994)). The simplest explanation for such a high velocity dispersion could be a chance alignment of several normal GMCs along the line of sight, but Kumar & Riffert (1997) have shown that the probability of such alignments is small. Alternatively, if the velocity dispersion is due to a single gravitationally bound system in virial equilibrium, the mass of such an object (assuming a size of 50 pc) could be M⊙. Cloud–cloud collisions (Klein et al. 1994b ) and interaction of shock with ISM (Klein et al. 1994a ) are also known to enhance the internal velocity dispersions of molecular clouds.
The OH column density is known to correlate with the visual extinction, Av, of molecular clouds in our Galaxy (Magnani et al. (1988)). Magnani et al. (1988) found that N(OH)/Av ratios are in the range of cm-2 mag-1. For the OH column density toward Mrk 1, these ratios indicate 9 A 90 toward the line of sight of Mrk 1. In comparison, Veilleux et al. (1997), based on some infrared measurements, obtained a lower limit on Av to be 26 consistent with above predictions.
Using OH/H (Liszt & Lucas (1996)), the implied column density of H2 is cm-2. Using values of the photo-electric absorption cross sections from Morrison & McCammon (1983) for a gas having the solar abundance, a total hydrogen column density of cm-2 indicates that the optical depth for X-ray absorption at 1 keV will be 30. Such a high value of the optical depth will absorb almost all soft X-radiation from the nucleus of Mrk 1. Consistent with this prediction, Mrk 1 has not been detected as a X-ray source down to a sensitivity of 1041 erg s-1 (Fabbiano et al. (1992)).
6 Conclusions
We have presented the observations of the Seyfert 2 galaxy Mrk 1 in the H i 21 cm line using the GMRT and in the OH 18 cm line using the VLA. Unlike the optical morphology, the H i emission morphology of Mrk 1 indicates that this galaxy is disturbed which we interpret as due to tidal interactions with the nearby companion NGC 451. We also showed based on the dynamical study of Mrk 1 – NGC 451 system that the interaction is bound leading to a merger within a small fraction of their orbital time period. This is consistent with the hypothesis that the bound interactions should be more efficient in triggering nuclear activities than unbound interactions. The H i and OH absorption detected toward the nucleus of Mrk 1 indicates an outflow of both atomic and molecular gas. The column densities of the detected H i and OH absorption indicate that the line of sight toward the nucleus of Mrk 1 is rich in both atomic and molecular gas. The gas detected in absorption is kinematically different than that traced via CO emission and water megamaser emission from Mrk 1. We found evidences that shocks (presumably due to nuclear activities) can affect the kinematics of gas near the nucleus. The H i and OH absorption being blueshifted from the systemic velocity and the [O iii] velocity while consistent with the [O ii] velocity is understood in terms of the shock ionization of gas (which predicts enhancement of the [O ii] line intensity) and an outflow of ISM in front of the shock. Based on the optical depth ratios and the line widths of the H i and OH absorption, we speculate that the absorption is arising in turbulent molecular clouds of similar types as those found near the Galactic centre. These observations also imply that the line of sight toward the nucleus of Mrk 1 is heavily obscured.
Acknowledgements.
We thank the staff of the GMRT that made these observations possible. GMRT is run by the National Centre for Radio Astrophysics of the Tata Institute of Fundamental Research. The National Radio Astronomy Observatory is a facility of the National Science Foundation operated under cooperative agreement by Associated Universities, Inc. This research has made use of the NASA/IPAC Extragalactic Database (NED) which is operated by the Jet Propulsion Laboratory, California Institute of Technology, under contract with the National Aeronautics and Space Administration. This research has made use of NASA’s Astrophysics Data System. We thank Dipankar Bhattacharya for a reading of the paper and useful comments. We thank the referee for thoughtful comments.References
- Baan et al. (1985) Baan, W.A., Haschick, A.D., Buckley, D., & Schmelz, J.T. 1985, AJ, 293, 394
- Baan et al. (1992) Baan, W.A., Haschick, A.D., & Henkel, C. 1992, AJ, 103, 728
- Bergeron & Durret (1987) Bergeron, J., & Durret, F. 1987, A&A, 184, 93
- Binney & Tremaine (1987) Binney, J., & Tremaine S., Galactic Dynamics, Princeton Univ. Press, Princeton, NJ
- Boyce & Cohen (1994) Boyce, P.J., & Cohen, R.J. 1994, A&AS, 107, 563
- Braatz et al. (1994) Braatz, J.A., Wilson, A.S., & Henkel, C. 1994, ApJ, 437, L99
- Braatz et al. (1997) Braatz, J.A., Wilson, A.S., & Henkel, C. 1997, ApJs, 110, 321
- Dahari (1984) Dahari, O. 1984, AJ, 89, 996
- De Robertis et al. (1998) De Robertis, M.M., Yee, H.K.C., & Hayhoe, K. 1998, ApJ, 496, 93
- De Robertis & Shaw (1990) De Robertis, M.M., & Shaw, R.A. 1990, ApJ, 348, 421
- Dickey et al. (1981) Dickey, J.M., Crovisier, J., & Kazès, I. 1981, A&A, 98, 271
- Dickinson et al. (1976) Dickinson, D.F., Kojoyan, G., Purton, C.R., Sramek, R.A., & Tovmassian, Kh.M. 1976, Astron. Nachr. 1976, 297, 283
- Dopita & Sutherland (1995) Dopita, M.A., & Sutherland, R.S. 1995, ApJ, 455, 468
- Fabbiano et al. (1992) Fabbiano, G., Kim, D.W., & Trinchieri, G. 1992, ApJs, 80, 531
- Gallimore et al. (1999) Gallimore, J.F., Baum, S.A., O’Dea, C.P., Pedlar, A., & Brinks, E. 1999, ApJ, 524, 684
- Hernquist & Mihos (1995) Hernquist, L., & Mihos, J.C. 1995, ApJ, 448, 41
- Hutchings (1989) Hutchings, J.B. 1989, AJ, 98, 524
- Kay et al. (1994) Kay, L.E. 1994, ApJ, 430, 196
- Keel (1996) Keel, W.C. 1996, AJ, 111, 696
- (20) Klein, R.I., McKee, C.F., & Collela, P. 1994a, 1994, ApJ, 420, 213
- (21) Klein, R.I., McKee, C.F., & Woods, D.T., 1994b, In ASP conf. series vol. 80, p. 366
- Koski (1978) Koski, A.T. 1978, ApJ, 223, 56
- Kukula et al. (1999) Kukula, M.J., Ghosh, T., Pedlar, A., & Schilizzi, R.T. 1999, ApJ, 518, 117
- Kumar & Riffert (1997) Kumar, P., & Riffert, H. 1997, MNRAS, 292, 871
- Liszt & Lucas (1996) Liszt, H., & Lucas, R. 1996, A&A, 314, 917
- Magnani et al. (1988) Magnani, L., Blitz, L., & Wouterloot, J.G.A. 1988, ApJ, 326, 909
- Markarian et al. (1989) Markarian, B.E., Lipovetsky, V.A., Stepanian, J.A., Erastova, L. K., & Shapovalova, A. I. 1989, Sobshcheniya Spetsialnoi Astrof. Obs., 62, 5
- Morganti et al. (1998) Morganti, R., Oosterloo, T., & Tsvetanov, Z. 1998, AJ, 115, 915
- Morrison & McCammon (1983) Morrison, R., & McCammon, D. 1983, AJ, 270, 119
- Neufeld et al. (1994) Neufeld, D.A., Maloney, P.R., & Conger, S. 1994, ApJ, 436, L127
- Schmelz et al. (1986) Schmelz, J.T., Baan, W.A., Haschick, A.D., & Eder, J. 1986, AJ, 92, 1291
- Simkin et al. (1987) Simkin, S.M., van Gorkom, J., Hibbard, J., & Su, H. 1987, Science, 235, 1367
- Swarup et al. (1991) Swarup, G., Ananthakrishnan, S., Kapahi, V.K. et al. 1991, Curr. Sci., 60, 95
- Tadhunter et al. (2001) Tadhunter, C., Wills, K., Morganti, R., Oosterloo, T., & Dickson, R. 2001, MNRAS, 327, 227
- Vila-Vilaro et al. (1998) Vila-Vilaro, B., Taniguchi, Y., & Nakai, N. 1998, AJ, 116, 1553
- Veilleux et al. (1997) Veilleux, S., Goodrich, R.W., & Hill, G.J. 1997, ApJ, 477, 631
- Weedman et al. (1968) Weedman, D.W., & Khachikyan, E.E. 1968, Astrophysics, 4, 243
- White et al. (1999) White, R.A., Bliton, M., Bhavser, S.P. et al. 1999, AJ, 118, 2014