The Morphology of 9 Radio-selected Faint Galaxies from deep HST Imaging
Abstract
Using the HST WFPC2 we perform deep -band imaging of 9 radio-selected () faint galaxies from the Roche, Lowenthal and Koo (2002) sample. Two are also observed in using HST STIS.
Six of the galaxies have known redshifts, in the range . Radial intensity profiles indicate that 7 are disk galaxies and 2 are bulge-dominated. Four of the six with redshifts have a high optical surface brightness in comparison with previous studies of disk galaxies at similar redshifts (e.g. Lilly et al. 1998). The HST imaging reveals that 2 of the 9 galaxies are in close interacting pairs and another 5 show morphological evidence of recent interactions – two are very asymmetric () and, three have large, luminous rings resembling the collisional starburst rings in the Cartwheel galaxy. For the two ring galaxies with redshifts, we measure ring radii of 7.05 and 10.0 kpc, which suggest post-collision ages 0.1–0.2 Gyr. One has a fainter inner ring, like the original Cartwheel. The remaining two appear to be late-type barred galaxies and relatively undisturbed.
Our HST imaging confirms the high incidence of interactions and dynamical disturbance in faint radio-selected galaxies, as reported by e.g. Windhorst et al. (1995) and Serjeant. et al. (2000). In the great majority of these galaxies the high radio luminosities are probably the result of interaction-triggered starbursts. However, one interacting galaxy is a very radioluminous giant elliptical, with red colours, a normal surface brightness and no evidence of star-forming regions, so its radio source is probably an obscured AGN. The mixture of observed morphologies suggests that enhanced radio luminosities often persist to a late stage of interaction, i.e. at least Gyr after the perigalactic encounter.
keywords:
Galaxies: starburst; Galaxies: interactions; Galaxies: peculiar; Radio continuum: galaxies1 Introduction
The radio emission from star-forming galaxies is of great importance as an apparently unbiased tracer of the star-formation rate (SFR), being neither obscured nor enhanced by the presence of dust (e.g. Condon 1992). At sub-milliJansky fluxes, deep radio surveys detect large number of star-forming galaxies, which overtake radio galaxies and other active galactic nuclei (AGN) as the most numerous type of source. Hence a deep radio-selected source sample will efficiently select the most intensely star-forming galaxies in the survey volume.
Hammer et al. (1995) investigated the optical IDs of a sample of radio sources detected in a deep Very Large Array (VLA) survey of one of the Canada-France Redshift Survey fields, to a limit in integrated flux . Spectroscopy revealed these galaxies to be mixture of (i) giant ellipticals, presumably with AGN, (ii) star-forming disks at redshifts out to , and (iii) lower redshift, high-excitation emission-line galaxies. Windhorst et al. (1985) and Richards et al. (1998) obtained similar findings – although with fewer AGN and more disk galaxies – at even fainter flux limits. Using HST imaging, they estimated that at least per cent of the radio-selected galaxies were interacting.
In a previous paper (Roche, Lowenthal and Koo 2002; hereafter RLK02) we identified the most probable optical IDs for 50 out of 51 –900 sources, detected in three deep VLA surveys. These galaxies were imaged in using the Keck Low Resolution Imaging Spectrograph (LRIS), and in with the Near Infra-red Camera (NIRC). Spectra and redshifts were obtained for 17, using LRIS in spectroscopic mode. Of these, 14 were found to be emission-line galaxies at redshifts up to , and the other 3 were QSOs at . A further 9 of the radio ID galaxies had known redshifts from previous observations, giving a total of 26 with known redshifts. RLK02 concluded that more than half of these 26 were disk galaxies with enhanced radio luminosities, resulting from major starbursts (). The remainder were apparently normal, non-starburst spirals and ellipticals at lower redshifts () ( per cent), QSOs ( per cent), or giant radioluminous ellipticals suspected to contain obscured AGN ( per cent).
The LRIS spectra of the 14 non-QSO galaxies showed the expected emission lines, , and , but the line luminosities typically correspond to SFRs an order of magnitude lower than the radio luminosities imply. Other surveys of radio-selected galaxies have found a similar discrepancy between emission-line and radio fluxes (e.g. Smith et al. 1996; Beck, Turner and Kovo 2000; Serjeant et al. 2000). The simplest explanation is a high dust extinction (–3 mag) of the starburst regions. We also found that 11 of the 26 galaxies were in close pairs and several others looked disturbed. However, it was clear that to adequately investigate the interaction status of these galaxies, much higher resolution imaging, e.g WFPC2, would be required.
Serjeant et al. (2000) performed an WFPC2 imaging survey of radio-selected star-forming galaxies, and describe the first four. These galaxies are at lower redshifts, , than the RLK02 sample but have comparable radio luminosites. They found at least one galaxy to be interacting and all 4 to be disturbed to some degree, and quantified morphological disturbance in terms of a rotational asymmetry parameter (Conselice, Bershady and Jangren 2000). They concluded that radio-selected galaxies are generally more asymmetric than optically-selected galaxies at similar magnitudes. Similarly, and at higher redshifts, Fomalont et al. (2002) identified 37/63 faint radio sources with galaxies, and using WFPC2 imaging found a high proportion, 46 per cent, to be multiple or interacting.
In this paper we perform a similar WFPC2 study of a subsample of the RLK02 radio IDs. Our HST program was allocated a total of 24 orbits, which was devoted to WFPC2 -band imaging of four fields, containing a total of 9 of the RLK02 galaxies. For the first two fields we imaged in parallel with STIS, and obtained images in the broad STIS -band of two of the galaxies. Section 2 of this paper describes the observations and data reduction. Section 3 catalogs the observed galaxies and presents HST images. In Section 4, radial intensity profiles are presented, model profiles fitted, and surface brightness compared with local galaxies. In Section 5 the evidence for interactions is investigated. Asymmetry parameters are evaluated and model profiles subtracted from the galaxies to highlight ‘residual’ features. In Section 6, galaxy colours are interpreted. Section 7 is a discussion of the nature of these galaxies and the source of their radio luminosity.
2 Data
2.1 Sample Selection
The galaxies studied here are an unbiased subsample of the galaxies identified by RLK02 on Keck LRIS images as probable optical counterparts of the radio detections on two VLA surveys. The first survey is of the SA68 field, centred at R.A. Dec 14:55:00 (equinox 2000.0 used throughout), in which observations at 5.0 GHz detected sources to integrated flux limits of , or – at 8.44 GHz (Weistrop et al. (1987). The WFPC2 field of view covers only one of these sources at a time.
The second survey, smaller in area but much deeper, is of the ‘Lynx2’ or ‘16V’ field ( R.A. Dec 44:34:05), observed at 8.44 GHz for 63 hours in December 1989 and January 1990. This gave a noise level of and a point-source completeness limit at – Windhorst et al. (1993) catalog the detections. A WFPC2 field may include several of these fainter sources.
2.2 HST Observations
The HST observations, in 14 time slots from September 2000 to September 2001, consisted of two pointings within the SA68 VLA survey (Weistrop et al. 1987) and two in the Lynx2/16V (Windhorst et. al 1993) field. Our program originally called for observations with both WFPC2 and STIS, but the temporary failure of STIS partway through our observations meant that we used only WFPC2 for the targets in the Lynx2 field. Imaging was performed in four telescope pointings as described below.
(i) The optical ID for the radio source SA68:10 (hereafter ‘S10’) was centered in the WFPC2 and imaged in the -band (F814W) for 5 orbits, giving 10 exposures of 1200s or 1300s for a total of 12.4 ksec. Each orbit was split into two exposures for cosmic-ray rejection, and the telescope was dithered a few arcseconds between successive orbits to improve flat-fielding and bad pixel rejection. STIS, operating in parallel, simultaneously imaged another galaxy from the same survey, SA68:4 (hereafter ‘S4’), for 5 exposures of 400 sec each totalling 2000 sec in a wide -band filter (’mirvis’). For the remainder of the available time at that pointing, STIS was used in spectroscopic mode, but the resulting spectra were of poor signal-to-noise and will not be discussed here further.
(ii) The telescope was rotated 180 degrees at the same pointing as in (i) to switch instruments, so that the WFPC2 was centered on S4 and STIS on S10. Again we obtained 10 exposures totalling 12.4 ksec in F814W with WFPC2 and 5 imaging exposures totalling 2.0 ksec in STIS.
(iii) The Lynx2 survey source 16V31 was centered in the WFPC2 and observed in the -band for 7 orbits, giving 14 exposures totalling 17.4 ksec.
(iv) As (iii) but centered on 16V22.
The observed area of the 16V31 pointing also included the sources 16V25, 16V30 and 16V34. The 16V22 pointing overlapped slightly with the third and again included 16V25, together with 16V21 and 16V26. Hence in total we observe 9 radio-selected galaxies.
2.3 Data Reduction
The data were downloaded from the STScI archive already flat-fielded and calibrated, and further reduction was performed using IRAF, as described in more detail by Roche, Lowenthal and Woodgate (2000). The WFPC2 has 4 chips (c1–c4), each pixels, with a pixelsize 0.046 arcsec on c1 (the PC) and 0.0966 arcsec on c2–c4. The STIS CCD produces a single pixel image, pixelsize 0.05077 arcsec.
Cosmic rays were removed from WFPC2 data using either the ‘nukecr’ routine developed by Luc Simard or ‘bclean’ on Starlink Figaro, and cosmic ray pixels were flagged on the data quality file. The STIS data were supplied with cosmic rays already rejected and flagged.
The exposures had been spatially dithered with offsets of up to a few arcsec between each orbit. Offsets were measured using the IRAF routines ‘precor’, ‘crossdriz’ and ‘shiftfind‘. The WFPC2 and STIS exposures (together with their data quality files) were rebinned to a finer grid, using IRAF ‘drizzle’, and positionally registered using the measured offsets (rebinning scale factors were 0.42 for WFPC2 chips 2–4, 0.45 for c1 and 0.53 for STIS). The drizzled exposures were then stacked using IRAF ‘imcombine’, with rejection of those pixels discrepant by and those flagged as ‘bad pixels’ or as cosmic rays. Finally the stacked exposures were trimmed to remove the low-quality edges.
2.4 Detection and Photometry
Sources were detected on the drizzled and stacked images using SExtractor (Bertin and Arnauts 1996), with a detection threshold of in a minimum area of 16 rebinned pixels for WFPC2 c2–c4, 36 for c1, and 25 for STIS. Over 200 galaxies are detected on each large WFPC2 chip. SExtractor provides ‘total’ (Kron-type) magnitudes, derived by fitting a series of elliptical apertures to each detection. We have found that these ‘total’ magnitudes are usually reliable for WFPC2 data (they agree closely with the magnitudes from STIS ‘isophote.ellipse’ at the largest radii), and hence we adopt these here as the true magnitudes.
Magnitudes are given throughout in the AB system, in which, in any passband, , where is flux in ergs . The stacked images are normalized to the mean exposure time (1240 sec for the WFPC2 SA68 fields, 1243 sec for the WFPC2 Lynx2 fields, and 400 sec for STIS), and photometric zero-points derived as
where ‘photflam’ is as given in the exposure headers, for F814W and for STIS ), and is the Galactic extinction ( from the NASA/IPAC Extragalactic Database).
The thresholds are approximately 24.7 (SA68) or 25.0(Lynx2) mag for WFPC2 and 24.2 mag for STIS imaging. All 9 of the radio-selected galaxies in the observed region are detected.
3 The Observed Sample: Catalog and HST Images
| Radio | Optical position | |||
|---|---|---|---|---|
| source | R.A. | Dec. | ||
| S4 | 00:17:41.75 | 15:50:03.2 | 20.84 | 2.46 |
| S10 | 00:18:03.66 | 15:49:04.6 | 22.22 | 0.85 |
| 16V21 | 08:44:58.22 | 44:33:13.46 | 23.05 | 0.50 |
| 16V22 | 08:44:59.00 | 44:33:44.00 | 22.36 | 0.59 |
| 16V25 | 08:45:05.48 | 44:34:15.14 | 21.71 | 3.02 |
| 16V26 | 08:45:05.61 | 44:33:56.56 | 24.49 | 0.16 |
| 16V30 | 08:45:07.91 | 44:33:51.60 | 20.28 | 1.96 |
| 16V31 | 08:45:08.35 | 44:34:38.58 | 20.74 | 1.96 |
| 16V34 | 08:45:14.33 | 44:34:50.97 | 19.78 | 1.38 |
| Radio | Redshift | 8.44 GHz flux | ||
| source | () | ergs | ||
| S4 | 0.7125 | 40.91 | 953–2239 | |
| S10 | 0.9923 | 40.54 | 406–955 | |
| 16V21 | ? | (38.96– | (10.6– | |
| 16V22 | 0.4259 | 39.29 | 22.9–53.7 | |
| 16V25 | 0.7273 | 39.99 | 114–269 | |
| 16V26 | ? | (38.80– | (7.3– | |
| 16V30 | ? | (38.39– | (2.9– | |
| 16V31 | 0.4977 | 39.92 | 97-229 | |
| 16V34 | 0.4257 | 39.47 | 34.6–81.3 |
[1] estimated from the 5.0 GHz flux (Weistrop et al. 1987) using the Condon (1992) SED. For galaxies without known redshifts, is the range of radio luminosities estimated for the redshift range 0.2–1.0; is the range of SFR estimates from that for and the Carilli (2001) relation to that for and the Condon (1992) relation.
Our HST sample therefore consists of 9 radio-selected galaxies, of which the Keck LRIS spectroscopy of RLK02 provides reliable redshifts for 6. Table 1 gives the optical positions of the galaxies, the redshifts where known, the WFPC2 magnitudes and radio fluxes, and the RLK02 estimates of the restframe 8.44 GHz luminosities (in the form ) and corresponding SFRs. All luminosities and SFRs throughout are given for km and a flat , cosmology.
The SFRs are estimated assuming no AGN contribution to the radio flux (see Section 7.1). The lower and upper values correspond respectively to the -SFR relations of Carilli (2001) and Condon (1992). These relations give the SFR for strs, but here we give SRFs as totals for all masses of star, assuming an Initial Mass Function (see RLK02) of (where ) at , and at . The total SFRs would be a factor 1.66 higher for the Salpeter IMF.
RLK02 give details and plots of the spectra; important properties are briefly described below. ‘W’ refers to a line equivalent width in the restframe (the observed value divided by ). We have no redshifts or spectra for 16V21, 16V26 or 16V30.
16V22 has strong emission, , and a high excitation () ratio of , consistent with an HII galaxy. 16V25 has moderate emission lines typical of a normal spiral, with , as do 16V31 and 16V34, with and respectively. For 16V31 and 16V34 we have excitation ratios, and respectively, consistent with late-type or starbursting spirals but not AGN (unless obscured). 16V31 also has strong absorption of , classifying it as an ‘e(a)’ galaxy (Poggianti and Wu 2000). S4, classed by RLK02 as an elliptical, has moderate emission, , but S10 has , indicating a major starburst.
The spectral line profiles also provided estimates of internal and rotation velocities, given in RLK02. 16V22, the only sub- galaxy in this sample, had low velocities consistent with a HII galaxy. The other five spectra all show evidence of rotation ( km ), consistent with spirals.
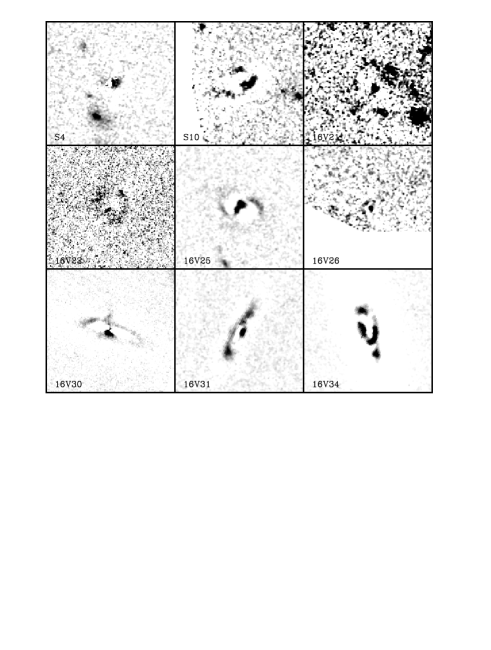
Figure 1 shows greyscale plots of the galaxies as observed with WFPC2 and STIS. The HST imaging reveals many significant details not apparent in the ground-based observations (RLK02 Figure 1). S4 has a fainter companion, S10 and 16V21 are both highly asymmetric with multiple bright knots (16V21 may be a merging system). 16V22 and 16V25 appear to be relatively undisturbed barred galaxies, with comparison by eye with local galaxy catalogs (e.g. Sandage and Bedke 1998) suggesting approximate types SBm and SBbc respectively. 16V26 is faint but obviously disturbed, and 16V30, 16V31 and 16V34 all have large, bright rings. These features are discussed further in Section 5.
4 Intensity Profiles
4.1 Disk and Bulge Fitting
We investigated the radial intensity profiles of these galaxies using IRAF ‘isophotes’, which, with centroids, ellipticities and position angles from the SExtractor catalog used as starting parameters, fits each galaxy with a series of elliptical isophotes, providing a radial intensity profile on the semi-major axis. The resulting profiles were then best-fitted with exponential, , and bulge, , functions.
Figure 2 shows the -band profiles of the 9 galaxies, together with the best-fitting (lowest rms residuals) models and their or scalelengths. Table 2 gives the scalelengths and central surface brightness (SB) of the best-fit models together with the observed central SB, averaged over the pixels at arcsec.
S4 is closely fitted by a bulge model, with the excess at arcsec being due to a companion galaxy. The ring around 16V30 gives the impression of a spiral, but a bulge model is adopted here as it is a much better fit at arcsec. The other 7 galaxies are much closer to purely exponential disks, but some have large ( mag) residuals.
| Galaxy | Type | or | Central SB ( mag ) | |
|---|---|---|---|---|
| arcsec | Model | Observed | ||
| S4 | bulge | |||
| S10 | disk | |||
| 16V21 | disk | |||
| 16V22 | disk | |||
| 16V25 | disk | |||
| 16V26 | disk | |||
| 16V30 | bulge | |||
| 16V31 | disk | |||
| 16V34 | disk | |||
4.2 Surface Brightness
RLK02 estimated rest-frame blue absolute magnitudes, , and 8.44 GHz luminosities, , for the radio IDs with known redshifts. Firstly, a grid of model spectral energy distributions, representing galaxy types from ellipticals to pure starbursts over a wide range of redshifts, was generated using ‘Pegase2’ (Fioc and Rocca-Volmerange 2000). For each model SED, a redshift-dependent correction was calculated. The observed colour of each galaxy (, and/or ) was compared with the models at the same redshift, and interpolation between the two models closest in colour then gave an estimated , which was used to derive from the apparent magnitude. was similarly estimated from the observed 8.44 GHz fluz assuming the Condon (1992) model radio SED.
Using the more accurate WFPC2 photometry, we re-estimated for the 6 galaxies with known redshifts. For each galaxy, the correction is derived from the same interpolated model SED as used by RLK02, and then used to derive from the WFPC2 magnitude (Table 3).
The surface brightnesses and luminosities of our radio-selected galaxies are compared with those of normal optically-selected field galaxies. The half-light radius is equal to for bulges and for disks. Binggeli, Sandage and Tarenghi (1984) find that for nearby E/S0s with (for km )
and for the less luminous () E/S0s
For spirals, the Freeman (1970) central SB is mag at all luminosities, which corresponds to
However, more recently, Cross and Driver (2002) determined a bivarate brightness function for 45000 disk galaxies in the 2dFGRS, and found evidence of a positive correlation between SB and luminosity. Their best-fit relation corresponds to
with scatter , or to a central SB

with scatter mag.
On Figure 3, our and luminosity () estimates for the radio-selected galaxies are plotted with the relations from Equations 1, 2 and 3 For each galaxy we calculated as the difference between the observed and that given by the appropriate relation (i.e. Equation 1 for S4 and 16V30, Equation 3 for the other four) for the observed . This provides a direct comparison between the rest-frame blue-band SB of our radio-selected galaxies and that of normal field galaxies.
However, this is likely to be be an underestimate for spirals seen close to edge-on (i.e. 16V31 and 16V34), which would require corrections for internal extinction. Hoerver, the central SB (Table 2), should be much less sensitive to the inclination angle, to local disk galaxies. The -band central SB, corrected to , can be estimated as
For the disk galaxies, we calculated as the the difference between the observed and the central SB given by Equation 4 for the given by Equation 3 for the observed ( for the observed ). We see that, for the face-on 16V25, and are very similar, but is much greater for the edge-on 16V31 and 16V34.
| Galaxy | or | ||||
|---|---|---|---|---|---|
| S4 | -22.78 | 18.19 | -0.26 | - | |
| S10 | -22.68 | 19.22 | -1.21 | -2.04 | |
| 16V22 | -19.89 | 20.83 | +0.15 | -0.83 | |
| 16V25 | -21.98 | 19.53 | -1.94 | -2.13 | |
| 16V31 | -21.57 | 19.78 | -0.42 | -1.57 | |
| 16V34 | -22.32 | 19.66 | +0.26 | -1.29 |
On the basis of these studies, the central SB of 16V22 is near the average for a disk galaxy of its size and redshift, whereas 16V25, 16V31, 16V34 and S10 are mag above the average. All four lie at about the top of the observed SB range of CFRS/LDSS galaxies in the plot of Lilly et al. (1998).

The relatively high SBs of these galaxies may then favour the interpretation of their enhanced radio luminosity as the result of starbursts. In all four, the high SB appears to be associated with the whole disk or with extended features, such as the bright rings of 16V31 and 16V34 (see below), and not with any central point-source. 16V22 has a more moderate SB, but its blue colours would be evidence for starbursting. However there is no indication that S4 is starbursting as its SB and red colours (Section 6) are consistent with a passively evolving elliptical.
5 The Evidence for Interactions
5.1 Interacting Pairs
Two of the 9 galaxies appeared to be interacting with smaller companions, although we have no definite (i.e. with spectroscopic kinematics) confirmation of this. S4 appeared to be an isolated galaxy in the RLK02 data, but the HST reveals a much fainter (the demerged SExtractor magnitude is ), disk-type companion 1.92 arcsec to its SSE. The luminosity ratio is and projected separation kpc. S4 is not greatly disturbed but does show isophotal twist in the central arcsec. 16V21 has bright knots suggesting active star formation, and is very asymmetric. It appears to be connected by a luminous filament to a smaller, high-SB companion 3.24 arcsec to the SW, with (luminosity ratio 0.4:1). The other 7 galaxies have no obvious companions, but we investigate below the possibility that they show evidence of very recent interactions.
5.2 Asymmetry Parameters
Conselice, Bershady and Jangren (2000) presented a quantitative measure of rotational asymmetry, which can be used to distinguish between ‘normal’, undisturbed galaxies and those undergoing an interaction or merger. The statistic they found to be most successful is evaluated as
where represents a summation over the galaxy image, the image of the unrotated galaxy, the image of the same galaxy rotated by about a central point (which is fine-tuned by iteration to minimize the resulting ), and an offset produced by background noise, which is corrected for by evaluating on a blank region of the field. A perfectly symmetric galaxy would give while is the maximum possible. Conselice et al. (2000) found this statistic to be most reliable when evaluated within a radius where a ‘Petrosian function’, , falls to 0.2. This function is defined as where is intensity at radius and the mean intensity within radius (Petrosian 1976; Bershady, Lowenthal and Koo 1998). Typically, at the edge of the visibly luminous galaxy.
Undisturbed ellipticals and early-type spirals are generally found to have , late-type spirals and irregulars –0.2, while galaxies undergoing major mergers have higher asymmetries of –0.6. Serjeant et al. (2000) calculated for their four radio selected galaxies as 0.47, 0.112, 0.185 and 0.317. The mean is 0.27 and the dispersion 0.16.
Using an IRAF routine written by M. Bershady and C. Conselice, we evaluated (and associated error) for the 9 galaxies in our sample. (Table 4). These are at somewhat higher redshufts. Conselice et al. (2000) modelled the effect of resolution on estimates and found that for an accurate measurement the resolution element should be kpc. For our 6 galaxies with redshifts, 0.1 arcsec is 0.8-1.0 kpc, which may lead to some underestimation of , but this is expected to be a small effect ( per cent).
The two relatively undisturbed galaxies, 16V22 and 16V25, give , values typical of normal galaxies. We find moderately elevated asymmetries () for S4 (due to its companion) and all three of the ring galaxies, and the highest asymmetries (–0.5) for 16V21, a probable ongoing merger, and the very disturbed S10 and 16V26.

| Galaxy | Type | |
|---|---|---|
| S4 | E/S0, w companion | |
| S10 | disk, very asymmetric | |
| 16V21 | disk, merging? | |
| 16V22 | ||
| 16V25 | ||
| 16V26 | disk, asymmetric | |
| 16V30 | bulge w ring | |
| 16V31 | spiral w inner/outer rings | |
| 16V34 | disk w ring |
Figure 4 shows against redshift for our sample and that of Serjeant et al. (2000). The mean (0.23) of our sample, the dispersion (0.11) and the range are all similar to those of the radio-selected galaxies at .
Although even non-interacting irregular galaxies (e.g. NGC4449 on Figure 7 of Conselice et al. 2000) may have asymmetries of up to , these are atypical and most galaxies in optically-selected samples (e.g. the CFRS/LDSS galaxies on Figure 2 of Sergeant et al. 2000) are clustered around lower values of . The results for our sample, combined with the galaxies, are therefore evidence that radio-selected galaxies are on average more dynamically disturbed than optically-selected galaxies. Futhermore, we see that although some of these radio-selected galaxies appear normal and have , an even higher proportion (5 of the 13 plotted) have the asymmetries characteristic of ongoing or very recent merging, or other major dynamical disruption.
5.3 Residuals to Fitted Profiles
Star-forming regions and asymmetric effects of dynamic disturbance can be highlighted by subtracting the underlying disk or bulge profile from galaxy images, to leave an image of the residuals. Using IRAF ‘mkobjects’, we generate for each galaxy a 2D image of a symmetrical disk or bulge model profile, with the same scalelength (from the fitted profile as shown on Figure 2), and same ellipticity and position angles (as given by SExtractor). These model profiles are subtracted from the observed galaxies and subtracted, leaving the residuals (Figure 5), which are briefly described below.
S4: residual image shows part of the nucleus (incompletely subtracted due to its isophotal twist) and whole of the companion galaxy. S10: bright knots extending W of the nucleus on the N and S edges of the galaxy. 16V21: bright knots and the possible companion galaxy and connecting filament. 16V22: shows a faint ring resulting from the outer isophotes being rounder than the bar-like inner region. 16V25: bright residuals consisting of the bar and arms. The bar is asymmetric, almost triangular. 16V26: multiple bright regions. 16V30: shows part of the slightly off-centre nucleus, a spur extending to the N, and a large bright ring with a full circle visible. 16V31: shows part of the slightly off-centre nucleus, and a large bright ring, broken (obscured by internal extinction?) on one side, There is an additional bright region to the N of the nucleus and within the ring, which on close inspection is seen to lie on a thinner and fainter inner ring. 16V34: a very bright ring of variable SB, appearing broken, and an extended bright region S of the ring.
The most significant new findings from this method are (i) asymmetry and possible disturbance in the centre of 16V25, and (ii) rings in three galaxies. These rings are discussed in detail below.
5.4 ‘Cartwheel’-type Rings
The ‘Cartwheel’ galaxy (A0035), first described by Fosbury and Hawarden (1977), is a luminous ) late-type disk at , with a large and very prominent 33 kpc radius ring. The ring is now known to have been formed by the high-velocity passage of a small companion galaxy through the disk, near the centre, triggering an expanding density wave with a radial velocity km (Higdon 1996). There is also a much fainter inner ring of radius 7 . Appleton and Marston (1997) describe 10 other galaxies of this type with a wide range of ring radii.
Collisional ring galaxies are remarkable, in that the high-velocity impact of a much less massive galaxy can generate a very prolonged starburst which eventually sweeps through the whole disk, converting most of the gas to stars. Despite the Cartwheel’s Gyr post-impact age (radius/velocity), the SFR remains extremely high with almost all the star formation concentrated in bright knots on the outer ring. Higdon (1995, 1996), on the basis of Balmer line and radio/ ratios, estimate a high extinction of mag for these star-forming regions, and after correcting for this estimate a SFR of 268 . At this SFR the Cartwheel will exhaust its supply of gas in a further Gyr.
Our WFPC2 sample contains 3 galaxies with rings suggestive of similar collision histories. 16V31 has the closest resemblance to the Cartwheel in that a nucleus, inner and outer rings are all visible, and its radio luminosity and SFR are very similar. 16V34 differs in that only one ring is visible, the ring is more off-centre and asymmetric (appearing broken), and no nucleus is visible. It may simply be that 16V34 is a later-type spiral than 16V31, and that the colliding dwarf galaxy impacted further from the centre and at a greater inclination to the disk plane. 16V30, on the other hand, is an earlier-type galaxy with a very bright bulge-profile nucleus. The residual image shows a luminous spur extending N from the nucleus.
Figure 6 shows cross-sections along the major axes of these three galaxies, with the fitted disk and bulge profiles subtracted (as on Figure 2). Ring radii are measured from the peaks in these cross-sections. On 16V30 (redshift unknown), the ring (peak to ) has radius 1.51 arcsec and is off-centre from the nucleus by 0.17 arcsec. On 16V31 the outer ring (peak to ) has radius 1.17 arcsec (10.0 kpc or 1.63 ) and is off-centre by 0.17 arcsec, and the inner ring (peak to has a radius 0.67 arcsec (5.7 kpc or 0.93 ) and is off-centre by 0.13 arcsec. On 16V34 the ring (peak to ) has radius 0.90 arcsec (7.0 kpc or 0.71 ) and is more off-centre, by 0.25 arcsec, while the secondary peak B is 0.70 arcsec beyond the A ring.
If the ring expansion velocities are similar to the Cartwheel, the post-impact ages of 16V31 and 16V34 would be 184 and 130 Myr, which are typical for galaxies with visible collisional rings (Bransford et al. 1998). 16V31, with two rings, appears to be at a similar evolutionary stage to the Cartwheel, but 16V34 may be at an earlier stage, as there is only one ring and it is considerably smaller than the visible extent of the galaxy disk. If, for example, the starburst does not run out of fuel until the ring reaches , 16V34 will be a bright radio source for a further 0.2–0.3 Gyr.

.
6 The Colours of S4 and S10
Combining WFPC2 data with the STIS data for S4 and S10 provided colours, which although narrow-based, may still be useful in distinguishing young and old stellar populations, especially at . The whole-galaxy colours, as measured in large elliptical apertures fitted to -band isophotes (including almost all of the flux, and matched in the two passbands) , are for S4 and for S10. The colour of the small companion of S4 was measured in a 0.5 arcsec radius aperture as .
Using the ‘Pegase 2’ package of Fioc and Rocca-Volmerange (1997), we model the colours expected for the evolving galaxy models considered in RLK02. The E and S0 models differ in the initial starburst duration, but both evolve passively at . The spiral and Irr models have SFRs decreasing approximately exponentially and include dust. We also model a non-evolving 50 Myr age pure starburst, with and without dust. Figure 8 shows these models together with the whole-galaxy colours of S4 and S10, and also the colour of the companion galaxy to S4, measured in a 0.5 arcsec radius aperture as . S4 has the red colour of a passive galaxy with no indication of ongoing star-formation, while its disk-type companion and S10 are both much bluer and consistent with evolving spirals.

Using IRAF ‘geomap’, the STIS images could be rebinned to the pixel grid of the WFPC2 data. Colour profiles were then extracted, by using ‘isophote’ to measure STIS fluxes on the isophotes already fitted to the images, and are shown on Figure 7.

S10 is significantly non-uniform in colour, with a relatively red centre, , which is closer to a passive than a spiral model. At arcsec there is a sudden transition to much bluer colours of –0.9, consistent with an evolving spiral or a moderately reddened ( mag) starburst. This suggests that the galaxy was initially a normal star-forming spiral, with a nucleus containing older stellar population in its nucleus. This appears to have been greatly disrupted by an interaction, triggering extensive starbursting with associated radio and emission. However, the disk colour remains consistent with a non-starburst spiral, so the burst may be moderately – mag – dust-reddened.
S4, in contrast, is uniformly red, with passive-evolution colours, out to arcsec. The bluer colour at arcsec is due at least in part to the much bluer companion galaxy. However, there is evidence of slight ( mag) bluening at arcsec, where the radial profile does not indicate any additional flux from the companion, so there may be a small colour gradient in its outer regions.
7 Discussion: Nature of the Radioluminous Galaxies
7.1 Origin of the Radio Emission
S4, the most radioluminous, is a giant elliptical, with a much fainter blue disk companion. The colours and SB are consistent with a passively evolving elliptical and there are no obvious star-forming regions. We find no indication that it is undergoing the extreme star formation – at least – needed for this to account for its radio luminosity. The radio emission is probably from an obscured AGN, and it seems plausible that the interaction with the companion triggered the current nuclear activity.
S10, the second most radioluminous, is a very different object, blue in colour with a very asymmetric disk profile. The bright knots, high optical SB and strong emission lines are evidence for an extensive starburst. It has a much redder nucleus, suggesting it was initially a spiral. Interaction-triggered star-formation can probably account for the high radio luminosity.
16V21 is also a highly disturbed disk galaxy with bright knots, and may be interacting or merging.
16V22 is a sub- galaxy of estimated type . The SB is near average for a disk of its redshift, and is not visibly interacting or disturbed. However, very blue colours, strong emission, and a high excitation ratio, (RLK02) imply starbursting, or possibly an AGN. The deep radio sample of Hammer et al. (1995) contained some similar high-excitation, sub- galaxies, which were of uncertain nature having line diagnostics near the HII/Seyfert/LINER divide. In the case of 16V22, we find no sign of a central point source on our image, so it seems most likely that star-formation accounts for the radio emission.
16V25 appears to be a barred spiral , with a high disk and central SB. The radio emission may be due to strong star-formation, possibly enhanced by a minor interaction as the central bar appears asymmetric. It is also possible that some of the emission is from an AGN, but any active nucleus must be heavily obscured as there is no visible point-source (the redshift was too high for RLK02 to obtain an excitation ratio).
16V26 appears to be a disturbed disk galaxy, like S10, and on the basis of its faintness and colours is likely to be at .
16V30 could be (i) a very early-type spiral with radio emission from a collisional starburst ring, or (ii) a giant elliptical that has accreted a smaller galaxy, forming a ring. Of these 9 galaxies, it is the second brightest in but has the lowest radio flux. The redshift is unknown but if the optical luminosity is high () the radio emission would be consistent with a normal giant elliptical, following the Sadler, Jenkins and Kotanyi (1989) relation.
16V31 and 16V34 are disks with rings resembling those in the Cartwheel galaxy, and on the basis of the high SFR and radio flux of the original Cartwheel, it is highly probable that collisional starbursting in these rings accounts for their radio luminosities.
7.2 The Role of Interactions
Our HST imaging survey confirms the high incidence of interactions amongst faint radio-selected galaxies, as previously reported by e.g. Windhorst et al. (1995) and Serjeant. et al. (2000), with the strong radio emission resulting from starbursting in the majority of galaxies (at least 6 of this sample of 9) and obscured AGN in a significant minority (at least 1/9 here). Probably the most interesting new findings are the Cartwheel-type rings in at least 2 and possibly 3 of these galaxies.
These rings, together with the asymmetry of S10 and 16V26, imply that a rather large fraction, 5/9, of the sample are post-encounter interacting galaxies, whereas only two appear to be in pre-encounter pairs. This can be compared with the ULIRGs ( galaxies) of Clements et al. (1996), of which 55/60 are visibly disturbed or merging, and double nuclei could be resolved in 28, i.e. about equal numbers are observed before and after nuclear coalescence/collision. A high post-encounter fraction amongst radio-selected galaxies might be expected on the basis of a model of Lisenfeld et al. (1996), in which the synchrotron radio emission from a starburst remains strong for at least Myr after star formation ceases. This also means that galaxies that have already been starbursting for Myr would have higher radio luminosities per unit SFR, and higher radio/FIR ratios, than near the onset of star formation.
16V31 has strong absorption which could be fit by a Delgado et al. (1999) post-starburst model at age Myr, but could also result from ‘age-dependent extinction’, with starbursting ongoing for yr with only the most recent star-formation ( yr) obscured by dust (Poggianti, Bressan and Franceschini 2001). The LRIS spectroscopy of RLK02 did not provide the line ratios, e.g. the Balmer decrement, needed to distinguish these possibilities. However, the close resemblance to the Cartwheel is an important clue, as the Cartwheel is known to have a very high current SFR combined with mag extinction of the starburst emission lines. A similar picture is seen for the other 8 collisional ring galaxies studied by Bransford et al. (1998), including two with strong Balmer absorption lines.
This is significant, as prolonged starbursting with age-dependent extinction can (in addition to producing strong Balmer lines), explain the very low emission line to radio flux ratios of radio-selected galaxies in general (see RLK02).
Collisional ring galaxies may prove to be quite prominent in deep radio surveys, as they are more numerous at higher redshifts (Lavery et al. 1996) and the long synchrotron lifetime would favour the radio-detection of post-encounter, yr age, prolonged starbursts, of which Cartwheel-type galaxies are prime examples.
Acknowledgements
Based on observations with the NASA/ESA Hubble Space Telescope obtained at the Space Telescope Science Institute, which is operated by the Association of Universities for Research in Astronomy, Incorporated, under NASA contract NAS5-26555. . DCK was supported by an NSF PYI grant AST-8858203 and a research grant from UC Santa Cruz. NR is currently supported by a PPARC research associateship. We thank Matthew Bershady and Christopher Conselice for providing their software for calculating galaxy asymmetries.
References
- [1] Appleton P.N., Marston A.P, 1997. AJ, 113, 201.
- [2] Bertin E., Arnouts S., 1996, A&AS 117, 393.
- [3] Beck S.C, Turner, J., Kovo O., 2000, AJ, 120, 244.
- [4] Bershady M.A, Lowenthal J., Koo D.C., 1998, ApJ, 505, 50.
- [5] Binggeli B., Sandage A., Tarenghi M., 1984. AJ, 89, 64.
- [6] Bransford M.A., Appleton P.N., Marston A.P., Charmandaris V., 1998. AJ, 116, 2757.
- [7] Carilli C., 2001, ‘Starburst Galaxies: Near and Far’, eds. Tacconi L. and Lutz D., Heidelberg Springer-Verlag, p.309 (astro-ph/0011199)
- [8] Conselice, C.J., Bershady M.A., Jangren A., 2000. ApJ, 529, 886.
- [9] Clements D. L., Sutherland W. J., McMahon R. G., Saunders W., 1996, MNRAS, 279, 477.
- [10] Condon J.J., 1992, A&A Ann. Rev., 30, 575.
- [11] Cross N., Driver S., 2002, MNRAS, 329, 579.
- [12] Delgado R.M., Leitherer C., Heckman T., 1999, ApJS, 125, 489.
- [13] Fioc M., Rocca-Volmerange B., 1997, A&A, 326, 950.
- [14] Fomalont E., Kellermann K., Partridge R., Windhorst R., Richards E, 2002, astro-ph/0201441.
- [15] Fosbury R.A.E., Hawarden T.G., 1977. MNRAS, 178, 473.
- [16] Freeman K., 1970, ApJ, 160, 811.
- [17] Hammer F., Crampton D., Lilly S. J., Le Fèvre O., Kenet T., 1995. MNRAS, 276, 1085.
- [18] Higdon J.L., 1995. ApJ, 455, 524.
- [19] Higdon J.L., 1996. ApJ, 467, 241.
- [20] Lavery R.J., Seitzer P., Suntzeff N., Walker A.R., Da Costa G.S., 1996. ApJ, 467, L1.
- [21] Lilly S., et al., 1998. ApJ, 500, 75.
- [22] Lisenfeld U., Völk H., Xu C., 1996, A&A, 314, 745.
- [23] Petrosian V., 1976, ApJ, 209, L1.
- [24] Poggianti B., Wu H., 2000. ApJ, 529, 157.
- [25] Poggianti B., Bressan A., Franceschini A., 2001, ApJ, 550, 195.
- [26] Richards E. A., Kelloman K., Fomalont R., Windhorst R., Partridge R., 1998, AJ, 116, 1039.
- [27] Roche N., Lowenthal J., Koo D.C., 2002, MNRAS, 330, 307 (RLK02).
- [28] Sadler E.M., Jenkins C.R., Kotanyi C.G., 1989. MNRAS, 240, 591.
- [29] Sandage A., Bedke J., 1998, ‘Atlas of Galaxies’, NASA, SP:496.
- [30] Serjeant S., Mobasher B., Gruppioni C., Oliver S., 2000, MNRAS, 317, 29.
- [31] Smith D., Herter T., Haynes M., Beichman, C., Gautier T., 1996, ApJS, 104, 217.
- [32] Weistrop D., Wall J., Fomalont E.B., Kellermann K., 1987, AJ, 93, 805.
- [33] Windhorst R.A., Fomalont E.B., Kellermann K.I., Partridge R.B., Richards E., Franklin B.E., Pascarelle S.M., Griffiths R.E., 1995, Nature, 375, 471.
- [34] Windhorst R.A., Fomalont E.B., Partridge R.B., Lowenthal J.D., 1993, ApJ, 405, 498.