The EUVE point of view of AD Leo
All the Extreme Ultraviolet Explorer (EUVE) observations of AD Leo, totalling 1.1 Ms of exposure time, have been employed to analyze the corona of this single M dwarf. The light curves show a well defined quiescent stage, and a distribution of amplitude of variability following a power law with a index. The flaring behavior exhibits much similarity with other M active stars like FK Aqr or YY Gem, and flares behave differently from late type active giants and subgiants. The Emission Measure Distribution (EMD) of the summed spectrum, as well as that of quiescent and flaring stages, were obtained using a line-based method. The average EMD is dominated by material at log T(K)6.9, with a second peak around log T(K)6.3, and a large increase in the amount of material with log T(K)7.1 during flares, material almost absent during quiescence. The results are interpreted as the combination of three families of loops with maximum temperatures at log T(K)6.3, 6.9 and somewhere beyond log T(K)7.1. A value of the abundance of [Ne/Fe]=1.050.08 was measured at log T(K)5.9. No significative increment of Neon abundance was detected between quiescence and flaring states.
Key Words.:
stars: coronae – stars: individual: AD Leo – x-rays: stars – stars: late-type – stars: flare – stars: low mass1 Introduction
AD Leo (GL 388) is a dM3 star located at a distance of 4.9 pc (Henry et al., 1994). It is a well known frequent source of flares. Its high activity is probably due to its high rotation rate (P2.7 d, Spiesman & Hawley, 1986), and a large number of studies on this star has been carried out because of its nature as a very active single star. M stars are supposed to have a large convective layer, resulting in a high level of photospheric spot coverage and frequent flaring activity. With a mass of , AD Leo would still be close to the limit where the radiative core of the star is still present (Favata et al., 2000). Studies in X-rays reflect that M stars are the stellar class with highest LX/Lbol values, binary systems or very young stars apart.
AD Leo is one of the paradigms of flaring stars, and has been subject of frequent studies in the EUV and X-rays. X-rays low resolution spectra have been used by several authors (see Favata et al., 2000, and references therein) to obtain fits to 2 or 3 temperatures that could explain such spectra. With the advent of the Extreme Ultraviolet Explorer (EUVE) it was possible to obtain the first high resolution spectra, and an analysis based on 85 ks of observation permitted Cully et al. (1997) to get an Emission Measure Distribution (EMD) during different activity levels. However, the low statistics of the observation did not allow an accurate analysis of the EMD to be performed, and in the best case only 3 lines had signal-to-noise ratio (S/N) higher than 4, making only indicative the analysis on the variations between quiescent and flaring stages. Some studies relative to the EUVE light curves have been carried out by Hawley et al. (1995), Güdel et al. (2001), and Hawley (2001), but no deep analysis in has been conducted from high quality EUVE spectra to date.
More recently, the analysis of Chandra/Low-Energy Transmission Grating (LETG) spectrum (Maggio et al., 2001) has been used to get values of the abundances, and an EMD peaking at log T(K)6.8. The EUVE satellite (70–750 Å) has the advantage in respect of Chandra (1–175) and the X-ray Multi Mirror telescope (XMM-Newton) (5–35) of a good coverage of lines of just one element. Iron lines observed with EUVE permit calculating the structure of the EMD in the range log T(K)5.8–7.4 without any ambiguity produced by the use of different values of abundances of the elements observed. In contrast, Chandra or XMM-Newton can observe a larger number of lines, also with higher spectral resolution, from different elements, covering a larger temperature region [up to log T(K)8]. But in order to get a good temperature coverage, the spectral lines corresponding to different elements must be used. Hence if no proper calculation of the abundances is performed in the analysis of such spectra, this can result in a wrong EMD. While the combination of the observations with EUVE and Chandra or XMM-Newton is desirable, the frequent variability of a star like AD Leo makes such analysis difficult. Finally, the observations made with EUVE tend to span long periods of time (several days) in order to achieve good statistics in the spectra, permitting to get a good analysis on coronal variability, and even a separate analysis of flaring and quiescent stages, as it has been done, for example, for several RS CVn stars (Sanz-Forcada et al., 2001, 2002a).
| Start date | SW | MW |
|---|---|---|
| 1 Mar 1993 | 84 622 | 85 271 |
| 3 Mar 1996 | 73 322 | 73 320 |
| 2 Apr 1999 | 46 441 | 44 384 |
| 5 Apr 1999 | 141 885 | 141 888 |
| 9 Apr 1999 | 133 001 | 131 198 |
| 17 Apr 1999 | 177 093 | 176 239 |
| 25 Apr 1999 | 158 084 | 145 181 |
| 6 May 1999 | 190 759 | 147 785 |
| 9 Mar 2000 | 99 952 | 52 686 |
A total of 1 Ms of observations converts AD Leo in the active star most observed with EUVE, yielding a combined spectrum with high statistics, and it permits to study the variability properties observed during an elapsed time of 46 d. In this paper we are presenting the most accurate analysis to date on the EMD of an M star without the ambiguity derived from the use of different elements. The long duration of the observations of AD Leo allows us to perform an analysis of the flaring behavior from high quality spectra, and from the light curves as compared to the Sun. Given the spectral range response of the EUVE/DS (70–175 Å), such light curve will be dominated by emitting material with log T(K)6.7–7.2.
A description of the technical information of the observations is given in Sect. 2. The analysis of data (light curves, spectra, and Emission Measure Distribution) is described in Sect. 3. Results are discussed in Sect. 4 in the context of coronal activity in this and other late type stars, followed by a summary of the conclusions of the work (Sect. 5).
2 Observations
A total of 1 Ms of EUVE observations of AD Leo taken between 1993 and 2000 (Table 1) were made available through the EUVE Data Archive. The EUVE spectrographs cover the spectral range 70–180 Å, 170–370 Å and 300–750 Å for the short-wavelength (SW), medium-wavelength (MW) and long-wavelength (LW) spectrometers respectively, with corresponding spectral dispersion of 0.067, 0.135, and 0.270 Å/pixel, and an effective spectral resolution of 200–400. The Deep Survey (DS) Imager has a bandpass of 80–180 Å and is used for EUV photometry.
| lab | Summed | Quiescent | Flaring | ||||
| Ion | (Å) | S/N | Flux | S/N | Flux | S/N | Flux |
| Short Wavelength Spectrometer | |||||||
| Ne viiib | 88.08 | 12.9 | 1.47e-04 | 10.1 | 1.09e-04 | 5.8 | 2.13e-04 |
| Fe xixc | 91.02 | 8.2 | 7.42e-05 | 3.9 | 1.21e-04 | ||
| Fe xviii | 93.92 | 22.8 | 3.32e-04 | 19.7 | 2.90e-04 | 10.6 | 4.75e-04 |
| Ne viiid | 98.26 | 20.6 | 2.86e-04 | 17.9 | 2.47e-04 | 10.7 | 5.24e-04 |
| Fe xix | 101.55 | 6.4 | 5.30e-05 | 6.6 | 4.80e-05 | 4.3 | 1.06e-04 |
| Fe xxi | 102.22 | 13.6 | 1.39e-04 | 11.4 | 1.13e-04 | 8.1 | 3.22e-04 |
| Ne viii | 103.08 | 8.5 | 7.20e-05 | 7.7 | 6.29e-05 | ||
| Fe xviii | 103.94 | 11.0 | 1.05e-04 | 10.0 | 8.97e-05 | 5.0 | 1.27e-04 |
| Fe xix | 106.33 | 5.6 | 3.62e-05 | 5.6 | 3.81e-05 | 3.3 | 7.15e-05 |
| Fe xixe | 108.37 | 19.3 | 2.37e-04 | 15.5 | 1.83e-04 | 10.9 | 4.91e-04 |
| Fe xix | 109.97 | 5.3 | 3.28e-05 | 4.0 | 2.39e-05 | 3.1 | 6.20e-05 |
| Fe xx | 110.63 | 4.4 | 3.08e-05 | 3.4 | 2.05e-05 | 3.4 | 7.24e-05 |
| Fe xix | 111.70 | 5.0 | 3.86e-05 | 4.0 | 2.65e-05 | 4.1 | 1.02e-04 |
| Fe xxii | 114.41 | 7.7 | 6.47e-05 | 5.0 | 4.12e-05 | 4.6 | 1.22e-04 |
| Fe xxiif | 117.17 | 19.4 | 2.76e-04 | 13.2 | 1.78e-04 | 11.1 | 6.05e-04 |
| Fe xx | 118.66 | 8.3 | 7.42e-05 | 6.9 | 6.61e-05 | 5.4 | 1.92e-04 |
| Fe xix | 120.00 | 7.6 | 7.57e-05 | 8.2 | 8.45e-05 | 4.0 | 1.20e-04 |
| Fe xxi | 121.21 | 2.1 | 2.68e-05 | ||||
| Fe xx | 121.83 | 13.9 | 1.82e-04 | 10.0 | 1.20e-04 | 10.3 | 5.72e-04 |
| Fe xxi | 128.73 | 17.0 | 2.90e-04 | 13.2 | 2.00e-04 | 12.3 | 8.94e-04 |
| Fe xxiiig | 132.85 | 30.4 | 8.69e-04 | 23.2 | 5.95e-04 | 19.9 | 2.40e-03 |
| Fe xxii | 135.78 | 14.0 | 2.25e-04 | 11.0 | 1.67e-04 | 8.4 | 5.18e-04 |
| Fe xxih | 142.16 | 7.7 | 1.00e-04 | 5.4 | 6.45e-05 | ||
| Fe ixi | 171.07 | 9.5 | 3.26e-04 | 8.5 | 3.08e-04 | 5.0 | 3.19e-04 |
| Fe xi | 174.53 | 8.2 | 3.31e-04 | 8.0 | 3.45e-04 | ||
| Fe xii,j | 180.40 | 1.52e-04 | |||||
| Medium Wavelength Spectrometer | |||||||
| Fe ixi | 171.07 | 2.50e-04 | 2.83e-04 | 2.40e-04 | |||
| Fe xi | 174.53 | 3.9 | 2.83e-04 | ||||
| Fe xi | 177.24 | 4.1 | 3.42e-04 | ||||
| Fe xii,j | 180.40 | 5.9 | 1.31e-04 | 5.9 | 1.34e-04 | 4.8 | 3.57e-04 |
| Fe xxivk | 192.04 | 10.3 | 1.65e-03 | ||||
| Fe xiil | 193.51 | 18.9 | 1.07e-03 | 16.0 | 9.00e-04 | 5.0 | 4.18e-04 |
| Fe xii | 195.12 | 4.4 | 3.66e-04 | ||||
| Fe xiiim | 203.83 | 9.0 | 2.69e-04 | 8.9 | 2.76e-04 | 3.5 | 2.81e-04 |
| Fe xivn | 211.33 | 10.1 | 3.16e-04 | 7.7 | 2.25e-04 | 3.3 | 2.58e-04 |
| He ii | 256.32 | 15.8 | 8.38e-04 | 13.6 | 7.29e-04 | 9.6 | 1.94e-03 |
| Fe xv | 284.15 | 15.6 | 6.87e-04 | 13.4 | 6.28e-04 | 7.3 | 1.05e-03 |
| Fe xvi | 335.41 | 12.5 | 3.99e-04 | 12.4 | 4.42e-04 | 5.1 | 3.83e-04 |
| Fe xvi | 360.80 | 6.5 | 1.14e-04 | 5.9 | 1.10e-04 | ||
a“Flux” represents Flux at Earth, expressed in ph cm-2 s-1 in the line. Iron lines marked with * were not considered in the EMD calculation. Columns with S/N represent the signal-to-noise ratio (see text).
bBlend with Ne viii 88.12. Both lines are included in the measurement.
cBlend with Fe xxi 91.28. Both lines are included in measurement.
dBlend with Fe xxi 97.88, Ne viii 98.11, 98.27. All lines are included in measurement and modeled accordingly.
eBlend with Fe xxi 108.12. Both lines are included in the measurement.
fBlend with Fe xxi 117.51. Both lines are included in the measurement.
gBlend with Fe xx 132.85. Both lines are included in measurement and modeled accordingly.
hBlended with Fe xxi 142.27. Both lines are included in measurement.
iThese lines are near the spectrometer limits and may be difficult to measure in either SW or MW. The lack of redundant measurements indicates that the lines were weak and/or noisy.
jBlend with Fe x 180.41, Fe xxi 180.55 and Fe xi 180.60. All lines included in measurement and modeled accordingly.
kMay include blend of O v (192.751, 192.799, 192.906), Fe xii (192.394) and possibly other weaker components.
lBlend with Fe xxiv 192.04 (and its mentioned blends) and Fe xii 195.12, in quiescent and summed stages, are included in the measurement.
mComplex blend with Fe xiii 203.79, 204.26, Fe xvii 204.65, and possibly other weaker components.
nBlend with Fe xii 211.74. Both lines are included in measurement.


EUVE light curves for the target (Fig. 1), were made from the DS image, by taking a circle centered on the source, and subtracting the equivalent sky background within an annulus measured around the center. Standard procedures were used in the IRAF package EUV v1.9, with a time binning of 600 s. Points affected by the “dead spot” are marked as open circles in the light curves, while filled circles mark the unaffected points. The “dead spot” is a low gain area of the DS detector that affects some of the EUVE observations taken in 1993 and 1994, resulting in variable levels of contamination of the signal (see Miller-Bagwell & Abbott, 1995). However, part of the observations of AD Leo taken in 1999 seem to be partially affected by the “dead spot”. Although the flux seems to be at the same level as the rest of the 1999 campaign, the affected points (both in 1993 and in 1999) were discarded for the statistical analysis on variability of the star.
The variations observed in the light curves show different activity levels, including some flaring episodes. Quiescent and flaring states were identified in the light curves; vertical lines separate the different states in the light curves. Spectra binned over these selected intervals were extracted from the SW and MW spectrographs (Fig. 2), but since the LW spectra did not show enough statistics for its extraction in all intervals, they were discarded. Line fluxes of strong lines identified in the summed, flaring and quiescent EUVE spectra, are given in Table 2. S/N of the lines is defined as , where S is net signal, B is the estimated average background, and n is the oversampling ratio (i.e., the number of background pixels to the number of source pixels in the image), having a typical value of n10–15 in our extraction. S and B are calculated for the total integrated line signal (minus continuum for SW lines) and background.
3 Data Analysis
3.1 Light Curves
The EUVE light curves of AD Leo show the presence of frequent flaring events, usually of “short” duration (less than 1 day) but quite intense (Fig. 1). Although in the case of the 1993 campaign a flaring event starting at JD 2,449,049 was interpreted as only one flare by Hawley et al. (1995), the complex structure observed might actually correspond to the overlap of two or even three flares happening close in time. The observed behaviour in this flaring event does not seem to have repeated in the rest of the AD Leo observations. The presence of short and intense flares in the EUV and X-rays light curves is usually found in other dM stars, such as FK Aqr or YY Gem (Sanz-Forcada et al., 2002b), and it contrasts with the long duration flares found for some active binary systems with an evolved component (Sanz-Forcada et al., 2002a), like UX Ari (K0IV/G5V), Gem (K1III/?) or V711 Tau (K1IV/G5IV). Moreover, the short duration flares seem to be common among dwarf stars of earlier types too, like LQ Hya (K2V) or CrB (G0V/F6V), either in EUVE or in X-rays (see, for instance, Covino et al., 2001; Osten et al., 2000; Sanz-Forcada et al., 2002b).


The long duration of the observations of AD Leo with EUVE, spanning 45 d, allows us to make some statistical studies on the distribution of variability of this dM star. All the observations unaffected by the dead spot were used for such statistics, although the results are essentially the same when the rest of the data are included in the analysis. Different time binning of the light curves (300, 600, 1200, 3000, 6000 s) was tried with the aim to explore different time scales. In order to charachterize the variability of the star we plot a distribution of the number of bins corresponding to the observed count rate (Fig. 3). The quiescent count rate was found to be Lqsc=0.20 cts s-1, with some points having lower flux corresponding to the expected statistical deviations predicted by fluctuations (a gaussian distribution with a width of = , where bin is the binning time and max is the maximum value). The quiescent count rate was then used to evaluate the cumulative variability amplitude (number of points with count rate above a given value, defined as W=L/Lqsc). An increase in the bin size used in the light curves sampling (from 300 to 6000 s) results in a slightly faster decrease of the distribution for larger amplitudes. This is the consequence of smoothing the flaring behaviour in a larger bin size. The distribution of the amplitude variability using a 600 s binning, shows a W-2.391±0.006 distribution. A similar distribution has been obtained for a 600 s binning of the light curves of YY Gem (dM1/dM1) and FK Aqr (dM2/dM3), as reported in Sanz-Forcada et al. (2002b), spanning a total of 10 d and 19 d respectively, as shown in Fig. 3. The time spanned for these two objects is smaller than for AD Leo, and this could hide effects occuring at longer time scales, apart from being less representative of the average behaviour of the mentioned stars. Despite this caveat, FK Aqr shows a behaviour very similar to that of AD Leo (with a dependency of W-2.50±0.01). On the other hand, YY Gem had a lower number of flares, resulting in a faster decrease for W3 (W-3.57±0.05), but for large flares it shows the same level of amplitude as AD Leo. For comparison we have reported also the distribution of variability of a sample of dM stars observed with ROSAT/PSPC (6–100 Å) by Marino et al. (2000), and of the 15 ks ROSAT/PSPC observations of AD Leo (Marino, 1997). The flux detected at shorter wavelengths is expected to reflect the behaviour of material emitting at higher temperature, that is more subject to flaring activity, producing a the lower slope (W-1.69±0.02) in the distribution of the X-rays observations of M stars. Although the 15 ks of ROSAT observations available (against 1.1 Ms of EUVE) are a short interval of time, the distribution of amplitude of AD Leo in the ROSAT band (partially overlaping EUVE/DS) is remarkably similar to that of EUVE.
3.2 Spectra
The spectrum of AD Leo (Fig. 2) is dominated by lines formed at high temperatures, like Fe xv–xxiv. The good statistics achieved also permitted observing lines from lower ionization states of Fe (Fe ix–xiv) and even three Ne viii lines, as listed in Table 2. Finally, the frequent flaring behaviour of AD Leo has allowed a good quality separated analysis of flaring and quiescent spectra to be performed. Such analysis has shown an enhancement of most of the spectral lines (see Fig. 2), and in particular the hottest lines observable with EUVE, like Fe xxiii/xx 133 and Fe xxiv 192, with a factor of 4 and 15 (estimated from the blend with nearby lines, see Table 2) increase between quiescent and flaring stages. These enhancements affecting the hot lines are larger than those found in the large flares observed by Sanz-Forcada et al. (2002a) in RS CVn stars (binary systems usually including at least an evolved late type star, and with high activity levels due to their high rotation) like UX Ari or Gem, probably due to the more impulsive behaviour of the AD Leo flares. Note that the whole flaring process is averaged in these spectra, and hence a longer decay, like those typically observed in the mentioned active binaries, will decrease the intensity of the spectral lines with respect to the peak of the flare. An alternative explanation for these enhancements could be the hotter temperature of the flares in AD Leo as compared to those in the RS CVn stars. However, the analysis of the temperature structure by means of the EMD (see below) does not show any substantial difference during AD Leo flares in comparison with the flaring EMDs reported in Sanz-Forcada et al. (2002a), and hence we can reject this possibility.
The observed ratio of Fe xvi 335.41/360.80 from the summed spectra has been used to calculate the interstellar hydrogen absorption. Its comparison with the theoretical branch ratio yields a value =3.41018 cm-2, used in combination with a ratio He i/H i=0.09 (Kimble et al., 1993) to correct the observed fluxes for interstellar hydrogen and helium continuum absorption. This value is consistent with the amount =31018 cm-2 reported by Cully et al. (1997) from the EUVE 1993 observations. Procyon, a nearby star to AD Leo, provides a value that can be checked for consistency. Linsky et al. (1995) obtained a close result (=1.21018 cm-2) in Procyon by fitting the Lyman profile.
Some electron density diagnostics are available from the observed EUVE spectra. Line ratios from Fe xix–xxii have been employed to calculate the electron density of the plasma emitting at log T(K)7.0, resulting in an average value of log (cm-3) 12.9, 12.9 and 12.7 for the summed, quiescent and flaring spectra respectively (see Fig. 7). Although the data show some dispersion in the values, and in most cases the error bars make the values of quiescent and flaring stages compatible. There seems to be present a tendency towards a decrease in the electron density during the flares. This behavior contrasts with the increase observed in some RS CVn stars analyzed by Sanz-Forcada et al. (2001, 2002a). Further comments on this issue will follow in Sect. 4.
| log T | log (cm-3)a | ||
|---|---|---|---|
| () | S | Q | F |
| 5.5 | 47.90: | 47.90: | 47.90: |
| 5.6 | 47.85: | 47.85: | 47.85: |
| 5.7 | 47.75: | 47.75: | 47.75: |
| 5.8 | 47.85 | 47.85 | 47.85 |
| 5.9 | 48.10 | 48.15 | 48.10 |
| 6.0 | 48.50 | 48.45 | 48.50 |
| 6.1 | 48.90 | 48.80 | 48.90 |
| 6.2 | 49.30 | 49.10 | 49.35 |
| 6.3 | 49.50 | 49.45 | 49.80 |
| 6.4 | 49.20 | 49.15 | 49.20 |
| 6.5 | 49.30 | 49.25 | 49.30 |
| 6.6 | 49.55 | 49.55 | 49.55 |
| 6.7 | 49.90 | 49.90 | 49.90 |
| 6.8 | 50.15 | 50.10 | 50.20 |
| 6.9 | 50.25 | 50.20 | 50.60 |
| 7.0 | 50.05 | 49.95 | 50.10 |
| 7.1 | 49.85 | 49.50 | 50.20 |
| 7.2 | 49.65 | 49.30 | 50.25 |
| 7.3 | 49.60 | 49.25 | 50.50 |
| 7.4 | 49.55 | 49.20 | 50.65 |
| 7.5 | 49.50: | 49.20: | 50.65: |
| 7.6 | 49.50: | 49.20: | 50.65: |
| 7.7 | 49.50: | 49.20: | 50.65: |
| 7.8 | 49.50: | 49.20: | 50.65: |
aEmission Measure, where and are electron and hydrogen densities, in . A colon indicates that the EMD value is uncertain because few lines occur in the temperature region.
3.3 Emission Measure Distribution
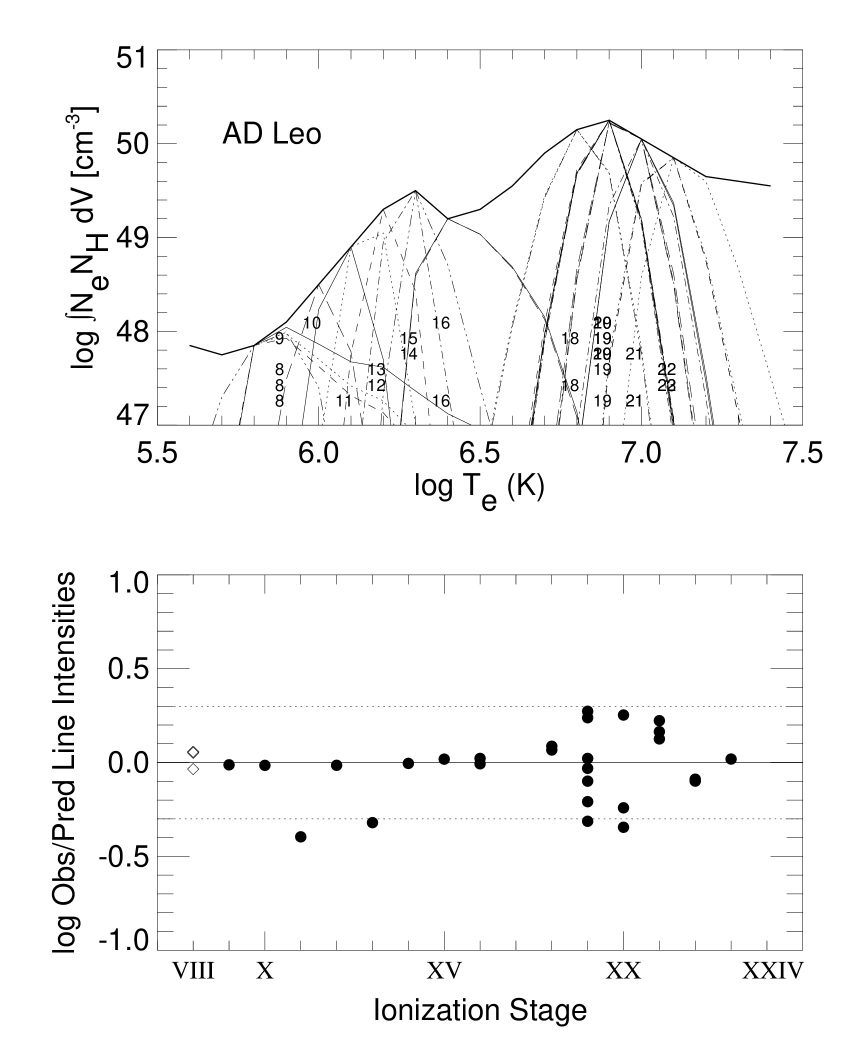
A line-based analysis of the emission spectra is employed in order to calculate the EMD ( cm-3, where and are electron and hydrogen densities, in cm-3) of the observed fluxes (Fig. 4). The EUVE spectral coverage permits using lines of all stages of iron ionization from Fe ix through Fe xxiv except for Fe xvii, which has no transitions in the EUV spectral range. The analysis uses the line emissivities calculated by Brickhouse et al. (1995) for the EUVE iron lines, based on a solar iron abundance111The solar iron abundance is defined as (12. log ), where represents the ratio of iron to hydrogen by number. of 7.6 (Allen, 1973), and corrected to match an iron abundance of 7.67 (Anders & Grevesse, 1989). Theoretical fluxes were calculated using assumed EMDs (see Dupree et al., 1993; Brickhouse & Dupree, 1998; Sanz-Forcada, 2001, and references therein) which were then compared with the observed fluxes, in order to obtain the EMD that best fits the fluxes within a factor of two. Non iron lines, including some involved in complex blends, have been evaluated by using the Astrophysical Plasma Emission Code (APEC) v1.10 (Smith et al., 2001). The quiescent and flaring spectra have been used to perform a separated analysis of their EMD (see Table 3). The flaring fluxes resulted in an increase of the EMD, progressively higher for higher temperatures, as displayed in Fig. 5. A similar analysis was made by Sanz-Forcada et al. (2002a) for a sample of active binary systems, resulting in a relatively uniform increase of the EMD in the range log T(K)5.8–7.3. This contrasts with the behavior observed in AD Leo, where the EMD is more enhanced at hot temperatures (by a factor of 9 at log T(K)=7.2).

The EMD of AD Leo has been compared with the EMD calculated in the same manner by Sanz-Forcada et al. (2002b) for the active binary systems YY Gem (dM1e/dM1e) and FK Aqr (dM2e/dM3e) weighted by the stellar radii as shown in Fig. 6. The fast rotator YY Gem (Pphot=0.8 d) seems to have a slightly larger EMD than AD Leo (Pphot=2.7 d) and FK Aqr (Pphot=4.4 d), although an accurate knowledge of the elements abundances (specially Fe) would be required to know the general level of each star. However, the shape remains very similar in the temperature range where the EMD is well defined for the 3 stars, and it is almost coincident for FK Aqr and AD Leo, for which there are data in the whole temperature range.
Once the EMD was calculated using only iron lines, three Ne viii lines (see Table 2 and Fig. 8) were added to the analysis in order to estimate the abundance of Ne based on Anders & Grevesse (1989) solar photospheric abundances. The lines of Fe ix and Fe x observed in the EUVE spectra permit us to have a reference of the EMD at log T(K)5.9, the same temperature range at which the Ne viii lines are formed (see Fig. 4), with error bars that can be estimated directly from the observational uncertainties in the 3 Ne and 2 Fe lines involved in the analysis. Once this abundance is set to [Ne/Fe]=1.050.08, the predicted lines have shown a fit within 0.1 dex with the EMD predicted from EUVE. The abundance found in the quiescent and flaring phases was [Ne/Fe]=1.000.09 and [Ne/Fe]=1.150.18 respectively. Although there could be some increment in the value of the abundance of Ne during flares with respect to quiescence, the uncertainties in the calculation prevent any conclusion. The value of abundance of Ne found is inconsistent with the value of 0.4 calculated by Maggio et al. (2001) from Chandra/LETG data. Some factors could be responsible for the discrepancy: although based on a smaller number of lines, the EUVE spectra allow us to cover the whole temperature range log T(K)5.8–7.3 using only Fe lines; as a consequence, the two lines of Fe ix and Fe x can be used in combination with the Ne viii lines formed at the same temperature. Chandra spectra instead, permit using more lines, though combined from different elements in the whole temperature range; the uncertainties in the knowledge of abundances of the elements may influence the result, as well as a worse temperature coverage for Fe lines alone, used as reference for the rest of the analysis in Maggio et al. (2001). The exact shape of the EMD may strongly influence the analysis of the abundance found from Chandra spectra, where some lines of Ne x showed some discrepancy with the EMD and the abundances proposed by Maggio et al. (2001), while the presence of Fe lines in the same temperature range makes the EUVE analysis independent of the shape of the EMD.

The large value of the Ne abundance found with EUVE data in AD Leo is remarkably similar to the value of [Ne/Fe]=0.990.11, found in the active binary system V711 Tau from Chandra High-Energy Transmission Grating data by Drake et al. (2001). The EMD of this system is also similar to that of AD Leo, up to log T(K)7.0, and this Ne enhancements could be somehow related to the structures formed in the range log T(K)6.4–6.9, not commonly observed in the Sun.
4 Discussion
The light curves and EMD of the flaring stages of AD Leo show a different behavior with respect to that observed in the RS CVn stars analyzed in Sanz-Forcada et al. (2002a): (i) flares in AD Leo and other M dwarfs (may be even G or K dwarfs) tend to be short and intense, in contrast with the long-lasting flares observed in giant and subgiant G or K stars; (ii) the EMD is largely enhanced at the hottest temperatures during flares, differently from the uniform increase of the EMD observed in the active binaries with an evolved component; (iii) finally, the electron density at log T(K)6.9 on the evolved stars increases during flares, while in AD Leo the electron density, at most, remains constant.

Previous work by Cully et al. (1997) calculated the EMD of AD Leo for different activity levels of the 1993 observations. Although poorly constrained due to low statistics, the authors found a quiescent EMD dominated by material at log T(K)6.8–7.2 that they interpreted as a distribution of coronal loops with peak temperatures in that range. The application of loop models developed by Hawley et al. (1995) led Cully et al. (1997) to estimate long loop lengths and densities in the range log (cm-3)9–11 at flare peak.
The EMD calculated in the present paper could be, in principle, interpreted as the combination of different families of loops peaking at temperatures of log T(K)6.3, log T(K)6.9 and log T(K)7.3, as proposed in Sanz-Forcada et al. (2002a). According to that explanation, the material emitting at log T(K)6.9 would actually correspond to the loops of the second and third families of loops. Hence, the electron density measured at that temperature is weighting the number of loops of both families, families that could actually be characterized by different densities. Some of these loops could actually be related with unresolved solar-like flares, as proposed by Reale et al. (2001), and this would explain the high electron densities measured in these stars even in the absence of large flares. The observed tendency towards a decrease in electron density in AD Leo, rather than being real might be related to the mentioned balance of loops. When the observed flares occurred, the number of the third group of loops would increase, while the number of loops of the first and second groups would not grow so much, or they could be transforming into hotter loops. If the third group was made of flaring loops with lower density, the increase in the number of these loops would result in a decrease in the measured density at log T(K)6.9, unless there was sufficient increment in density in the second group of loops. In the case of the active binary systems this effect is not present because the number of loops of the third group is already high even in the “quiescent” stage, and the addition of such loops would be unable to compensate the possible increment of density produced in the second family of loops. It must be noticed that the observed quiescent flux level could actually be reflecting some flaring activity not resolved by the time scale of the EUVE light curves.
It is possible to have a first approximation, for the case of AD Leo, on the scale size of the third family of loops as compared to those of the second group, by applying the scaling laws proposed by Rosner et al. (1978): , where is the maximum temperature of the loop, is a constant independent of the loop characteristics, is the density in the loop, and is the loop length scale. Hence, if we assume to have the same density in the second and third group of loops (it could even be lower in the third group), an increment in temperature would automatically imply a larger loop length, and hence we can expect that the loops peaking at log T(K)7.1 will have a larger scale size than those peaking at log T(K)6.9.

The differences observed between the flares in AD Leo (and other dM stars, may be even G and K dwarfs) and those in some RS CVn systems, seem to point to a different flaring mechanism in M dwarf stars with respect to that of evolved earlier type stars. While the latter can sustain a long-lasting flare, with duration of several days in the EUV and X-rays bands, the dM stars seem to have short duration flares, with faster decays after the peak has been reached, and affecting especially the region at log T(K)7.1. A continued heating or a different loop length could be directly responsible for these differences. The different stellar structure of dwarf and giant (and subgiant) stars may be the physical reason behind these different flaring behaviors.
5 Conclusions
We have analyzed 1.1 Ms of EUVE observations of AD Leo. The star shows a relevant flaring activity allowing us to study the variability frequency in the EUV band and the spectral properties during both the quiescent and the flaring states. Results imply the next conclusions:
-
•
Statistics carried out on flaring frequency show similar behavior to other active dM stars like FK Aqr, with a well defined quiescent stage and a distribution of amplitude variability following a power law with an index of .
-
•
The Emission Measure Distribution (EMD) of AD Leo has been calculated from EUVE spectra. The EMD is dominated by a well defined enhancement peaking around log T(K)6.9, and shows the presence of a second peak at log T(K)6.3. The enhancements remained constant in temperature regardless of flaring activity.
-
•
A large increase in the amount of material at log T(K)7.1 has been found during flaring stages, with an EMD increment higher than at lower temperatures. The electron density at log T(K)7 [log (cm-3)12.9] did not show any enhancement during flares, contrary to the tendency observed in some RS CVn stars.
-
•
The combination of three families of loops, with maximum temperatures at log T(K)6.3, log T(K)6.9 and somewhere at log T(K)7.1 respectively, has been proposed to explain the observed EMD. Electron density in the loops peaking at log T(K)7.1 must be lower than the density of loops at log T(K)6.9. Differences in the stellar structure of dwarf and evolved stars are the most probable cause for the differences found in their flaring behavior.
-
•
A large value of the abundance of Ne ([Ne/Fe]1.050.08) at log T(K)5.9 was found with respect to solar photospheric value. No significative increment in the abundance was detected during flares.
Acknowledgements.
We acknowledge support by the Marie Curie Fellowships Contract No. HPMD-CT-2000-00013. We have made use of data obtained through the High Energy Astrophysics Science Archive Research Center Online Service, provided by the NASA/Goddard Space Flight Center. This research has also made use of NASA’s Astrophysics Data System Abstract Service.References
- Allen (1973) Allen, C. W. 1973, Astrophysical Quantities (London: University of London, Athlone Press, —c1973, 3rd ed.)
- Anders & Grevesse (1989) Anders, E. & Grevesse, N. 1989, Geochim. Cosmochim. Acta., 53, 197
- Brickhouse & Dupree (1998) Brickhouse, N. S. & Dupree, A. K. 1998, ApJ, 502, 918
- Brickhouse et al. (1995) Brickhouse, N. S., Raymond, J. C., & Smith, B. W. 1995, ApJS, 97, 551
- Covino et al. (2001) Covino, S., Panzera, M. R., Tagliaferri, G., & Pallavicini, R. 2001, A&A, 371, 973
- Cully et al. (1997) Cully, S. L., Fisher, G. H., Hawley, S. L., & Simon, T. 1997, ApJ, 491, 910
- Drake et al. (2001) Drake, J. J., Brickhouse, N. S., Kashyap, V., et al. 2001, ApJ, 548, L81
- Dupree et al. (1993) Dupree, A. K., Brickhouse, N. S., Doschek, G. A., Green, J. C., & Raymond, J. C. 1993, ApJ, 418, L41
- Favata et al. (2000) Favata, F., Micela, G., & Reale, F. 2000, A&A, 354, 1021
- Güdel et al. (2001) Güdel, M., Audard, M., Guinan, E. F., et al. 2001, in ASP Conf. Ser. 223, The Eleventh Cambridge Workshop on Cool Stars, Stellar Systems and the Sun, eds. R. J. García López, R. Rebolo, & M. R. Zapatero Osorio (San Francisco: ASP), 1085
- Hawley (2001) Hawley, S. L. 2001, in ASP Conf. Ser., The Twelfth Cambridge Workshop on Cool Stars, Stellar Systems and the Sun, eds. T. Ayres & A. Brown (Boulder: ASP)
- Hawley et al. (1995) Hawley, S. L., Fisher, G. H., Simon, T., et al. 1995, ApJ, 453, 464
- Henry et al. (1994) Henry, T. J., Kirkpatrick, J. D., & Simons, D. A. 1994, AJ, 108, 1437
- Kimble et al. (1993) Kimble, R. A., Davidsen, A. F., Long, K. S., & Feldman, P. D. 1993, ApJ, 408, L41
- Linsky et al. (1995) Linsky, J. L., Diplas, A., Wood, B. E., et al. 1995, ApJ, 451, 335
- Maggio et al. (2001) Maggio, A., Drake, J. J., Kashyap, V., et al. 2001, in Stellar Coronae in the Chandra and XMM-Newton era, ed. by J. Drake, & F. Favata (Noordwijk: ASP), in press
- Marino (1997) Marino, A. 1997, Tesi di Laurea, University of Palermo
- Marino et al. (2000) Marino, A., Micela, G., & Peres, G. 2000, A&A, 353, 177
- Miller-Bagwell & Abbott (1995) Miller-Bagwell, A. & Abbott, M. 1995, EUVE Guest Observer Data Products Guide
- Osten et al. (2000) Osten, R. A., Brown, A., Ayres, T. R., et al. 2000, ApJ, 544, 953
- Reale et al. (2001) Reale, F., Peres, G., & S., O. 2001, ApJ, in press
- Rosner et al. (1978) Rosner, R., Tucker, W. H., & Vaiana, G. S. 1978, ApJ, 220, 643
- Sanz-Forcada (2001) Sanz-Forcada, J. 2001, in ASP Conf. Ser., The Twelfth Cambridge Workshop on Cool Stars, Stellar Systems and the Sun, eds. T. Ayres & A. Brown (Boulder: ASP), in press
- Sanz-Forcada et al. (2001) Sanz-Forcada, J., Brickhouse, N. S., & Dupree, A. K. 2001, ApJ, 554, 1079
- Sanz-Forcada et al. (2002a) —. 2002a, ApJ, 570, 799
- Sanz-Forcada et al. (2002b) —. 2002b, ApJ, submitted
- Smith et al. (2001) Smith, R. K., Brickhouse, N. S., Liedahl, D. A., & Raymond, J. C. 2001, ApJ, 556, L91
- Spiesman & Hawley (1986) Spiesman, W. J. & Hawley, S. L. 1986, AJ, 92, 664