Cosmology with the Sunyaev-Zel’dovich Effect
Abstract
The Sunyaev-Zel’dovich effect (SZE) provides a unique way to map the large-scale structure of the universe as traced by massive clusters of galaxies. As a spectral distortion of the cosmic microwave background, the SZE is insensitive to the redshift of the galaxy cluster, making it well-suited for studies of clusters at all redshifts, and especially at reasonably high redshifts () where the abundance of clusters is critically dependent on the underlying cosmology. Recent high signal-to-noise detections of the SZE have enabled interesting constraints on the Hubble constant and the matter density of the universe using small samples of galaxy clusters. Upcoming SZE surveys are expected to find hundreds to thousands of new galaxy clusters, with a mass selection function that is remarkably uniform with redshift. In this review we provide an overview of the SZE and its use for cosmological studies with emphasis on the cosmology that can, in principle, be extracted from SZE survey yields. We discuss the observational and theoretical challenges that must be met before precise cosmological constraints can be extracted from the survey yields.
keywords:
galaxy clusters, cosmic microwave background, structure formation, surveys1 INTRODUCTION
The Sunyaev-Zel’dovich Effect (SZE) offers a unique and powerful observational tool for cosmology. Recently, there has been considerable progress in detecting and imaging the SZE. Efforts over the first two decades after the SZE was first proposed in 1970 (Sunyaev & Zel’dovich, 1970, 1972) yielded few reliable detections. Over the last decade, new detectors and observing techniques have allowed high quality detections and images of the effect for more than 50 clusters with redshifts as high as one. The next generation of SZE instruments that are now being built or planned will be orders of magnitude more efficient. Entering the fourth decade of SZE observations, we are now in position to exploit fully the power of the SZE, by obtaining detailed images of a set of clusters to understand the intra-cluster medium (ICM), by obtaining large SZE samples of clusters to determine statistically robust estimates of the cosmological parameters and, most importantly, by conducting large untargeted SZE surveys to probe the high redshift universe. These surveys will provide a direct view of the growth of large scale structure and will provide large catalogs of clusters that extend past with remarkably uniform selection functions.
The physics of the SZE has been covered well in previous reviews (Birkinshaw, 1999; Rephaeli, 1995; Sunyaev & Zel’dovich, 1980a ), with Birkinshaw, (1999) and Carlstrom et al, (2000) providing recent reviews of the observations. In this review, we look to the near future, using recent observations as a guide to what we can expect.
The SZE is best known for allowing the determination of cosmological parameters when combined with other observational diagnostics of clusters of galaxies such as X-ray emission from the intracluster gas, weak and strong lensing by the cluster potential, and optical galaxy velocity dispersion measurements. For example, cluster distances have been determined from the analysis of SZE and X-ray data, providing independent estimates of the Hubble constant. A large homogeneous sample of galaxy clusters extending to high redshift should allow a precise measure of this number, as well as a measure of the angular diameter distance relation to high redshift where it is highly sensitive to cosmological parameters. Similarly, the SZE and X-ray measurements will allow tight constraints on cluster gas mass fractions which can be used to estimate assuming the composition of clusters represents a fair sample of the universal composition. The observed redshift dependence of the gas mass fraction can also be used to constrain cosmological parameters as well as test speculative theories of dark matter decay.
The most unique and powerful cosmological tool provided by the exploitation of the SZE will likely be the direct measurement of the evolution of the number density of galaxy clusters by deep, large scale SZE surveys. The redshift evolution of the cluster density is critically dependent on the underlying cosmology, and in principle can be used to determine the equation of state of the dark energy. SZE observations are particularly well suited for deep surveys because the important parameter that sets the detection limit for such a survey is the mass of the cluster; SZE surveys will be able to detect all clusters above a mass limit independent of the redshift of the clusters. This remarkable property of SZE surveys is due to the fact that the SZE is a distortion of the cosmic microwave background (CMB) spectrum. While the CMB suffers cosmological dimming with redshift, the ratio of the magnitude of the SZE to the CMB does not; it is a direct, redshift independent measurement of the ICM column density weighted by temperature, i.e., the pressure integrated along the line of sight. The total SZE flux detected will be proportional to the total temperature-weighted mass (total integrated pressure) and, of course, inversely proportional to the square of the angular diameter distance. Adopting a reasonable cosmology and accounting for the increase in the universal matter density with redshift, the mass limit for a given SZE survey flux sensitivity is not expected to change more than a factor of for any clusters with .
SZE surveys therefore offer an ideal tool for determining the cluster density evolution. Analyses of even a modest survey covering 10 square degrees will provide interesting constraints on the matter density of the universe. The precision with which cosmological constraints can be extracted from much larger surveys, however, will be limited by systematics due to our insufficient understanding of the structure of clusters, their gas properties and evolution.
Insights into the structure of clusters will be provided by high resolution SZE observations, especially when combined with other measurements of the clusters. Fortunately, many of the cluster properties derived directly from observational data can be determined in several different ways. For example, the gas mass fraction can be determined by various combinations of SZE, X-ray, and lensing observations. The electron temperature, a direct measure of a cluster’s mass, can be measured directly through X-ray spectroscopy, or determined through the analysis of various combinations of X-ray, SZE, and lensing observations. Several of the desired properties of clusters are therefore over-constrained by observation, providing critical insights to our understanding of clusters, and critical tests of current models for the formation and evolution of galaxy clusters. With improved sensitivity, better angular resolution, and sources out to , the next generation of SZE observations will provide a good view of galaxy cluster structure and evolution. This will allow, in principle, the dependence of the cluster yields from large SZE surveys on the underlying cosmology to be separated from the dependence of the yields on cluster structure and evolution.
We outline the properties of the SZE in the next section and provide an overview of the current state of the observations in §3. This is followed in §4 by predictions for the expected yields of upcoming SZE surveys. In §5, we provide an overview of the cosmological tests which will be possible with catalogs of SZE-selected clusters. This is followed by a discussion of backgrounds, foregrounds, contaminants, and theoretical uncertainties that could adversely affect cosmological studies with the SZE and a discussion of observations which could reduce or eliminate these concerns. Throughout the paper, is used to parametrize the Hubble constant by km s-1 Mpc-1, and and are the matter density and vacuum energy density, respectively, in units of the critical density.
2 THE SUNYAEV-ZEL’DOVICH EFFECT


2.1 Thermal Sunyaev-Zel’dovich Effect
The Sunyaev-Zel’dovich effect (SZE) is a small spectral distortion of the cosmic microwave background (CMB) spectrum caused by the scattering of the CMB photons off a distribution of high energy electrons. Here we focus only on the SZE caused by the hot thermal distribution of electrons provided by the intra-cluster medium (ICM) of galaxy clusters. CMB photons passing through the center of a massive cluster have only a % probability of interacting with an energetic ICM electron. The resulting inverse Compton scattering preferentially boosts the energy of the CMB photon by roughly causing a small ( mK) distortion in the CMB spectrum. Figure 1 shows the SZE spectral distortion for a fictional cluster that is over 1000 times more massive than a typical cluster to illustrate the small effect. The SZE appears as a decrease in the intensity of the CMB at frequencies GHz and as an increase at higher frequencies.
The derivation of the SZE can be found in the original papers of Sunyaev and Zel’dovich (Sunyaev & Zel’dovich, 1970, 1972), in several reviews (Sunyaev & Zel’dovich, 1980a ; Rephaeli, 1995; Birkinshaw, 1999), and in a number of more recent contributions which include relativistic corrections (see below for references). This review discusses the basic features of the SZE that make it a useful cosmological tool.
The SZE spectral distortion of the CMB expressed as a temperature change at dimensionless frequency is given by
| (1) |
where is the Compton -parameter, which for an isothermal cluster equals the optical depth, , times the fractional energy gain per scattering, is the Thomson cross-section, is the electron number density, is the electron temperature, is the Boltzmann constant, is the electron rest mass energy, and the integration is along the line of sight. The frequency dependence of the SZE is
| (2) |
where is the relativistic correction to the frequency dependence. Note that in the non-relativistic and Rayleigh-Jeans (RJ) limits.
It is worth noting that is independent of redshift as shown in Eq. 1. This unique feature of the SZE makes it a potentially powerful tool for investigating the high redshift universe.
Expressed in units of specific intensity, common in millimeter SZE observations, the thermal SZE is
| (3) |
where and the frequency dependence is given by
| (4) |
and are simply related by the derivative of the blackbody with respect to temperature, .
The spectral distortion of the CMB spectrum by the thermal SZE is shown in Figure 2 (solid line) for a realistic massive cluster () in units of intensity (left panel) and Rayleigh-Jeans (RJ) brightness temperature (right panel). The RJ brightness is shown because the sensitivity of a radio telescope is calibrated in these units. It is defined simply by where is the intensity at frequency , is Boltzmann’s constant, and is the speed of light. The CMB blackbody spectrum, , multiplied by 0.0005 (dotted line) is also shown for comparison. Note that the spectral signature of the thermal effect is distinguished readily from a simple temperature fluctuation of the CMB. The kinetic SZE distortion is shown by the dashed curve (§2.2). In the non-relativistic regime, it is indistinguishable from a CMB temperature fluctuation.
The gas temperatures measured in massive galaxy clusters are around keV (Mushotzky & Scharf, 1997; Allen & Fabian, 1998) and are measured to be as high as keV in the galaxy cluster 1E (Tucker et al, 1998). The mass is expected to scale with temperature roughly as . At these temperatures, electron velocities are becoming relativistic and small corrections are required for accurate interpretation of the SZE. There has been considerable theoretical work to include relativistic corrections to the SZE (Wright, 1979; Fabbri, 1981; Rephaeli, 1995; Rephaeli & Yankovitch, 1997; Stebbins, 1997; Itoh et al, 1998; Challinor & Lasenby, 1998; Sazonov & Sunyaev, 1998a ; Sazonov & Sunyaev, 1998b ; Nozawa et al, 1998b ; Challinor & Lasenby, 1999; Molnar & Birkinshaw, 1999; Dolgov et al, 2001). All of these derivations agree for keV, appropriate for galaxy clusters. For a massive cluster with keV () the relativistic corrections to the SZE are of order a few percent in the RJ portion of the spectrum, but can be substantial near the null of the thermal effect. Convenient analytical approximations to fifth order in are presented in Itoh et al, (1998).
Particularly relevant for finding clusters with an SZE survey is the integrated SZE signal. Because the SZE signal is the integrated pressure, integrating over the solid angle of the cluster provides a sum of all of the electrons in the cluster weighted by temperature. This provides a relatively clean measure of the total thermal energy of the cluster. Integrating the SZE over the solid angle of the cluster, , gives
| (5) |
where is the total number of electrons in the clusters, is the mean electron temperature, is the angular diameter distance, and is the mass of the cluster (either gas or total mass as , where is the gas mass fraction). The integrated SZE flux is simply the temperature weighted mass of the cluster divided by . The angular diameter distance is fairly flat at high redshift. Also, a cluster of a given mass will be denser and therefore hotter at high redshift because the universal matter density increases as . Therefore, one expects an SZE survey to detect all clusters above some mass threshold with little dependence on redshift (see §4.2).
The most important features of the thermal SZE are: 1) it is a small spectral distortion of the CMB of order mK, which is proportional to the cluster pressure integrated along the line of sight [Eq. 1]; 2) it is independent of redshift; 3) it has a unique spectral signature with a decrease in the CMB intensity at frequencies GHz and an increase at higher frequencies; and 4) the integrated SZE flux is proportional to the temperature weighted mass of the cluster (total thermal energy of the cluster) implying that SZE surveys will have a mass threshold nearly independent of redshift.
2.2 Kinetic Sunyaev-Zel’dovich Effect
If the cluster is moving with respect to the CMB rest frame there will be an additional spectral distortion due to the Doppler effect of the cluster bulk velocity on the scattered CMB photons. If a component of the cluster velocity, , is projected along the line of sight to the cluster, then the Doppler effect will lead to an observed distortion of the CMB spectrum referred to as the kinetic SZE. In the non-relativistic limit, the spectral signature of the kinetic SZE is a pure thermal distortion of magnitude
| (6) |
where is along the line of sight; i.e., the emergent spectrum is still described completely by a Planck spectrum, but at a slightly different temperature, lower (higher) for positive (negative) peculiar velocities (Sunyaev & Zel’dovich, 1972; Phillips, 1995; Birkinshaw, 1999, see Figure 2).
Relativistic perturbations to the kinetic SZE are due to the Lorentz boost to the electrons provided by the bulk velocity (Nozawa et al, 1998a ; Sazonov & Sunyaev, 1998a ). The leading term is of order and for a 10 keV cluster moving at 1000 km s-1 the effect is about an 8% correction to the non-relativistic term. The term is only about 1% of the non-relativistic kinetic SZE and the term is only 0.2%.
2.3 Polarization of the Sunyaev-Zel’dovich Effect
The scattering of the CMB photons by the hot ICM electrons can result in polarization at levels proportional to powers of and . The largest polarization is expected from the anisotropic optical depth to a given location in the cluster. For example, toward the outskirts of a cluster one expects to see a concentric (radial) pattern of the linear polarization at frequencies where the thermal SZE is positive (negative). Plots of the polarization pattern are presented in Sazonov & Sunyaev, (1999). Nonspherical morphology for the electron distributions will lead to considerably complicated polarization patterns. The peak polarization of this signal will be order times the SZE signal, i.e., of order times the CMB intensity. For a massive cluster with , the effect would be at the 0.1 K level toward the edge of the cluster. In principle, this effect could be used to measure the optical depth of the cluster and therefore separate and from a measurement of the thermal SZE (see Eq. 1).
It can be shown that polarization of the SZE comes entirely from the quadrupole component of the local radiation field experienced by the scattering electron. In the case above, the quadrupole component at the outskirts of the cluster is due to the anisotropy in the radiation field in the direction of the cluster center due to the SZE. Sunyaev and Zel’dovich discussed polarization due to the motion of the cluster with respect to the CMB and transverse to our line of sight (Sunyaev & Zel’dovich, 1980b , see also Sazonov & Sunyaev, 1999). In this case, the quadrupole comes from the Doppler shift. They found the largest terms to be of order and of the CMB intensity. The latter term, second order in , can be thought of as imperfect cancellation of the dipole term due to the anisotropic optical depth. Using and a bulk motion of 500 km s-1, results in polarization levels of order , far beyond the sensitivity of current instrumentation.
The CMB as seen by the cluster electrons will have a quadrupole component and therefore the electron scattering will lead to linear polarization. This mechanism could possibly be used to trace the evolution of the CMB quadrupole if polarization measurements could be obtained for a large number of clusters binned in direction and redshift (Kamionkowski & Loeb, 1997; Sazonov & Sunyaev, 1999). Sazonov and Sunyaev calculated the expected polarization level and found the maximum CMB quadrupole induced polarization is nK, somewhat higher than the expected velocity induced terms discussed above. The effect is again too small to expect detection in the near future. However, by averaging over many clusters, detecting this polarization might be possible with future satellite missions.
3 STATUS OF OBSERVATIONS
In the twenty years following the first papers by Sunyaev and Zel’dovich (Sunyaev & Zel’dovich, 1970, 1972) there were few firm detections of the SZE despite a considerable amount of effort (Birkinshaw, 1991). Over the last several years, however, observations of the effect have progressed from low S/N detections and upper limits to high confidence detections and detailed images. In this section we briefly review the current state of SZE observations.
The dramatic increase in the quality of the observations is due to improvements both in low-noise detection systems and in observing techniques, usually using specialized instrumentation to control carefully the systematics that often prevent one from obtaining the required sensitivity. The sensitivity of a low-noise radio receiver available 20 years ago should have easily allowed the detection of the SZE toward a massive cluster. Most attempts, however, failed due to uncontrolled systematics. Now that the sensitivities of detector systems have improved by factors of 3 to 10, it is clear that the goal of all modern SZE instruments is the control of systematics. Such systematics include, for example, the spatial and temporal variations in the emission from the atmosphere and the surrounding ground, as well as gain instabilities inherent to the detector system used.
The observations must be conducted on the appropriate angular scales. Galaxy clusters have a characteristic scale size of order a megaparsec. For a reasonable cosmology, a megaparsec subtends an arcminute or more at any redshift; low redshift clusters will subtend a much larger angle, for example the angular extent of the Coma cluster () is of order a degree (core radius ) (Herbig et al, 1995). The detection of extended low surface brightness objects requires precise differential measurements made toward widely separated directions on the sky. The large angular scale presents challenges to control offsets due to differential ground pick-up and atmospheric variations.
3.1 Sources of Astronomical Contamination and Confusion
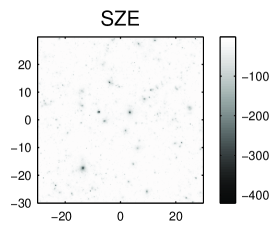
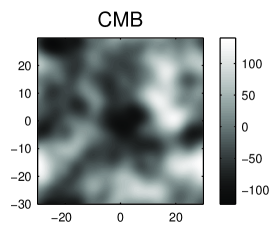
In designing an instrument for SZE observation, one also needs to take into account several sources of possible contamination and confusion from astronomical sources. One such source is anisotropy of the CMB itself (see Figure 3). For distant clusters with angular extents of a few arcminutes or less it is not a serious problem as the CMB anisotropy is expected (Hu & White, 1997) and indeed found to be damped considerably on these scales (Church et al, 1997; Subrahmanyan et al, 2000; Dawson et al, 2001, see also Holzapfel et al, 1997 and LaRoque et al, 2002 for CMB limits to SZE contamination). For nearby clusters, or for searches for distant clusters using beams larger than a few arminutes, the intrinsic CMB anisotropy must be considered. The unique spectral behavior of the thermal SZE can be used to separate it from the intrinsic CMB in these cases. Note, however, that for such cases it will not be possible to separate the kinetic SZE effects from the intrinsic CMB anisotropy without relying on the very small spectral distortions of the kinetic SZE due to relativistic effects.
Historically, the major source of contamination in the measurement of the SZE has been radio point sources. It is obvious that emission from point sources located along the line of the sight to the cluster could fill in the SZE decrement, leading to an underestimate. The radio point sources are variable and therefore must be monitored. Radio emission from the cluster member galaxies, from the central cD galaxy in particular, is often the largest source of radio point source contamination, at least at high radio frequencies (Cooray et al, 1998; LaRoque et al, 2002). The typical spectral index of the radio point sources is for , where is the point source flux. In the RJ limit, the SZE flux is proportional to and therefore point sources are much less of an issue at higher radio frequencies.
Although it is most likely that insufficient attention to radio point sources would lead to the underestimate of the SZE effect, it could also lead to an overestimate. The most obvious example is if unaccounted point sources are in the reference fields surrounding the cluster. An effect due to gravitational lensing has also been pointed out for low frequency observations where the flux from many point sources must be taken into account before a reliable measure of the SZE can be made. Essentially, gravitational lensing increases the efficiency of detecting point sources toward the center of the cluster which could lead to an overestimate of the SZE decrement (Loeb & Refregier, 1997). This effect should be negligible at frequencies greater than roughly 30 GHz.
At frequencies near the null of the thermal SZE and higher, dust emission from extragalactic sources as well as dust emission from our own galaxy must be considered. Dust emission from our Galaxy rises steeply as with the observed dust opacity index found to be over the frequencies of interest.
At the angular scales and frequencies of interest for most SZE observations, contamination from diffuse Galactic dust emission will not usually be significant and is easily compensated. Consider instead the dusty extragalactic sources such as those that have been found toward massive galaxy clusters with the SCUBA bolometer array (Smail et al, 1997). Spectral indices for these sources are estimated to be (Blain, 1998; Fischer & Lange, 1993). Sources with 350 GHz (850 ) fluxes greater than 8 mJy are common and all clusters surveyed had multiple sources with fluxes greater than 5 mJy. A 10 mJy source at 350 GHz corresponds to K for 1′ beam, or a Compton -parameter of . The same source scaled to 270 GHz, assuming a spectrum, corresponds to K at 270 GHz for 1′ beam and a -parameter of . Scaling to the SZE thermal null at 218 GHz gives 3.9 mJy which corresponds to a K for a 1′ beam. This in turn translates directly to an uncertainty in a measurement of the cluster peculiar velocity (Eq. 6); for a massive cluster with an optical depth of 0.01 and an electron temperature of 10 keV, 85 K corresponds to a peculiar velocity of 930 km s-1. The contamination is more severe for less massive clusters with the dependence scaling as . The contamination scales inversely with the beam area.
As with SZE observations at radio frequencies, the analyses of high frequency observations also need to consider the effects of point sources and require either high dynamic angular range, large spectral coverage, or both, to separate the point source emission from the SZE.
3.2 Single Dish Observations
All observations sensitive enough to observe the SZE are differential. The primary issue for single dish observations is how to switch the beam on the sky without introducing systematics comparable to the SZE. This beam switching can be accomplished in several ways, including but not limited to Dicke switching between feeds and chopping mirrors which switch or sweep the beam on the sky. With a single dish telescope, modulation of the beam sidelobes can lead to an offset. This offset can be removed if it remains stable enough to be measured on some portion of the sky without a cluster. However, temperature variations of the optics and features on the ground will cause the offset to change as the source is tracked. Therefore, it has become common practice to observe leading and trailing fields when they have the same position with respect to the ground as the source. In this way, any constant or linear drift in offset can be removed at the price of observing efficiency and sensitivity.
The first measurements of the SZE were made with single dish radio telescopes at centimeter wavelengths. Advances in detector technology made the measurements possible, although early observations appear to have been plagued by systematic errors that led to irreproducible and inconsistent results. Eventually, successful detections using beam switching techniques were obtained. During this period, the pioneering work of Birkinshaw and collaborators with the OVRO 40 meter telescope stands out for its production of results which served to build confidence in the technique (Birkinshaw et al, 1978a ; Birkinshaw et al, 1978b ; Birkinshaw, 1991). More recently, leading and trailing beam switching techniques have been used successfully with the OVRO 5 meter telescope at 32 GHz to produce reliable detections of the SZE in several intermediate redshift clusters (Herbig et al, 1995; Myers et al, 1997; Mason et al, 2001). The SEST 15 meter and IRAM 30 meter telescopes have been used with bolometric detectors at 140 GHz and chopping mirrors to make significant detections of the SZE effect in several clusters (Andreani et al, 1996, 1999; Desert et al, 1998; Pointecouteau et al, 1999, 2001). The Nobeyama 45 m telescope has also been been used at 21 GHz, 43 GHz, and 150 GHz to detect and map the SZE (Komatsu et al, 2001, 1999).
In the Sunyaev-Zel’dovich Infrared Experiment (SuZIE), pixels in a six element 140 GHz bolometer array are electronically differenced by reading them out in a differential bridge circuit (Holzapfel et al, 1997). Differencing in this way makes the experiment insensitive to temperature and amplifier gain fluctuations that produce 1/f noise. This increased low frequency stability allows SuZIE to observe in a drift scanning mode where the telescope is fixed and the rotation of the earth moves the beams across the sky. Using this drift scanning technique, the SuZIE experiment has produced high signal to noise strip maps of the SZE emission in several clusters (Holzapfel et al, 1997; Mauskopf et al, 2000a ).

Because of the high sensitivity of bolometric detectors at millimeter wavelengths, single dish experiments are ideally suited for the measurement of the SZE spectrum. By observing at several millimeter frequencies these instruments should be able to separate the thermal and kinetic SZEs from atmospheric fluctuations and sources of astrophysical confusion. One of the first steps to realizing this goal is the measurement of SZE as an increment. So far, there have been only a few low signal to noise detections at a frequency of approximately 270 GHz. The main reason for the lack of detection is the increased opacity of the atmosphere at higher frequencies. Holzapfel et al, (1997) report a detection of Abell 2163 with the SuZIE instrument at 270 GHz. Andreani et al, (1996) claim detections of the SZE increment in two clusters, although observations of a third cluster appear to be contaminated by foreground sources or systematic errors (Andreani et al, 1999).
Figure 4 shows the measured SZE spectrum of Abell 2163, spanning the decrement and increment with data obtained from different telescopes and techniques (Holzapfel et al, 1997; Desert et al, 1998; LaRoque et al, 2002). The SZE spectrum is a good fit to the data demonstrating the consistency and robustness of modern SZE measurements.
Single dish observations of the SZE are just beginning to reach their potential and the future is very promising. The development of large format millimeter wavelength bolometer arrays will increase the mapping speed of current SZE experiments by orders of magnitude. The first of this new generation of instruments is the BOLOCAM 151 element bolometer array (Mauskopf et al, 2000b ; Glenn et al, 1998) which will soon begin routine observations at the Caltech Submillimeter Observatory. BOLOCAM will observe in drift scanning mode and produce differences between bolometer signals in software. To the extent that atmospheric fluctuations are common across a bolometric array, it will be possible to realize the intrinsic sensitivity of the detectors. Operating from high astronomical sites with stable atmospheres and exceptionally low precipitable water vapor, future large format bolometer arrays have the potential to produce high signal to noise SZE images and search for distant SZE clusters with unprecedented speed.
3.3 Interferometric Observations
The stability and spatial filtering inherent to interferometry has been exploited to make high quality images of the SZE. The stability of an interferometer is due to its ability to perform simultaneous differential sky measurements over well defined spatial frequencies.
An interferometer measures the time averaged correlation of the signals received by a pair of telescopes – all interferometric arrays can be thought of as a collection of two-element interferometers. For each pair of telescopes, the interferometer effectively multiplies the sky brightness at the observing frequency by a cosine, integrates the product and outputs the time average amplitude of the product (see Thompson et al, 2001). In practice the signals are split and two correlations are performed with one being performed with a 90 degree relative phase shift so that the output of the interferometer, referred to as the visibility, is the complex Fourier transform (amplitude and phase) of the sky brightness. The interferometer is therefore only sensitive to angular scales (spatial frequencies) near , where the baseline is the projected separation of the telescopes as seen by the source and is the observation wavelength. The interferometer response is essentially insensitive to gradients in the atmospheric emission or other large scale emission features.
There are several other features which allow an interferometer to achieve extremely low systematics. For example, only signals which correlate between array elements will lead to detected signal. For most interferometers, this means that the bulk of the sky noise for each element will not lead to signal. Amplifier gain instabilities for an interferometer will not lead to large offsets or false detections, although if severe they may lead to somewhat noisy signal amplitude. To remove the effects of offsets or drifts in the electronics as well as the correlation of spurious (non-celestial) sources of noise, the phase of the signal received at each telescope is modulated and then the proper demodulation is applied to the output of the correlator.
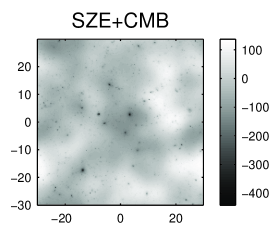
The spatial filtering of an interferometer also allows the emission from radio point sources to be separated from the SZE emission. This is possible because at high angular resolution () the SZE contributes very little flux. This allows one to use long baselines – which give high angular resolution – to detect and monitor the flux of radio point sources while using short baselines to measure the SZE. Nearly simultaneous monitoring of the point sources is important as they are often time variable. The signal from the point sources is then easily removed, to the limit of the dynamic range of the instrument, from the short baseline data which are sensitive also to the SZE.
Figure 5 illustrates the spatial filtering of an interferometer with data on the galaxy cluster RXJ from the BIMA interferometer outfitted with 30 GHz receivers (e.g., Carlstrom et al, 1996, 2000). Panel ) shows the point source subtracted SZE image (contours) overlaid on a ROSAT X-ray image (color scale). Spatial scales typical of galaxy clusters were stressed before deconvolution. A higher resolution SZE image is shown in panel ), showing the range of spatial scales measured by the interferometer. Panel ) shows the long baseline (high angular resolution) data only. The bright on-center point source is readily apparent.
For the reasons given above, interferometers offer an ideal way to achieve high brightness sensitivity for extended low-surface brightness emission, at least at radio wavelengths. Most interferometers, however, were not designed for imaging low-surface brightness sources. Interferometers have been built traditionally to obtain high angular resolution and thus have employed large individual elements for maximum sensitivity to small scale emission. As a result special purpose interferometric systems have been built for imaging the SZE (Jones et al, 1993; Carlstrom et al, 1996; Padin et al, 2000). All of them have taken advantage of low-noise high-electron-mobility-transistor (HEMT) amplifiers (Pospieszalski et al, 1995) to achieve high sensitivity.
The first interferometric detection (Jones et al, 1993) of the SZE was obtained with the Ryle Telescope (RT). The RT was built from the 5 Kilometer Array, consisting of eight 13 m telescopes located in Cambridge, England operating at 15 GHz with East-West configurations. Five of the telescopes can be used in a compact E-W configuration for imaging of the SZE (Jones et al, 1993; Grainge et al, 1993, 1996, 2000; Saunders et al, 2000; Grainger et al, 2001; Grainge et al, 2001; Jones et al, 2001).
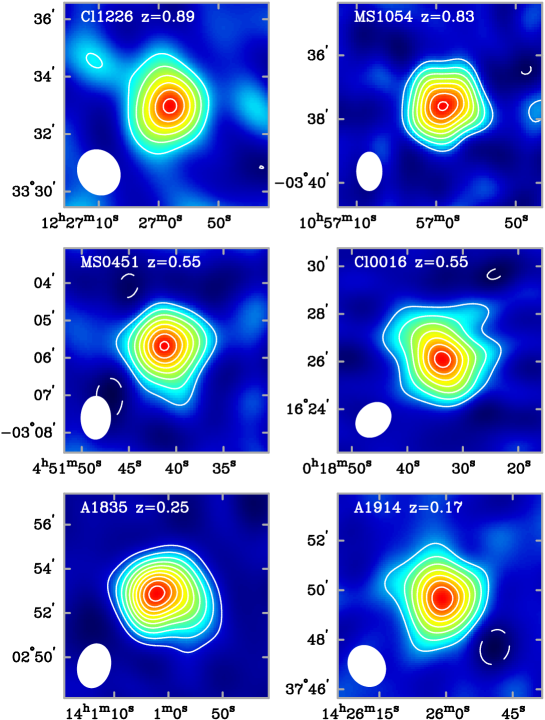
The OVRO and BIMA SZE imaging project uses 30 GHz (1 cm) low noise receivers mounted on the OVRO111An array of six 10.4 m telescopes located in the Owens Valley, CA and operated by Caltech and BIMA222An array of ten 6.1 m mm-wave telescopes located at Hat Creek, California and operated by the Berkeley-Illinois-Maryland-Association mm-wave arrays in California. They have produced SZE images toward 60 clusters to date (Carlstrom et al, 1996, 2000; Patel et al, 2000; Grego et al, 2000; Reese et al, 2000; Grego et al, 2001; Joy et al, 2001; LaRoque et al, 2002; Reese et al, 2002). A sample of their SZE images is shown in Figure 6. Figure 6 also clearly demonstrates the independence of the SZE on redshift. All of the clusters shown have similar high X-ray luminosities and, as can be seen, the strength of the SZE signals are similar despite the factor of five in redshift. The OVRO and BIMA arrays support two dimensional configuration of the telescopes, including extremely short baselines, allowing good synthesized beams for imaging the SZE of clusters at declinations greater than degrees.
The Ryle Telescope, OVRO, and BIMA SZE observations are insensitive to the angular scales required to image low redshift clusters, . Recently, however, the Cosmic Background Imager (CBI) (Padin et al, 2000) has been used to image the SZE in a few nearby clusters (Udomprasert et al, 2000). The CBI is composed of thirteen 0.9 m telescopes mounted on a common platform with baselines spanning 1 m to 6 m. Operating in ten 1 GHz channels spanning 26 - 36 GHz, it is sensitive to angular scales spanning 3′ to 20′. The large field of view of the CBI, 0.75 degrees FWHM, makes it susceptible to correlated contamination from terrestrial sources, i.e., ground emission. To compensate, they have adopted the same observing strategy as for single dish observations (§3.2), and subtract data from leading and trailings fields offset by 12.5 minutes in Right Ascension from the cluster.
Interferometric observations of the SZE, as for single dish observations, are just beginning to demonstrate their potential. Upcoming instruments will be over an order of magnitude more sensitive. The OVRO - BIMA SZE imaging team is now building the Sunyaev-Zel’dovich Array (SZA), consisting of eight 3.5 m telescopes outfitted with 26 - 36 GHz and 85 - 115 GHz low-noise receivers and employing an 8 GHz wideband correlator. The SZA is expected to be operational by the end of 2003. It will be deployed with the existing six 10.4 m OVRO telescopes and nine 6.1 BIMA telescopes at a new high site if the site is ready in time. If not, the array will be deployed in the Owens Valley with the existing OVRO telescopes. The SZA will operate both in a dedicated survey mode and also as a fully heterogeneous array with the larger telescopes. The heterogeneous array will provide unprecedented imaging of the SZE at high resolution.
The Ryle Telescope (RT) SZE team is also building the ArcMinute Imager (AMI), consisting of ten 3.7m telescopes operating at 15 GHz near the RT in Cambridge. It is not planned to operate AMI as a heterogeneous array with the Ryle telescope, but the RT would be used for concurrent point source monitoring.
Additionally, plans have been discussed to reconfigure the CBI to 90 GHz. With its thirteen 0.9 m telescopes and 10 GHz bandwidth, the CBI would be a formidable SZE survey machine. A similar fixed platform interferometer, the Array for Microwave Background Anisotropy (AMiBA), is also being built with nineteen 1.2 m telescopes and operating at 90 GHz. AMiBA, like the reconfigured CBI, would also be ideally suited for performing SZE surveys at moderate resolution.
This next generation of interferometric SZE instruments will conduct deep SZE surveys covering tens and possibly hundreds of square degrees. While not as fast as planned large format bolometric arrays, the interferometers will be able to provide more detailed imaging. In particular, the high resolution and deep imaging provided by the SZA/OVRO/BIMA heterogeneous array (referred to as CARMA, the Combined ARray for Millimeter Astronomy) operating at 90 GHz will provide a valuable tool for investigating cluster structure and its evolution. As discussed in §5.5, such studies are necessary before the full potential of large SZE surveys for cosmology can be realized.
4 SKY SURVEYS WITH THE SZE
With recent developments in instrumentation and observing strategies, it will soon be possible to image large areas with high sensitivity, enabling efficient and systematic SZE searches for galaxy clusters.
The primary motivation for large surveys for galaxy clusters using the SZE is to obtain a cluster catalog with a well understood selection function that is a very mild function of cosmology and redshift. There are two primary uses for such a catalog. The first is to use clusters as tracers of structure formation, allowing a detailed study of the growth of structure from or 3 to the present day. The second use is for providing a well-understood sample for studies of individual galaxy clusters, either as probes of cosmology or for studies of the physics of galaxy clusters.
Numerous authors have presented estimates of the expected yields from SZE surveys (Korolev et al, 1986; Bond & Myers, 1991; Bartlett & Silk, 1994; Markevitch et al, 1994; De Luca et al, 1995; Bond & Myers, 1996; Barbosa et al, 1996; Colafrancesco et al, 1997; Aghanim et al, 1997; Kitayama et al, 1998; Holder et al, 2000b ; Bartlett, 2000; Kneissl et al, 2001). Results from the diverse approaches to calculating the cluster yields are in broad agreement.
4.1 Cluster Abundance
The number of clusters expected to be found in SZE surveys depends sensitively on the assumed cosmology and detector specifications. Estimates of the order of magnitude, however, should be robust and able to give a good indication of the expected scientific yields of surveys for galaxy clusters using the SZE.
In calculating the number of clusters expected in a given survey,
three things are needed:
1) the volume per unit solid angle
as a function of redshift,
2) the number density of clusters
as a function of mass and redshift, and
3) an understanding of the
expected mass range which should be observable with the particular SZE
instrument and survey strategy.
The physical volume per unit redshift per unit solid angle is given by (Peebles, 1994)
| (7) |
where and is the expansion rate of the universe. The comoving volume is simply the physical volume multiplied by .
The number density of clusters as a function of mass and redshift can either be derived by applying the statistics of peaks in a Gaussian random field (Press & Schechter, 1974; Bond et al, 1991; Sheth et al, 2001) to the initial density perturbations or taken from large cosmological N-body simulations (Jenkins et al, 2001). The mass function is still not understood perfectly, with small but important differences between competing estimates, especially at the high mass end of the spectrum. Precise cosmological studies will require an improved understanding, but reasonably accurate results can be obtained with the “standard” Press-Schechter (Press & Schechter, 1974) mass function, with the comoving number density between masses and given by
| (8) |
In the above, is the mean background density of the universe today, is the variance of the density field when smoothed on a mass scale , and (typically ) is the critical overdensity for collapse in the spherical collapse model (Peebles, 1980).
Smoothing the density field on a mass scale corresponds to finding the comoving volume that encloses a given mass for a region at the mean density of the universe and smoothing the density field over this volume. The variance is separable as , where is the variance in the initial density field and is the linear growth function that indicates how the amplitude of the density field has grown with time. For a universe with this growth function is simply proportional to the scale factor.
For a universe composed only of matter and vacuum energy (either with or without spatial curvature), accurate fitting functions for the growth function can be found in Carroll et al, (1992) or can be found as a straightforward one-dimensional numerical integral, using the solution found by Heath, (1977). For a more exotic universe, for example one with dark energy not in the form of a cosmological constant, the growth function requires solution of a two dimensional ordinary differential equation.
The Press-Schechter formulation has the advantage of making it clear that the abundance of very massive objects is exponentially suppressed, showing that massive clusters are expected to be rare. The amount of suppression as a function of redshift is sensitive to the linear growth function , which is itself sensitive to cosmological parameters. Structure grows most efficiently when the universe has , so the growth function as a function of should give a good indication of the epoch when either curvature, vacuum energy or dark energy started to become dynamically important.


The exponential dependence of the cluster abundance makes SZE surveys a potentially powerful probe of cosmology. This is shown in Figure 7, where the relative importance of volume and number density can be seen. A difference in cosmology can cause a difference in volume of a few tens of percent, while the corresponding change in comoving number density is typically a factor of a few. This plot also shows the rapid decline in the number density of the cluster abundance with redshift and its steep dependence on mass, both of which are due to the exponential suppression of high peaks.
The cosmology with the higher mass density can be seen to have a higher abundance at in Figure 7 for a fixed normalization of the power spectrum, i.e., . This is primarily because a given cluster mass will correspond to a slightly smaller size for a universe with higher matter density. The matter power spectrum rises toward smaller scales, so a fixed amplitude of the power spectrum on a specific scale will lead to a higher density cosmology having more power on a given mass scale. Choosing a slightly lower value of for the cosmology with the higher density removes this offset in the cluster abundance at and leads to a lower cluster abundance at higher redshifts, i.e., if the cluster abundance is normalized at for all cosmological models, the higher density models will have relatively fewer clusters at high redshift. This can be seen in the right panel of Figure 7, where the redshift distribution per square degree has been normalized to give the same number of clusters above a mass of at by lowering the normalization of the power spectrum from to 0.75 for the cosmology with the higher matter density.
4.2 Mass Limits of Observability
The range of masses to which a survey is sensitive is set by the effective beam size and sensitivity of the instrument as well as the cluster profile on the sky. In the case of a beam that is larger than the cluster, a survey is limited by SZE flux. From equation 5, a flux limit corresponds to constant . The dependence on angular diameter distance rather than luminosity distance leads to a relative factor of when compared to a usual flux limit for emission from a distant source. Past the angular diameter distance is slowly varying, and the gas temperature for a fixed mass should be higher than at , since the clusters are more dense and therefore more tightly bound, i.e., smaller. As a result, at the limiting mass for an SZE survey is likely to be gently declining with redshift (Holder et al, 2000b ; Bartlett, 2000; Kneissl et al, 2001). Nearby clusters () are likely to be at least partially resolved by most SZE surveys, making the mass selection function slightly more difficult to estimate robustly. It is not expected that the mass threshold of detectability should change more than a factor of for clusters with , making an SZE selected catalog remarkably uniform in redshift in terms of its mass selection function.
The expected cluster profiles are not well known, since there are very few known clusters at , and these are much more massive than the typical clusters expected to be found in deep SZE surveys. The total SZE flux from a cluster should be fairly robust against changes in cluster profiles due to substructure or merging. Broadly speaking, the SZE is providing an inventory of hot electrons. The characteristic temperature in a cluster is set by virial considerations, since the electrons are mainly heated by shocks due to infall. Kinetic energy of infalling gas should be converted into thermal energy in a time shorter than the Hubble time, suggesting that the thermal energy per particle must necessarily be on the order of . Therefore, it is very difficult to substantially alter the expected SZE flux for a cluster of a given mass.

The mass limit of detection corresponding to an SZE flux limited survey is shown in the left panel of Figure 8. The two types of surveys shown correspond to deep ground-based imaging of a few tens of square degrees down to sensitivities with arcminute resolution or wide-field surveys (similar to the Planck Surveyor satellite) with resolution.
In contrast to the total integrated SZE flux, the concentration of SZE flux is very model dependent, with very compact clusters having high central decrements (or increments) but subtending a relatively small solid angle. The integrated SZE flux is thus a potentially very powerful criterion for controlling selection effects in samples for cluster studies. The clusters can first be found using integrated SZE flux and then investigated with high resolution SZE imaging.
4.3 Estimates of SZE Source Counts
The expected source counts are shown in the right panels of Figure 8. From the considerations discussed above, it should be clear that the exact numbers will depend on cosmology and observing strategy. A robust conclusion is that upcoming deep surveys should find tens of clusters per square degree. Less deep surveys, such as the all-sky Planck Surveyor satellite survey should detect a cluster in every few square degrees. The resulting catalogs should be nearly uniformly selected in mass, with the deep catalogs extending past .
5 COSMOLOGY FROM SZE SURVEY SAMPLES
In this section we review the use of the SZE for cosmological studies and provide an update on current constraints. Emphasis is given to the cosmology that can, in principle, be extracted from SZE survey yields, as well as the observational and theoretical challenges which must be met before the full potential of SZE surveys for cosmology can be realized.
Future SZE surveys, with selection functions that are essentially a uniform mass limit with redshift (§4), will provide ideal cluster samples for pursuing cosmology. A large catalog of distant clusters will enable studies of large scale structure using the same methods as are applied to large catalogs of galaxies. The SZE surveys will also provide a direct view of the high redshift universe. Should clusters exist at redshifts much higher than currently predicted, i.e., if the initial mass fluctuations were non-Gaussian, they will be found by SZE surveys, but missed in even the deepest X-ray observations planned.
The SZE survey samples can be used to increase the precision of the more traditional applications of the SZE to extract cosmological parameters, such as cluster distance measurements and the Hubble constant, the ratio /, and cluster peculiar velocities. These are discussed in §5.1, §5.2 and §5.3, respectively. The ability to derive these parameter depends primarily on the ability to use the SZE and other cluster observables to constrain or even overconstrain cluster properties. Precise SZE measurements will allow tests of the underlying assumptions in these derivations. For example, high resolution imaging of SZE, X-ray, and lensing, will allow detailed tests of the assumption of hydrostatic equilibrium (Miralda-Escude & Babul, 1995; Loeb & Mao, 1994; Wu & Fang, 1997; Squires & Kaiser, 1996; Allen & Fabian, 1998). The sample yields will also allow the determination of global properties of clusters and their relationship to observables. For example, it is already possible to estimate cluster gas temperatures without X-ray data using current SZE data (Joy et al, 2001).
The new frontier for SZE cosmology will be in exploiting the ability of future SZE surveys to measure cleanly the number density of clusters and its evolution in time. The redshift distribution of galaxy clusters is critically sensitive to and the properties of the dark energy. For sufficiently large and deep SZE surveys, it is possible, in principle, to extract the equation of state of the dark energy. This is discussed in §5.4 and the theoretical and observational challenges are outlined in §5.5.
5.1 Distance Determinations, Hubble Constant
Several years after the SZE was first proposed (Sunyaev & Zel’dovich, 1970, 1972) it was recognized that the distance to a cluster could be determined with a measure of its SZE and X-ray emission (Cavaliere et al, 1977; Gunn, 1978; Silk & White, 1978; Cavaliere & Fusco-Femiano, 1978; Birkinshaw, 1979). The distance is determined by exploiting the different density dependencies of the SZE and X-ray emission. The SZE is proportional to the first power of the density; , where is the electron density, is the electron temperature, and is along the line-of-sight. The distance dependence is made explicit with the substitution , where is the angular diameter distance of the cluster.
The X-ray emission is proportional to the second power of the density; , where is the X-ray cooling function. The angular diameter distance is solved for by eliminating the electron density333Similarly, one could eliminate in favor of the central density, yielding
| (9) |
where these quantities have been evaluated along the line of sight through the center of the cluster (subscript 0) and refers to a characteristic scale of the cluster along the line of sight, whose exact meaning depends on the density model adopted. Only the characteristic scale of the cluster in the plane of the sky is measured, so one must relate the line of sight and plane of sky characteristic scales. For detailed treatments of this calculation see Birkinshaw & Hughes, (1994) and Reese et al, (2000). Combined with the redshift of the cluster and the geometry of the universe, one may determine the Hubble parameter, with the inverse dependencies on the observables as that of . With a sample of galaxy clusters, one fits the cluster distances versus redshift to the theoretical angular diameter distance relation, with the Hubble constant as the normalization, e.g., see Figure 9.
There are two explicit assumptions made in SZE and X-ray distance determinations. The first one, mentioned above, is that the characteristic scale of the cluster along the line of sight must be related (usually assumed equal) to the scale in the plane of the sky. Typically, spherical symmetry is assumed for the cluster geometry since for a large sample of clusters one would expect , at least in the absence of selection effects. This assumption is supported by simulations as well (Sulkanen, 1999). The second assumption is that equals along the line of sight, i.e., that the clumping factor
| (10) |
equals unity. If significant substructure exists in galaxy clusters, the derived Hubble constant will be overestimated by a factor of .

To date, there are 38 distance determinations to 26 different galaxy clusters from analyses of SZE and X-ray observations. In Figure 9 we show all SZE determined distances from high signal-to-noise SZE experiments. The uncertainties shown are statistical at 68% confidence. There are currently three samples of clusters with SZE distances: 1) a sample of 7 nearby () galaxy clusters observed with the OVRO 5m telescope (Myers et al, 1997; Mason et al, 2001); 2) a sample of 5 intermediate redshift () clusters from the Ryle telescope interferometer (Jones et al, 2001); and 3) a sample of 18 clusters with from interferometric observations by the OVRO and BIMA SZE imaging project (Reese et al, 2002). A fit to the ensemble of 38 SZE determined distances yields km s-1 Mpc-1 for an , cosmology, where only the statistical uncertainty is included (at 68% confidence). The systematic uncertainty, discussed below, is of order 30% and clearly dominates. Since many of the clusters are at high redshift, the best fit Hubble constant will depend on the cosmology adopted; the best fit Hubble constant shifts to 56 km s-1 Mpc-1 for an open universe and to 54 km s-1 Mpc-1 for a flat geometry.
The prospects for improving both the statistical and systematic uncertainties in the SZE distances in the near future are promising. Note, from Eq. 9, that the error budget in the distance determination is sensitive to the absolute calibration of the X-ray and SZE observations. Currently, the best absolute calibration of SZE observations is % at 68% confidence based on observations of the brightness of the planets Mars and Jupiter. Efforts are now underway to reduce this uncertainty to the 1% level (2% in ). Uncertainty in the X-ray intensity scale also adds another shared systematic. The accuracy of the ROSAT X-ray intensity scale is debated, but a reasonable estimate is believed to be %. It is hoped that the calibration of the Chandra and XMM-Newton X-ray telescopes will greatly reduce this uncertainty.
The largest systematic uncertainties are due to departures from isothermality, the possibility of clumping, and possible point source contamination of the SZE observations (for detailed discussion of systematics see, e.g., Birkinshaw, 1999; Reese et al, 2000, 2002). Chandra and XMM-Newton are already providing temperature profiles of galaxy clusters (e.g., Nevalainen et al, 2000; Markevitch et al, 2000; Tamura et al, 2001). The unprecedented angular resolution of Chandra will provide insight into possible small scale structures in clusters. In addition, multi-wavelength studies by existing radio observatories, e.g., the Very Large Array (VLA), can shed light on the residual point source contamination of the radio wavelength SZE measurements. Therefore, though currently at the 30% level, many of the systematics can and will be addressed through both existing X-ray and radio observatories and larger samples of galaxy clusters provided from SZE surveys.
The beauty of the SZE and X-ray technique for measuring distances is that it is completely independent of other techniques, and that it can be used to measure distances at high redshifts directly. Since the method relies on the well understood physics of fully ionized plasmas, it should be largely independent of cluster evolution. Inspection of Figure 9 already provides confidence that a large survey of SZE distances consisting of perhaps a few hundred clusters with redshifts extending to one and beyond would allow the technique to be used to trace the expansion history of the universe, providing a valuable independent check of the recent determinations of the geometry of the universe from type Ia supernova (Riess et al, 1998; Perlmutter et al, 1999) and CMB primary anisotropy experiments (Pryke et al, 2002; Netterfield et al, 2002; Stompor et al, 2001).
5.2 Cluster gas mass fractions,
The ICM contains most of the baryons confined to the cluster potential with roughly an order of magnitude more baryonic mass than that observed in the galaxies themselves (White et al, 1993; Forman & Jones, 1982). The gas mass fraction, , is therefore a reasonable estimate of the baryonic mass fraction of the cluster. It should also be reasonable approximation to the universal baryon mass fraction, , since it is not believed that mass segregation occurs on the large scales from which massive clusters condense Mpc3. The cluster gas fraction is actually a lower limit, , since a small fraction of baryons (%) are likely lost during the cluster formation process (White et al, 1993; Evrard, 1997), and we can not rule out the possibility of additional reservoirs of baryons in galaxy clusters which have yet to be detected.
A measurement of leads directly to an estimate of given a determination of . Recent reanalysis of big bang nucleosynthesis predictions with careful uncertainty propagation (Burles et al, 2001; Nollett & Burles, 2000; Burles et al, 1999) along with recent D/H measurements in Lyman clouds (Burles & Tytler, 1998, 1998) constrain the baryon density to be at 95% confidence. Recent CMB primary anisotropy experiments provide an additional independent determination of consistent with the Lyman cloud result (Pryke et al, 2002; Netterfield et al, 2002; Stompor et al, 2001).
The gas mass is measured directly by observations of the SZE provided the electron temperature is known. The total gravitating mass can be determined by assuming hydrostatic equilibrium and using the distribution of the gas and, again, the electron temperature. The SZE derived gas fraction will therefore be proportional to . Alternatively, the total gravitating mass can be determined by strong lensing (on small scales) or weak lensing (on large scales). Recently there has been considerable work on SZE gas fractions using total mass determinations derived under the assumption of hydrostatic equilibrium.
SZE derived cluster gas mass fractions have been determined for two samples of clusters and the results were used to place constraints on : a sample of four nearby clusters (Myers et al, 1997) and a sample of 18 distant clusters (Grego et al, 2001). Both analyses used a spherical isothermal -model for the ICM. The nearby sample was observed with the Owens Valley 5.5 m telescope at 32 GHz as part of a SZE study of an X-ray flux limited sample (Myers et al, 1997). In this study, the integrated SZE was used to normalize a model for the gas density from published X-ray analyses, and then compared to the published total masses to determine the gas mass fraction. For three nearby clusters, A2142, A2256 and the Coma cluster, a gas mass fraction of at radii of 1-1.5 Mpc is found; for the cluster Abell 478, a gas mass fraction of is reported.
The high redshift sample of 18 clusters () was observed interferometrically at 30 GHz using the OVRO and BIMA SZE imaging system (Grego et al, 2001). In this study, the model for the gas density was determined directly by the SZE data. X-ray emission weighted electron temperatures were used, but no X-ray imaging data was used. The gas fractions were computed from the data at a 1′ radius where they are best constrained by the observations. Numerical simulations suggest, however, that the gas mass fraction at (the radius inside of which the mean density of the cluster is 500 times the critical density) should reflect the universal baryon fraction (Evrard, 1997; Evrard et al, 1996; David et al, 1995). The derived gas fractions were therefore extrapolated to using scaling relations from cluster simulations (Evrard, 1997). The resulting mean gas mass fractions are for , for and for . The uncertainties in the electron temperatures contribute the largest component to the error budget.
The angular diameter distance relation, , enters the gas fraction calculation and introduces a cosmology dependence on the results of the high sample. In addition, the simulation scaling relations used to extrapolate the gas fractions to have a mild dependence on cosmology. Figure 10 shows the constraints on implied by the measured gas mass fractions assuming a flat universe () and to calculate and the scaling factor. The upper limit to and its associated 68% confidence interval is shown as a function of . The measured gas mass fractions are consistent with a flat universe and when is less than 0.40, at 68% confidence. For the measurements to be consistent with in a flat universe, the Hubble constant must be very low, less than .
To estimate , we need to account for the baryons contained in the galaxies and those lost during cluster formation. The galaxy contribution is assumed to be a fixed fraction of the cluster gas, with the fraction fixed at the value observed in the Coma cluster, (White et al, 1993). Simulations suggest that the baryon fraction at will be a modest underestimate of the true baryon fraction (Evrard, 1997). These assumptions lead to . Using this to scale the gas fractions derived from the high SZE cluster sample and assuming and a flat cosmology, leads to the constraints illustrated in Figure 10 with a best estimate (Grego et al, 2001).
Cluster gas mass fractions can also be determined from cluster X-ray emission in a similar manner as from SZE measurements. However, there are important differences between X-ray and SZE determined gas fractions. For example, the X-ray emission is more susceptible to clumping of the gas, , since it is proportional to the ICM density squared. On the other hand, the X-ray derived gas mass is essentially independent of temperature for the ROSAT 0.1-2.4 keV band used in the analyses (Mohr et al, 1999), while the SZE derived gas mass is proportional to .
Currently X-ray data for low redshift clusters is of exceptional quality, far surpassing SZE data. X-ray based gas mass fractions have been measured to cluster radii of 1 Mpc or more (e.g., White & Fabian, 1995; David et al, 1995; Neumann & Bohringer, 1997; Squires et al, 1997; Mohr et al, 1999). A mean gas mass fraction within of at 90% confidence was derived from X-ray data from a large, homogeneous, nearby sample of clusters with keV (Mohr et al, 1999). The gas mass fractions derived from SZE measurements depend differently on the cosmology assumed than those derived from X-ray images, and this should be noted when comparing the results. Qualitatively, the comparison does not suggest any large systematic offsets. In fact, for a CDM cosmology, solving for from the combination of the Grego et al, (2001) and Mohr et al, (1999) results gives at 68% confidence. This is significant, because a large clumping factor, (see Eq. 10), has been suggested as an explanation for the high gas mass fractions in clusters (White et al, 1993; Evrard, 1997).

Cluster gas mass fractions can also be measured by comparing SZE derived gas masses and weak lensing derived total masses. The comparison is particularly interesting as both are measures of projected mass distributions. In addition, gas mass fractions can be derived without assuming a model for the cluster structure and without assuming hydrostatic equilibrium. Comparisons of SZE and lensing data has only been done for a few clusters to date (Holder et al, 2000a ). However, as for the SZE, the quality and quantity of weak lensing observations toward galaxy clusters is rapidly increasing and several weak lensing surveys are underway. Holder et al, 2000a demonstrated that gas mass fractions can be determined from the analysis of SZE and weak lensing measurements without need to parameterize the ICM distribution. Furthermore, by comparing this mass fraction with one derived by assuming hydrostatic equilibrium, it is possible to solve for the ICM electron temperature and the angular diameter distance.
SZE surveys will provide a large catalog of galaxy clusters at redshifts . The increased sensitivity and larger angular dynamic range of the next generation of SZE instruments will allow measurements of cluster gas fractions to directly, greatly increasing the precision of the gas mass fractions. Moreover, extending the gas fraction analyses to high redshift will enable studies of the evolution of cluster structure. It should, for example, be straight forward to test speculative theories of dark matter decay (Cen, 2001).
5.3 Cluster Peculiar Velocities
The kinetic SZE is a unique and potentially powerful cosmological tool as it provides the only known way to measure large scale velocity fields at high redshift (§2.2). To obtain an accurate measure of the peculiar velocity of a galaxy cluster, sensitive multifrequency SZE observations are required to separate the thermal and kinetic effects. From inspection of Figure 2, it is clear that measurements of the kinetic SZE are best done at frequencies near the null of the thermal effect at GHz. However, as discussed in §3.1, contamination by CMB temperature fluctuations as well as other sources make it difficult to determine accurately the peculiar velocity for a given cluster. There have been only a few recent attempts to measure the kinetic SZE.
The first interesting limits on the peculiar velocity of a galaxy cluster were reported in Holzapfel et al, (1997). They used the Sunyaev-Zel’dovich Infrared Experiment (SuZIE) to observe Abell 2163 () and Abell 1689 () at 140 GHz (2.1 mm), 218 GHz (1.4 mm) and 270 GHz (1.1 mm). These observations include and bracket the null in the thermal SZE spectrum. Using a model, with the shape parameters (, ) from X-ray data, they found km s-1 for Abell 2163 and km s-1 for Abell 1689, where the uncertainties are at 68% confidence and include both statistical and systematic uncertainties. These results are limited by the sensitivity of the SZE observations, which were limited by differential atmospheric emission. The SuZIE data for Abell 2163 were reanalyzed with the addition of higher frequency measurements which are sensitive to emission from Galactic dust in the direction of the cluster (Lamarre et al, 1998). More recently LaRoque et al, (2002) also reanalyzed all of the available data for Abell 2163, including a new measurement obtained with the OVRO and BIMA SZE imaging system at 30 GHz (1 cm). As shown in Figure 4, the data is well fitted by parameters similar to the original values from Holzapfel et al, (1997). The agreement between the measurements using different instruments and techniques is striking.
The intrinsic weakness of the kinetic SZE and the degeneracy of its spectrum with that of primary CMB fluctuations make it exceeding difficult to use it to measure the peculiar velocity of a single cluster. It may be possible, however, to determine mean peculiar velocities on extremely large scales by averaging over many clusters.
5.4 Energy Densities in the Universe and Growth of Structure
The evolution of the abundance of galaxy clusters is a sensitive probe of cosmology (§4). Measurements of the clusters masses and number density as a function of redshift can be used to constrain the matter density, , and, for sufficiently large samples, the equation of state of the dark energy. X-ray surveys have already been used to constrain (e.g., Borgani et al, 2001; Viana & Liddle, 1999; Bahcall & Fan, 1998; Oukbir et al, 1997), but they have been limited by sample size and their reduced sensitivity to high redshift clusters. SZE surveys offer the attractive feature of probing the cluster abundance at high redshift as easily as the local universe; as discussed in §4.2, the sensitivity of a SZE survey is essentially a mass limit (Bartlett & Silk, 1994; Barbosa et al, 1996; Holder et al, 2000b ; Bartlett, 2000; Kneissl et al, 2001).
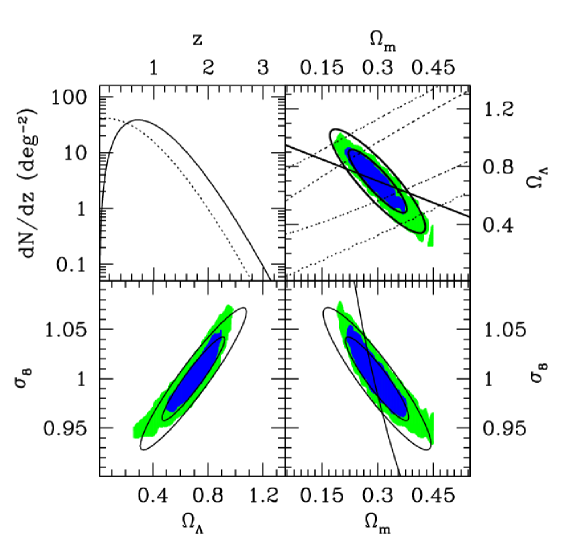
The simple mass selection function of SZE surveys could allow the source count redshift distribution to be used as a powerful measure of cosmological parameters (Barbosa et al, 1996; Haiman et al, 2001; Holder et al, 2001; Weller et al, 2001; Benson et al, 2001) and the structure formation paradigm in general. As an example, we show in Figure 11 the expected constraints in –– parameter space from the analysis of a deep SZE survey (Carlstrom et al, 2000; Holder et al, 2000b ; Holder et al, 2001) covering 12 square degrees in which all clusters above M⊙ are detected and for which redshifts have been obtained. The darkest region corresponds to the 68% confidence region, red to 95%. The shaded regions show the result of a Monte Carlo method for estimating confidence regions. Many realizations of a fiducial model (=0.3, =0.7, =1) were generated and fit in the three-dimensional parameter space, and the shaded regions indicate regions which contain 68% and 95% of the resulting best fits. The contours show confidence regions from a Fisher matrix analysis, where the confidence regions are assumed to be Gaussian ellipsoids in the parameter space. In each case, the dimension not shown has been marginalized over, rather than kept fixed.

The next generation of dedicated telescopes equipped with large format bolometer detector arrays offers the possibility of conducting SZE surveys over thousands of square degrees with sensitivity. As shown in Figure 12, the yields from such a survey should, in principle (see §5.5), enable highly accurate estimation of cosmological parameters, notably of the matter density and the properties of the dark energy. Most importantly, the degeneracies in the constraints of the cosmological parameters derived from SZE survey yields are very different from those expected from distance measures or CMB measurements. This simply arises because clusters are probing a fundamentally different physical effect, the growth rate of structure, rather than distance. Both growth and distance are related to the expansion history of the universe, but the two measures are effectively sensitive to different moments of the expansion rate.
A generic prediction of inflation is that the primordial fluctuations should be Gaussian. With cluster surveys probing the highest peaks of the density field, non-Gaussianity in the form of an excess of high peaks should be readily apparent, especially at high redshift (Benson et al, 2001). Cluster surveys are therefore probing both the structure formation history of the universe and the nature of the primordial fluctuations. In this way, cluster surveys are emerging as the next serious test of the cold dark matter paradigm.
5.5 Challenges for Interpreting SZE Surveys
In order to realize the full potential of the evolution of the cluster number density as a cosmological probe, a strong understanding of the physics of galaxy clusters will be required. As fully collapsed objects, the complete physics of galaxy clusters is highly non-linear and complex. The size of such massive objects, however, makes them insensitive to disruption from most physical mechanisms. Nevertheless, there are several important aspects of gas dynamics that could affect interpretation of SZE galaxy cluster surveys.
The SZE is only sensitive to free electrons; any process that removes electrons from the optically thin ICM can affect the magnitude of the SZE for a given total mass. For example, cooling of the ICM, star formation or heating of the ICM from supernovae can affect the observed SZE (Holder & Carlstrom, 1999; Springel et al, 2001; Holder & Carlstrom, 2001; Benson et al, 2001). If the cooling or star formation is not dependent on cluster mass or redshift, this can be simply calibrated and accounted for in deriving the survey selection function. The most promising theoretical path for understanding such processes is through high resolution cosmological simulations that include the relevant gas dynamics; such simulations are only now becoming feasible. The possible effects of such gas dynamics are shown in Figure 13 (Holder & Carlstrom, 2001). A simple model has been adopted for this figure, where some combination of heating or cooling has reduced the number of hot electrons in the central regions of galaxy clusters by an amount that is modeled through the effects of an “entropy floor” (Ponman et al, 1999). The curves in this figure show the extreme cases of either no heating or cooling (no entropy floor) or extreme gas evolution, with an assumed value for the minimum entropy that is roughly a factor of two larger than is required for consistency with the observations (Ponman et al, 1999). Changing the evolution of the ICM could mimic changes in cosmological parameters at levels much larger than the expected statistical errors. With detailed imaging of the ICM using SZE and X-ray telescopes, the effects of heating or cooling should be apparent, so the possible systematic errors due to heating or cooling should in practice be much smaller than in .

Although the SZE-mass relation is easy to understand theoretically in general terms, the details of the normalization and redshift evolution will require additional studies of at least a moderately sized SZE cluster catalog. For example, simple scaling arguments can be used to estimate the expected relation between cluster mass and temperature, but the exact cosmological dependence could be sensitive to merger rates as a function of cosmology or other non-linear effects.
Furthermore, the mapping between the initial density field and the number density of clusters of a given mass as a function of redshift, i.e., the mass function, is not known perfectly at this time. The current generation of large cosmological simulations offers hope for a much better understanding in coming years. An important use for a large scale SZE cluster survey will be to characterize this mass function and test the reliability of various analytical (Press & Schechter, 1974; Bond et al, 1991; Sheth et al, 2001) and numerical (Jenkins et al, 2001) estimates.
In order to exploit fully the potential of SZE surveys, the limiting mass as a function of redshift for galaxy clusters will have to be understood to an accuracy of better than 5% and uncertainties in the mass function must be reduced to better than 10% (Holder et al, 2001). The former will require a concerted observational effort and is likely to be the most difficult to achieve; the latter requirement is not far from current uncertainties (Jenkins et al, 2001). Note that it is not required that we know the mass of each cluster in the catalog to this accuracy, but only that we can characterize the cluster detection efficiency as a function of mass to this level.
While some of the theory of the physics of galaxy clusters is not known, there are plenty of observational diagnostics which can be used in the interpretation of SZE surveys. High resolution SZE imaging of high redshift clusters will provide information on the relative importance of gas dynamics (Holder & Carlstrom, 2001) to the observed properties of galaxy clusters. The main effect of most gas processes should be to cause the gas to be less centrally concentrated, either because the low-entropy gas has been removed (Bryan, 2000) or because the gas has gained entropy from non-gravitational heating.
It may also be possible with the next generation of large format multi-frequency bolometer arrays to exploit the small relativistic corrections to the SZE spectrum to determine the gas temperature. Such measurements will allow an understanding of temperature structure in the gas, even without follow-up X-ray observations. A direct SZE-weighted temperature would be more directly relevant to the SZE observations in determining the gas mass, and comparisons with X-ray spectral temperatures, when possible, could provide valuable information on the temperature structure along the line of sight. Temperature information, combined with high-resolution imaging, allows a reconstruction of the cluster potential and therefore can provide important constraints on the gas mass fraction as a function of radius as well as a diagnostic for the effects of gas cooling.
In terms of the properties of the cluster catalog produced by a SZE survey, it is difficult to avoid the conclusion that the survey limit will be mainly dependent only on cluster mass and that this mass limit will be relatively flat with redshift beyond . This will make the resulting catalog especially useful for studies of the physics of galaxy clusters. The requirements on understanding the cluster mass selection function for such studies are much less strict than those required for cosmological studies. The results from detailed studies of individual clusters in the catalog will naturally feed back and improve our understanding of the survey selection function.
6 SUMMARY
The SZE is emerging as a powerful tool for cosmology. Over the last several years, detection of the SZE toward massive galaxy clusters has become routine, as has high quality imaging at moderate angular resolution of order an arcminute. Measurements of the effect already have been used to place interesting constraints on the Hubble constant and, through measurements of cluster gas mass fractions, the matter density of the universe, .
The next step is to exploit the redshift independence of the SZE signal to conduct blind surveys for galaxy clusters. The limit for such a survey is essentially a mass limit that is remarkably uniform with redshift. The cluster catalog from such a unbiased survey could be used to greatly increase the precision and redshift range of present SZE constraints on the Hubble constant and , and could, for example, allow to be determined to high redshift ().
The most powerful use of the SZE for cosmology will be the measurement of the evolution of the abundance of galaxy clusters. SZE surveys are ideally suited for this since they are able to probe the abundance at high redshift as easily as the local universe. The evolution of the abundance of galaxy clusters is a sensitive probe of cosmology. For example, the yields from a deep SZE survey covering only ten square degrees would be able to place interesting constraints on , , and .
A generic prediction of inflation is that the primordial density fluctuations should be Gaussian. Non-Gaussianity in the form of an excess of high mass clusters should be readily apparent, especially at high redshift, from SZE survey yields. SZE cluster surveys will therefore probe both the structure formation history of the universe and the nature of the primordial fluctuations. In this way, cluster surveys are emerging as the next serious test of the cold dark matter paradigm.
Current SZE observations, while routine, require substantial integration time to secure a detection; a prohibitively long time would be required to conduct blind surveys over a large region of sky with the instruments now available. However, the next generation of instruments now being built or planned will be substantially faster. Dedicated interferometric arrays being built will be able to conduct deep SZE surveys over tens of square degrees. Heterogeneous arrays, such as the SZA combined with the OVRO array, will also allow detailed high resolution follow up SZE observations of the resulting cluster catalog.
A dedicated, low noise, single dish telescope with resolution, equipped with a next generation, large format bolometric array receiver ( elements) and operating from a superb site would be able to conduct a deep SZE survey over thousands of square degrees. The statistics provided by the yields from such a large survey ( clusters) in the absence of systematic effects and assuming redshifts are known would be sufficient to determine precise constraints on , , , and even set meaningful constraints on the equation of state of the dark energy.
The possible systematics that could affect the yields of SZE surveys are presently too large to realize the full potential of a deep SZE survey covering thousands of square degrees. The systematics include, for example, the uncertainties on the survey mass detection limit due to unknown cluster structure and cluster gas evolution, as well as the uncertainties in the theoretical mapping between the initial density field and the number density of clusters of a given mass as a function of redshift, i.e., the mass function.
These systematics can begin to be addressed through detailed follow-up observations of a moderate area SZE survey (tens of square degrees). High resolution SZE, X-ray, and weak lensing observations will provide insights into evolution and structure of the cluster gas. Numerical simulations directly compared and normalized to the SZE yields should provide the necessary improvement in our understanding of the mass function.
It is not unreasonable to consider the possibility of a space-based telescope operating at centimeter through submillimeter wavelengths with high angular resolution ( arcminute) and good spectral coverage. For studies of the SZE, this would allow simultaneous determinations of electron column densities, temperatures, and peculiar velocities of galaxy clusters. Such a satellite would make detailed images of the cosmic microwave background, while also providing important information on the high frequency behavior of radio point sources and the low frequency behavior of dusty extragalactic submillimeter sources. The upcoming Planck Surveyor satellite is a first step in this direction; it should provide an SZE all-sky survey although at moderate, arcminute, resolution. Such a survey should find on the order of clusters, most of them at redshift .
We can look forward to the SZE emerging further as a unique and powerful tool in cosmology over the next several years as the next generation of SZE instruments come online and SZE surveys become a reality.
ACKNOWLEDGEMENTS
We thank M. Joy and W. Holzapfel for their considerable input to this review and W. Hu, S. LaRoque, A. Miller, J. Mohr, and D. Nagai for their comments on the manuscript. We also thank M. White and C. Pryke for assistance with Figure 3. This work was supported in part by NASA LTSA account NAG5-7986 and NSF account AST-0096913. JEC also acknowledges support from the David and Lucile Packard Foundation and the McDonnell Foundation. EDR acknowledges support from a NASA GSRP fellowship (NGT5-50173) and a Chandra Fellowship (PF1-20020).
Literature Cited
- (1)
- Aghanim et al, (1997) Aghanim N, De Luca A, Bouchet FR, Gispert R, Puget JL. 1997. A&A 325:9–18
- Allen & Fabian, (1998) Allen SW, Fabian AC. 1998. MNRAS 297:L57–L62
- Andreani et al, (1999) Andreani P, Böhringer H, Dall’Oglio G, Martinis L, Shaver P, et al. 1999. ApJ 513:23–33
- Andreani et al, (1996) Andreani P, Pizzo L, dall’Oglio G, Whyborn N, Boehringer H, et al. 1996. ApJ 459:L49–L52
- Bahcall & Fan, (1998) Bahcall N, Fan X. 1998. ApJ 504:1–6
- Barbosa et al, (1996) Barbosa D, Bartlett J, Blanchard A, Oukbir J. 1996. A&A 314:13–17
- Bartlett, (2000) Bartlett JG. 2000. A&A submitted: astro-ph/0001267
- Bartlett & Silk, (1994) Bartlett JG, Silk J. 1994. ApJ 423:12–18
- Benson et al, (2001) Benson AJ, Reichardt C, Kamionkowski M. 2001. MNRAS submitted:astro–ph/0110299
- Birkinshaw, (1979) Birkinshaw M. 1979. MNRAS 187:847–62
- Birkinshaw, (1991) Birkinshaw M. 1991. in Physical Cosmology, eds. A. Blanchard, L. Celnikier, M. Lachi‘eze-Rey, J. Tran Thanh Van, Editions Frontieres, Gif sur Yvette, France, p. 177
- Birkinshaw et al, (1991) Birkinshaw M, Hughes, JP, Arnauld KA. 1991. ApJ, 379:466-481
- Birkinshaw, (1999) Birkinshaw M. 1999. Physics Reports 310:97–195
- (15) Birkinshaw M, Gull SF, Northover KJE. 1978a. Nature 275:40–41
- (16) Birkinshaw M, Gull SF, Northover KJE. 1978b. MNRAS 185:245–62
- Birkinshaw & Hughes, (1994) Birkinshaw M, Hughes JP. 1994. ApJ 420:33–43
- Blain, (1998) Blain AW. 1998. MNRAS 297:502–10
- Bond et al, (1991) Bond J, Kaiser N, Cole S, Efstathiou G. 1991. ApJ 379:440–60
- Bond & Myers, (1991) Bond JR, Myers ST. 1991. in K Sato, ed., ASSL Vol. 169: Primordial Nucleosynthesis and Evolution of Early Universe p. 305–23
- Bond & Myers, (1996) Bond JR, Myers ST. 1996. ApJS 103:63–79
- Borgani et al, (2001) Borgani S, Rosati P, Tozzi P, Stanford SA, Eisenhardt PR, et al. 2001. ApJ 561:13–21
- Bryan, (2000) Bryan GL. 2000. ApJ 544:L1–5
- Burles et al, (1999) Burles S, Nollett K, Truran J, Turner M. 1999. Phys. Rev. Lett. 82:4176–79
- Burles et al, (2001) Burles S, Nollett K, Turner MS. 2001. ApJ 552:L1–5
- Burles & Tytler, (1998) Burles S, Tytler D. 1998. ApJ 499:699–712
- Burles & Tytler, (1998) Burles S, Tytler D. 1998. ApJ 507:732–44
- Carlstrom et al, (2000) Carlstrom JE, Joy M, Grego L, Holder G, Holzapfel WL, et al. 2000. in F Durret, G Gerbal, eds., Constructing the Universe with Clusters of Galaxies IAP pp. E43
- Carlstrom et al, (1996) Carlstrom JE, Joy M, Grego LE. 1996. ApJ 456:L75–78
- Carlstrom et al, (2000) Carlstrom JE, Joy MK, Grego L, Holder GP, Holzapfel WL, et al. 2000. Physica Scripta Volume T 85:148–55
- Carroll et al, (1992) Carroll S, Press W, Turner E. 1992. ARA&A 30:499–542
- Cavaliere et al, (1977) Cavaliere A, Danese L, de Zotti G. 1977. ApJ 217:6–15
- Cavaliere & Fusco-Femiano, (1978) Cavaliere A, Fusco-Femiano R. 1978. A&A 70:677–84
- Cen, (2001) Cen R. 2001. ApJ 546:L77–80
- Challinor & Lasenby, (1998) Challinor A, Lasenby A. 1998. ApJ 499:1–6
- Challinor & Lasenby, (1999) Challinor A, Lasenby A. 1999. ApJ 510:930–33
- Church et al, (1997) Church SE, Ganga KM, Ade PAR, Holzapfel WH, Mauskopf PD, et al. 1997. ApJ 484:523–37
- Colafrancesco et al, (1997) Colafrancesco S, Mazzotta P, Rephaeli Y, Vittorio N. 1997. ApJ 479:1–16
- Cooray et al, (1998) Cooray AR, Grego L, Holzapfel WL, Joy M, Carlstrom JE. 1998. AJ 115:1388-99
- David et al, (1995) David L, Jones C, Forman W. 1995. ApJ 445:578–90
- Dawson et al, (2001) Dawson KS, Holzapfel WL, Carlstrom JE, Joy M, LaRoque SJ, et al. 2001. ApJ 533:L1–4.
- de Bernardis et al, (2000) de Bernardis P, Ade PAR, Bock JJ, Bond JR, Borrill J, et al. 2000. Nature 404:955–59
- De Luca et al, (1995) De Luca A, Desert FX, Puget JL. 1995. A&A 300:335–45
- Desert et al, (1998) Desert F, Benoit A, Gaertner S, Bernard J, Coron N, et al. 1998. New Astronomy 3:655–69
- Dolgov et al, (2001) Dolgov AD, Hansen SH, Pastor S, Semikoz DV. 2001. ApJ 554:74–84
- Evrard, (1997) Evrard A. 1997. MNRAS 292:289–97
- Evrard et al, (1996) Evrard AE, Metzler CA, Navarro JF. 1996. ApJ 469:494–507
- Fabbri, (1981) Fabbri R. 1981. Ap&SS 77:529–37
- Fischer & Lange, (1993) Fischer ML, Lange AE. 1993. ApJ 419:433–39
- Forman & Jones, (1982) Forman W, Jones C. 1982. ARA&A 20:547–85
- Glenn et al, (1998) Glenn J, Bock JJ, Chattopadhyay G, Edgington SF, Lange AE, et al. 1998. Proc. SPIE 3357:326–34
- Grainge et al, (2001) Grainge K, Grainger WF, Jones ME, Kneissl R, Pooley G, et al. 2001. MNRAS 329:890–896
- Grainge et al, (1996) Grainge K, Jones M, Pooley G, Saunders R, Baker J, et al. 1996. MNRAS 278:L17–22
- Grainge et al, (1993) Grainge K, Jones M, Pooley G, Saunders R, Edge A. 1993. MNRAS 265:L57–58
- Grainge et al, (2000) Grainge K, Jones ME, Pooley G, Saunders R, Edge A, et al. 2000. MNRAS submitted:astro–ph/9904165
- Grainger et al, (2001) Grainger WF, Das R, Grainge K, Jones ME, Kneissl R, et al. 2001. MNRAS submitted: astro-ph/0102489
- Grego et al, (2000) Grego L, Carlstrom JE, Joy MK, Reese ED, Holder GP, et al. 2000. ApJ 539:39–51
- Grego et al, (2001) Grego L, Carlstrom JE, Reese ED, Holder GP, Holzapfel WL, et al. 2001. ApJ 552:2–14
- Gunn, (1978) Gunn JE. 1978. in Observational Cosmology Advanced Course p. 1
- Haiman et al, (2001) Haiman Z, Mohr JJ, Holder GP. 2001. ApJ 553:545–61
- Hanany et al, (2000) Hanany S, Ade P, Balbi A, Bock J, Borrill J, et al. 2000. ApJ 545:L5–9
- Heath, (1977) Heath DJ. 1977. MNRAS 179:351–58
- Herbig et al, (1995) Herbig T, Lawrence CR, Readhead ACS, Gulkis S. 1995. ApJ 449:L5–8
- Holder & Carlstrom, (1999) Holder G, Carlstrom J. 1999. in A de Oliveira-Costa, M Tegmark, eds., Microwave Foregrounds San Francisco: ASP– pp. 199–216 astro-ph/9904220
- Holder et al, (2001) Holder G, Haiman Z, Mohr JJ. 2001. ApJ 560:L111–14
- Holder & Carlstrom, (2001) Holder GP, Carlstrom JE. 2001. ApJ 558:515–19
- (67) Holder GP, Carlstrom JE, Evrard AE. 2000. in F Durret, G Gerbal, eds., Constructing the Universe with Clusters of Galaxies IAP pp. E45
- (68) Holder GP, Mohr JJ, Carlstrom JE, Evrard EA, Leitch EM. 2000. ApJ 544:629–35
- Holzapfel et al, (1997) Holzapfel WL, Ade PAR, Church SE, Mauskopf PD, Rephaeli Y, et al. 1997. ApJ 481:35–48
- Holzapfel et al, (1997) Holzapfel WL, Wilbanks TM, Ade P, Church SE, Fischer M, et al. 1997. ApJ 479:17–30
- Hu & White, (1997) Hu W, White M. 1997. ApJ 479:568–79
- Hughes & Birkinshaw, (1998) Hughes JP, Birkinshaw M. 1998. ApJ 501:1–14
- Itoh et al, (1998) Itoh N, Kohyama Y, Nozawa S. 1998. ApJ 502:7–15
- Jenkins et al, (2001) Jenkins A, Frenk CS, White SDM, Colberg JM, Cole S, et al. 2001. MNRAS 321:372–84
- Jones et al, (1993) Jones M, Saunders R, Alexander P, Birkinshaw M, Dilon N, et al. 1993. Nature 365:320–23
- Jones et al, (2001) Jones ME, Edge AC, Grainge K, Grainger WF, Kneissl R, et al. 2001. MNRAS submitted:astro–ph/0103046
- Joy et al, (2001) Joy M, Laroque S, Grego L, Carlstrom JE, Dawson K, et al. 2001. ApJ 551:L1–L4
- Kamionkowski & Loeb, (1997) Kamionkowski M, Loeb A. 1997. Phys. Rev. D 56:4511–13
- Kitayama et al, (1998) Kitayama T, Sasaki S, Suto Y. 1998. PASJ 50:1–11
- Kneissl et al, (2001) Kneissl R, Jones ME, Saunders R, Eke VR, Lasenby AN, et al. 2001. MNRAS 328:783-94
- Komatsu et al, (1999) Komatsu E, Kitayama T, Suto Y, Hattori M, Kawabe R, et al. 1999. ApJ 516:L1–4
- Komatsu et al, (2001) Komatsu E, Matsuo H, Kitayama T, Hattori M, Kawabe R, et al. 2001. PASJ 53:57–62
- Korolev et al, (1986) Korolev VA, Syunyaev RA, Yakubtsev LA. 1986. Soviet Astronomy Letters 12:141–147
- Lamarre et al, (1998) Lamarre JM, Giard M, Pointecouteau E, Bernard JP, Serra G, et al. 1998. ApJ 507:L5–8
- LaRoque et al, (2002) LaRoque SJ, Carlstrom JE, Reese ED, Holder, GP, Holzapfel WL, et al. 2001. ApJ. Submitted. astro-ph/0204134
- Loeb & Mao, (1994) Loeb A, Mao S. 1994. ApJ 435:L109-12
- Loeb & Refregier, (1997) Loeb A, Refregier A. 1997. ApJ 476:L59–62
- Markevitch et al, (1994) Markevitch M, Blumenthal GR, Forman W, Jones C, Sunyaev RA. 1994. ApJ 426:1–13
- Markevitch et al, (2000) Markevitch M, Ponman TJ, Nulsen PEJ, Bautz MW, Burke DJ, et al. 2000. ApJ 541:542–49
- Mason, (1999) Mason BS. 1999. An Improved Measurment of the Hubble Constant Using the Sunyaev-Zel’dovich Effect Ph.D. thesis University of Pennsylvania
- Mason et al, (2001) Mason BS, Myers ST, Readhead ACS. 2001. ApJ 555:L11-L15
- (92) Mauskopf PD, Ade PAR, Allen SW, Church SE, Edge AC, et al. 2000a. ApJ 538:505
- (93) Mauskopf PD, Rownd BK, Edgington SF, Hristov VV, Mainzer AK, et al. 2000b. in Imaging at Radio through Submillimeter Wavelengths. Edited by Jeff Mangum. Publisher: The Astronomical Society of the Pacific, Conference Series, San Francisco p. E46
- Miller et al, (1999) Miller AD, Caldwell R, Devlin MJ, Dorwart WB, Herbig T, et al. 1999. ApJ 524:L1–4
- Miralda-Escude & Babul, (1995) Miralda-Escude J, Babul A. 1995. ApJ 449:18–27
- Mohr et al, (1999) Mohr J, Mathiesen B, Evrard A. 1999. ApJ 517:627–49
- Molnar & Birkinshaw, (1999) Molnar SM, Birkinshaw M. 1999. ApJ 523:78–86
- Mushotzky & Scharf, (1997) Mushotzky RF, Scharf CA. 1997. ApJ 482:L13–L16
- Myers et al, (1997) Myers ST, Baker JE, Readhead ACS, Leitch EM, Herbig T. 1997. ApJ 485:1–21
- Netterfield et al, (2002) Netterfield CB, Ade PAR, Bock JJ, Bond JR, Borrill J, et al. 2002. ApJ submitted:astro–ph/0104460
- Neumann & Bohringer, (1997) Neumann DM, Bohringer H. 1997. MNRAS 289:123–35
- Nevalainen et al, (2000) Nevalainen J, Markevitch M, Forman W. 2000. ApJ 536:73–78
- Nollett & Burles, (2000) Nollett KM, Burles S. 2000. Phys. Rev. D 61:123505
- (104) Nozawa S, Itoh N, Kohyama Y. 1998a. ApJ 508:17–24
- (105) Nozawa S, Itoh N, Kohyama Y. 1998b. ApJ 507:530–57
- Oukbir et al, (1997) Oukbir J, Bartlett JG, Blanchard A. 1997. A&A 320:365–77
- Padin et al, (2000) Padin S, Cartwright JK, Mason BS, Pearson, TJ, Readhead ACS, et al. 2000. ApJ 549:L1-L5
- Patel et al, (2000) Patel SK, Joy M, Carlstrom JE, Holder GP, Reese ED, et al. 2000. ApJ 541:37–48
- Peebles, (1980) Peebles P. 1980. The Large Scale Structure of the Universe Princeton, NJ: Princeton University Press
- Peebles, (1994) Peebles P. 1994. Physical Cosmology Princeton, NJ: Princeton University Press
- Perlmutter et al, (1999) Perlmutter S, Aldering G, Goldhaber G, Knop R, Nugent P, et al. 1999. ApJ 517:565–86
- Phillips, (1995) Phillips PR. 1995. ApJ 455:419–20
- Pointecouteau et al, (1999) Pointecouteau E, Giard M, Benoit A, Désert FX, Aghanim N, et al. 1999. ApJ 519:L115–18
- Pointecouteau et al, (2001) Pointecouteau E, Giard M, Benoit A, Désert FX, Bernard JP, Coron N, Lamarre JM. 2001. ApJ 552:42–48
- Ponman et al, (1999) Ponman TJ, Cannon DB, Navarro, JF. 1999. Nature 397:135–137
- Pospieszalski et al, (1995) Pospieszalski MW, Lakatosh WJ, Nguyen LD, Lui M, Liu T, et al. 1995. IEEE MTT-S Int. Microwave Symp., 1121-1124
- Press & Schechter, (1974) Press W, Schechter P. 1974. ApJ 187:425–38
- Pryke et al, (2002) Pryke C, Halverson NW, Leitch EM, Kovac J, Carlstrom JE, et al. 2002. ApJ 568. astro-ph/0104490
- Reese et al, (2002) Reese ED, Carlstrom JE, Joy M, Mohr JJ, Grego L, et al. 2002. ApJ. In press. astro-ph/020535
- Reese et al, (2000) Reese ED, Mohr JJ, Carlstrom JE, Joy M, Grego L, et al. 2000. ApJ 533:38–49
- Rephaeli, (1995) Rephaeli Y. 1995. ARA&A 33:541–80
- Rephaeli & Yankovitch, (1997) Rephaeli Y, Yankovitch D. 1997. ApJ 481:L55–L58
- Riess et al, (1998) Riess AG, Filippenko AV, Challis P, Clocchiattia A, Diercks A, et al. 1998. AJ 116:1009–38
- Saunders et al, (2000) Saunders R, Kneissl R, Grainge K, Jones ME, Maggi A, et al. 2000. MNRAS submitted:astro–ph/9904168
- (125) Sazonov SY, Sunyaev RA. 1998a. ApJ 508:1–5
- (126) Sazonov SY, Sunyaev RA. 1998b. Astronomy Letters 24:553–67
- Sazonov & Sunyaev, (1999) Sazonov SY, Sunyaev RA. 1999. MNRAS 310:765–72
- Sheth et al, (2001) Sheth RK, Mo HJ, Tormen G. 2001. MNRAS 323:1–12
- Silk & White, (1978) Silk J, White SDM. 1978. ApJ 226:L103–6
- Smail et al, (1997) Smail I, Ivison RJ, Blain AW. 1997. ApJ 490:L5–8
- Springel et al, (2001) Springel V, White M, Hernquist L. 2001. ApJ 549:681–87
- Squires & Kaiser, (1996) Squires G, Kaiser N. 1996. ApJ 473:65–80
- Squires et al, (1997) Squires G, Neumann DM, Kaiser N, Arnaud M, Babul A, et al. 1997. ApJ 482:648–58
- Stebbins, (1997) Stebbins A. 1997. preprint . astro-ph/9709065
- Stompor et al, (2001) Stompor R, Abrob M, Ade P, Balbi A, Barbosa D, et al. 2001. ApJ 561:L7–10
- Subrahmanyan et al, (2000) Subrahmanyan R, Kesteven MJ, Ekers RD, Sinclair M, Silk J. 2000. MNRAS 315:808–22
- Sulkanen, (1999) Sulkanen ME. 1999. ApJ 522:59–65
- Sunyaev & Zel’dovich, (1970) Sunyaev RA, Zel’dovich YB. 1970. Comments Astrophys. Space Phys. 2:66–74
- Sunyaev & Zel’dovich, (1972) Sunyaev RA, Zel’dovich YB. 1972. Comments Astrophys. Space Phys. 4:173–78
- (140) Sunyaev RA, Zel’dovich YB. 1980a. ARA&A 18:537–60
- (141) Sunyaev RA, Zel’dovich YB. 1980b. MNRAS 190:413–20
- Tamura et al, (2001) Tamura T, Kaastra JS, Peterson JR, Paerels FBS, Mittaz JPD, et al. 2001. A&A 365:L87-92
- Thompson et al, (2001) Thompson AR, Moran JM, Swenson GW. 2001. Interferometry and Synthesis in Radio Astronomy New York, NY: Wiley-Interscience
- Tsuboi et al, (1998) Tsuboi M, Miyazaki A, Kasuga T, Matsuo H, Kuno N. 1998. Proc. Astron. Soc. Japan 50:169–73
- Tucker et al, (1998) Tucker W, Blanco P, Rappoport S, David L, Fabricant D, et al. 1998. ApJ 496:L5–8
- Udomprasert et al, (2000) Udomprasert PS, Mason BS, Readhead ACS. 2000. in F Durret, G Gerbal, eds., Constructing the Universe with Clusters of Galaxies IAP pp. E48
- Viana & Liddle, (1999) Viana P, Liddle A. 1999. MNRAS 303:535-45
- Weller et al, (2001) Weller J, Battye RA, Kneissl R. 2001. Phys. Rev. Lett. submitted:astro–ph/0110353
- White & Fabian, (1995) White DA, Fabian AC. 1995. MNRAS 273:72–84
- White et al, (1993) White S, Navarro J, Evrard A, Frenk C. 1993. Nature 366:429–33
- Wright, (1979) Wright EL. 1979. ApJ 232:348–51
- Wu & Fang, (1997) Wu X, Fang L. 1997. ApJ 483:62–67