Soft X-ray properties of a high redshift sample of QSOs observed with ROSAT
Abstract
In order to study systematically the soft X-ray emission of Active Galactic Nuclei (AGNs) at medium to high redshifts, we have analyzed ROSAT PSPC and HRI data of QSOs at selected from the second deepest ROSAT PSPC survey carried out in 1991-1993 by McHardy et al. (1998). Our sample of 22 type 1 QSOs is nearly complete above a flux limit of in the band. Of these, nine QSOs show long term () X-ray variability by a factor of . Significant excess absorption above the Galactic column is seen in three QSOs. The soft X-ray photon index of the QSOs ranges from to . Three QSOs have steep soft X-ray spectra (), one of which is a narrow-line QSO – a high luminosity version of narrow-line Seyfert 1 galaxies. The average photon index () is (with a dispersion of ) in the band. The average QSO spectra in four redshift bins flatten from an average photon index of at to at . The flattening of the average photon index can be understood in terms of the redshift effect of the mean intrinsic QSO spectrum consisting of two components – a soft X-ray excess and a power-law component. We have also studied optical spectra of 12 of the 22 QSOs.
keywords:
galaxies:active – galaxies:nuclei – X-rays: galaxies – X-rays: sources1 Introduction
QSOs or quasars represent the high luminosity end of a class of objects known as active galactic nuclei (AGNs). They are the most luminous continuously emitting objects in the universe and emit over the entire range of electromagnetic waves. It is widely believed that high energy emission (X-rays and -rays) from an AGN originates in the innermost region of accretion disk around a super-massive black hole (SMBH) and much of the low energy emission e.g., infrared, optical, ultraviolet, is due to the reprocessing of high energy photons in a medium surrounding the accretion disk. While the atomic line emission in the optical, UV, and X-ray probe the circumnuclear medium surrounding the SMBH, the shape of the X-ray spectrum described by photon index () is a critical parameter to constrain competing models for the mechanisms of X-ray continuum emission.
The increased sensitivity of the position sensitive proportional counter (PSPC) on-board ROSAT compared to earlier missions allowed a significant improvement in the study of the soft X-ray emission of AGNs. The X-ray spectral shape of quasars has been studied extensively using earlier missions such as HEAO-I, Einstein, EXOSAT, and Ginga (e.g., Mushotzky 1984; Wilkes & Elvis 1987; Canizares & White 1989; Comastri et al. 1992; Lawson et al. 1992; Williams et al. 1992). Some of these missions were not sensitive below . These earlier studies suggested that the X-ray emission of quasars is well described by a power-law with photon index for radio-loud quasars and for radio quiet quasars. Large samples of AGNs have been studied by Walter & Fink (1993), Wang, Brinkmann & Bergeron (1996), and by Rush et al. (1996) using the ROSAT PSPC. However, most of the objects studied in the above papers are nearby and intrinsically bright AGNs. Also the AGN samples studied in the above papers are not complete and the derived results may be biased by selection effects. Laor et al. (1994, 1997) studied X-ray spectra of a complete sample of 23 quasars from the Bright Quasar Survey (BQS) with and . They found an average photon index of for their complete sample. Reeves & Turner (2000) studied a larger sample of 62 quasars with redshift in the range 0.06 – 4.3 and . They found an average photon index, for 35 radio-loud quasars and for 27 radio-quiet quasars in their sample. Although the sample of Laor et al. (1997) is complete, it is confined to the nearby universe. The sample of Reeves & Turner (2000) includes some high redshift quasars but most of the quasars are nearby and the sample is not complete.
We present the results of a detailed spectral and timing analysis of a nearly complete sample of 22 type 1 QSOs obtained from the ROSAT PSPC deep survey of McHardy et al. (1998). The basic parameters of the QSOs are listed in Table 1. We will refer to all the objects as QSO, independent of their luminosity, but note that some have low X-ray luminosity (see Table 4). The aims are to extend the study of soft X-ray properties of QSOs at higher redshifts and to investigate whether QSOs at high redshifts have excess soft X-ray emission similar to that seen in the narrow-line Seyfert 1 galaxies. The outline of the paper is as follows. In we describe the sample; in we describe the X-ray observations and analysis. Section 4 deals with optical spectroscopy. In , we compare our results with other studies and discuss some of the implications. Finally, we conclude our study in .
Throughout the paper, luminosities are calculated assuming isotropic emission, a Hubble constant of and a deceleration parameter of unless otherwise specified.
| MJM1 No. | ROSAT name | HRI position2 | Optical position3 | z3 | Radio4 | |||
|---|---|---|---|---|---|---|---|---|
| 2 | RX J1334.7+3800 | 13 34 41.87 | 38 00 11.4 | 13 34 41.82 | 38 00 11.3 | 0.26 | 18.69 | (r) |
| 3 | RX J1333.7+3803 | 13 33 42.41 | 38 03 35.3 | 13 33 42.36 | 38 03 36.3 | 1.069 | 18.60 | |
| 7 | RX J1334.3+3757 | 13 34 17.52 | 37 57 22.1 | 13 34 17.52 | 37 57 22.4 | 1.14 | 18.35 | |
| 10 | RX J1334.2+3759 | 13 34 10.57 | 37 59 56.4 | 13 34 10.62 | 37 59 56.3 | 0.38 | 19.55 | |
| 11 | RX J1333.5+3746 | 13 33 32.32 | 37 46 42.4 | 13 33 32.01 | 37 46 41.1 | 0.826 | 20.74 | |
| 13 | RX J1333.9+3759 | 13 33 58.49 | 37 59 39.3 | 13 33 58.55 | 37 59 38.2 | 1.61 | 21.10 | |
| 15 | RX J1334.7+3759 | 13 34 42.81 | 37 59 15.0 | 13 34 42.77 | 37 59 15.0 | 1.14 | 19.83 | |
| 17 | RX J1334.1+3754 | 13 34 00.96 | 37 54 04.7 | 13 34 01.03 | 37 54 04.9 | 1.64 | 21.12 | |
| 18 | RX J1335.7+3751 | 13 35 44.46 | 37 51 43.3 | 13 35 44.66 | 37 51 40.8 | 1.621 | 20.25 | |
| 20 | RX J1335.5+3757 | 13 35 30.26 | 37 57 50.5 | 13 35 30.30 | 37 57 50.0 | 1.39 | 20.86 | |
| 21 | RX J1334.5+3748 | 13 34 31.30 | 37 48 31.2 | 13 34 31.33 | 37 48 31.4 | 1.359 | 22.27 | |
| 23 | RX J1333.7+3757 | 13 33 44.34 | 37 57 53.6 | 13 33 44.27 | 37 57 52.6 | 0.97 | 20.37 | |
| 24 | RX J1335.6+3757 | 13 35:35.48 | 37:57:46.3 | 13 35 35.48 | 37 57 46.2 | 1.63 | 20.21 | |
| 29 | RX J1335.7+3755 | 13 35 42.38 | 37 55 43.6 | 13 35 42.51 | 37 55 41.8 | 1.90 | 19.30 | |
| 30 | RX J1334.9+3757 | 13 34 52.23 | 37 57 44.7 | 13 34 52.16 | 37 57 44.8 | 1.89 | 20.47 | (r) |
| 31 | RX J1333.9+3752 | 13 33 55.94 | 37 52 57.5 | 13 33 55.81 | 37 52 58.6 | 2.14 | 20.32 | |
| 37 | RX J1334.4+3746 | 13 34 24.43 | 37 46 15.9 | 13 34 24.57 | 37 46 15.2 | 1.570 | 20.11 | |
| 48 | RX J1335.5+3804 | 13 35 30.00 | 38 04 31.5 | 13 35 29.69 | 38 04 32.7 | 0.692 | 19.17 | |
| 56 | RX J1334.7+3757 | 13 34 45.43 | 37 57 21.5 | 13 34 45.35 | 37 57 22.8 | 1.89 | 20.36 | |
| 57 | RX J1333.6+3754 | 13 33 35.69 | 37 54 16.7 | 13 33 35.62 | 37 54 13.2 | 1.525 | 21.68 | |
| 61 | RX J1333.6+3749 | – | – | 13 33 34.86 | +37 49 16.92 | 3.43 | 19.73 | |
| 63 | RX J1334.4+3806 | 13:34:22.44 | 38:06:21.5 | 13 34 22.24 | 38 06 20.1 | 2.593 | 21.40 | |
Identification number in the catalog of McHardy et al. (1998).
Derived from ROSAT HRI observation of 1997.
McHardy et al. (1998)
(r) indicates that the source is detected in the preliminary 20-cm radio map.
2 The QSO sample
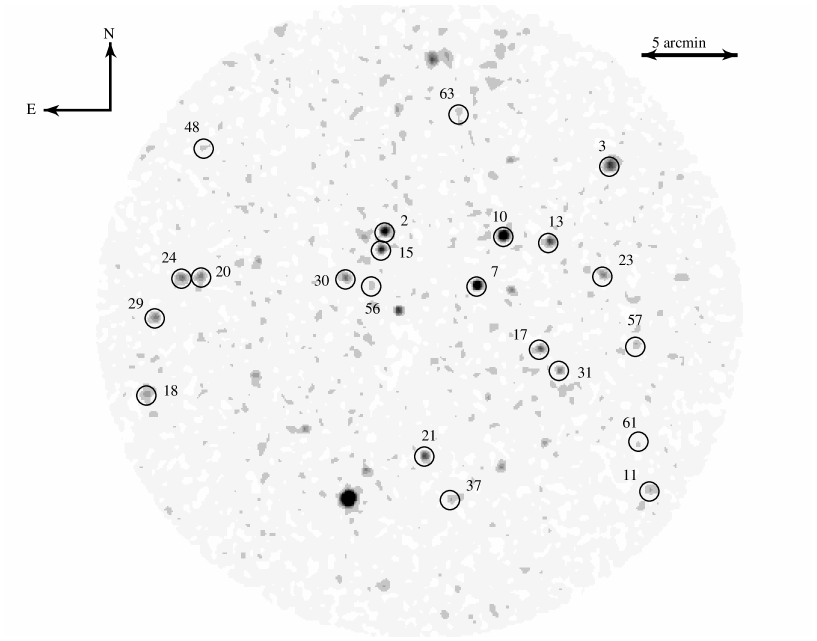
The QSOs were selected from the second deepest ROSAT PSPC survey of McHardy et al. (1998) which covers a circular region of radius of the sky towards the direction where the Galactic is low (). The ROSAT survey consists of two observations with PSPC and one observation with HRI (see below). There are 32 QSOs identified to a flux limit of in the energy band of 0.5–2.0 keV (see Jones et al. 1997; McHardy et al. 1998). In order to be able to derive the shape of the soft X-ray spectrum of the individual QSOs from the single observation with the longest exposure and thus to avoid any effect due to the variation of soft X-ray emission over long time scales, we have selected 22 QSOs and excluded the faintest 10 QSOs which are not detected above level in any of the two PSPC observations. The soft X-ray selected sample of 22 QSOs (type 1) is nearly complete to a flux limit of in the energy band of 0.12.0 keV (corresponding to in the energy band). There are two X-ray sources, MJM 9 and MJM 54 brighter than the above flux limit but the optical nature of these objects is not known (McHardy et al. 1998) due to either lack of an optical counterpart or ambiguity in the identification. The ROSAT HRI image of the circular region of radius is shown in Figure 1. The HRI image was binned by () and then smoothed by convolving with a Gaussian of . All the 22 QSOs are marked in Fig. 1. The centres of the small circles are the optical positions of the QSOs as identified by McHardy et al. (1998). X-ray sources shown in Fig. 1, were classified as QSOs based on their optical spectra. All the 22 QSOs show broad (full width at half maximum (FWHM) ) permitted emission lines (Jones et al. 1997; McHardy et al. 1998). The hardness ratio (), defined as , where H and S are the count rates in the 0.5–2.0 keV and 0.1–0.5 keV bands, of the QSOs spans a range of . In Figure 2, we show the distribution of the QSOs in the sample as a function of redshift and R mag. The number of QSOs increases with magnitude up to and falls at fainter magnitudes (see Fig. 2). The QSO sample is optically complete at but it is likely that a few fainter QSOs have not been detected (McHardy et al. 1998). The redshift of the QSOs ranges from to .

3 X-ray observations and analysis
3.1 X-ray Observations
The region of the sky containing the QSOs was observed twice with the ROSAT (Trümper 1983) Position Sensitive Proportional Counter (PSPC) during 1991–1993, and once with the High Resolution Imager (HRI) (Pfeffermann et al. 1987) in 1997 June 19–July 16. The two PSPC observations carried out during 1991 June 23–26, and 1993 June–July together comprise the second deepest ROSAT PSPC survey. These observations were targeted at , in the sky with an extremely low obscuration due to matter in our Galaxy (). The PSPC deep survey data has already been reported by McHardy et al. (1998). The HRI observation was also a deep survey (exposure time = 201513 s) and was carried out in the same region of sky as the PSPC deep surveys. The details of the ROSAT observations are given in Table 2. All the QSOs lie within from the field centre.
| Serial | Sequence | Instrument | Start Time | End Time | Exposure | |
|---|---|---|---|---|---|---|
| No. | No. | Y, M, D, UT | Y, M, D, UT | Time (s) | ||
| 1. | RH900717N00 | HRI | 1997 06 04 16:12:58 | 1997 07 13 22:26:43 | 201513 | |
| 2. | RP900626N00 | PSPC | 1993 06 19 22:24:46 | 1993 07 16 23:06:28 | 37658 | |
| 3. | RP700283N00 | PSPC | 1991 06 23 20:59:40 | 1991 06 26 20:44:16 | 71803 |
3.2 Optical Identification
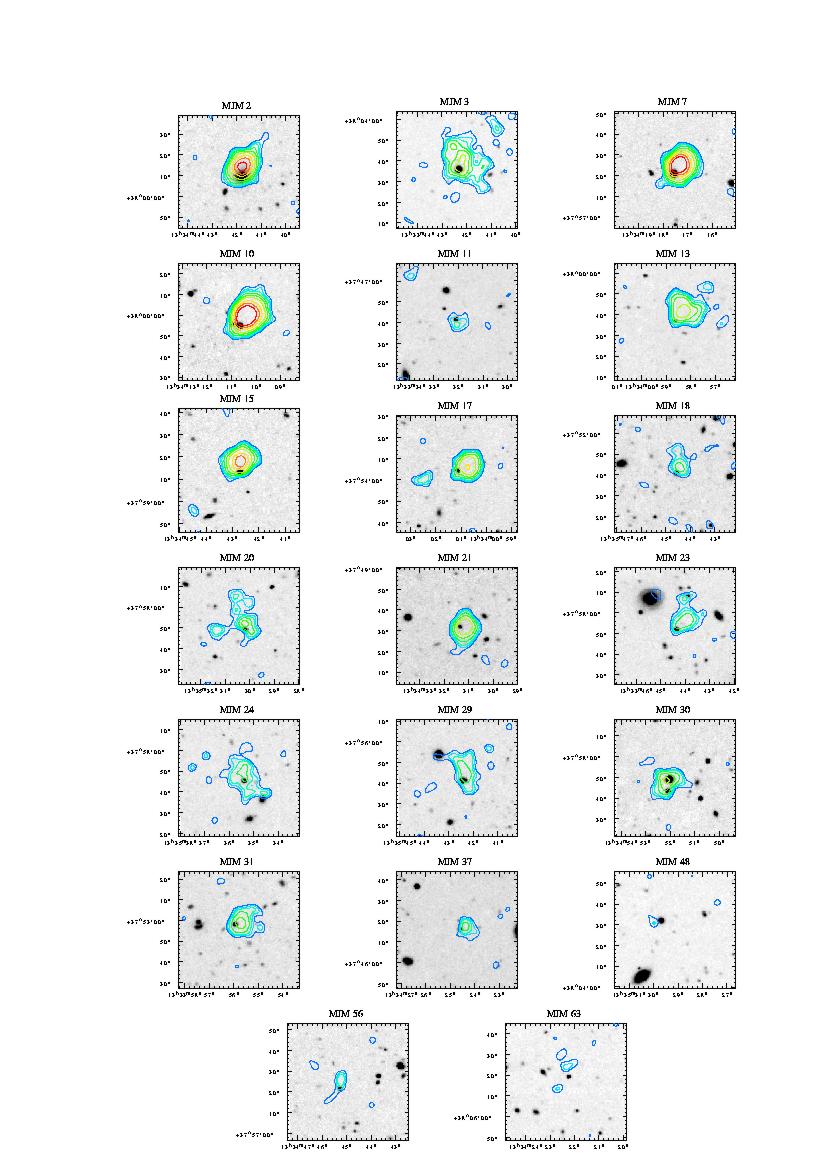
The X-ray sources, presented here, were optically identified with QSOs using ROSAT PSPC and optical images, and optical spectra by McHardy et al. (1998). Here we have confirmed their identification using high resolution HRI X-ray images(central full width half maximum of ). The analysis of HRI X-ray images has been carried out using the PROS111The PROS software package provided by the ROSAT Science Data Center at Smithsonian Astrophysical Observatory. software package. X-ray images were extracted from the observations listed in Table 2 and were smoothed by convolving with a Gaussian of =. We have overlaid the contours of the smoothed HRI image of each QSO onto the corresponding optical image. The optical R band images the QSOs were obtained from the 2.5-m Isaac Newton Telescope (INT) using the wide-field camera on the night of 1999 April 19. The pixel scale is 0.333 arcsec per pixel and the seeing (FWHM) was . The overlays of X-ray contours onto the R-band images are shown in Figure 3. The QSO MJM 61 was not detected in the HRI observation, therefore it is not shown in Fig. 3. The overlays reveal that X-ray emission from some of the QSOs is contaminated with that due to neighbouring sources. In particular, the X-ray emission from the QSOs MJM 18, 20, 23, and 24 may be contaminated significantly, however, the dominant X-ray emission is that due to QSOs. In the following, we have attributed the X-ray emission seen with the PSPC to the individual QSOs due to the difficulty in separating out the small contribution of neighbouring sources in the lower resolution (FWHM ) PSPC images.
The HEASOFT v5.0.1 package was used to analyze the PSPC X-ray data of all QSOs. We have estimated the X-ray count rates for all the QSOs in our sample from the PSPC observations of 1991 and 1993. The total source counts for each QSO were obtained in the energy band of 0.1–2.0 keV from the unsmoothed PSPC images using a circular region centered on the peak positions, and after subtracting the background estimated from 3-4 nearby circular regions. Note that for a few objects e.g., MJM 2, MJM 15 the centres of the circular region were shifted by a few arcsec in order to avoid the contamination from the neighboring objects. The radii of circles, used to extract the source counts, vary from . This was necessitated due to the different off-axis position of individual QSOs and to avoid contamination with the nearby X-ray sources. The background counts were estimated separately for individual objects using 3-4 nearby circular regions of radii in order to avoid any spatial variation of the background intensity. Net source counts were derived by subtracting appropriately scaled background counts. The count rates of all the QSOs, derived from the observations of 1991 and 1993, are listed in Table 3. Also listed in Table 3 are the hardness ratio (HR) values where HR is defined as the ratio of the source counts in the energy band of 0.5–2.0 keV to that in the energy band 0.1–0.5 keV. The QSOs MJM 31, 56, and 63, are not detected during the observation of 1993.
| MJM No.1 | 1991 | 1993 | Variability | ||
| count rate | HR | count rate | HR | factor | |
| 2 | |||||
| 3() | – | ||||
| 7 | |||||
| 10 | – | ||||
| 11() | – | ||||
| 13() | – | ||||
| 15 | |||||
| 17() | |||||
| 18 | – | ||||
| 20() | – | ||||
| 21 | |||||
| 23() | – | ||||
| 24() | – | ||||
| 29() | – | ||||
| 30() | |||||
| 31 | – | – | |||
| 37 | – | ||||
| 48 | |||||
| 56 | – | ||||
| 57() | – | ||||
| 61 | – | ||||
| 63() | – | ||||
1() indicates that the X-ray emission form the source is contaminated by that due to neighbouring sources. The contamination could be as high as in case of MJM 20, 30, 55, 63, and 75. In other sources, the contamination is or less.
3.3 X-ray Light Curves
In order to investigate the time variability of soft X-ray emission from the QSOs, we have extracted light curves from the ROSAT PSPC observations. The light curves for the source and the background were extracted using the ‘xselect’ package with time bins of 2000 s and in the PSPC energy band of 0.1–2.0 keV containing all the X-ray photons falling within “good time intervals”. The source regions and the background regions were the same as described above. It was found that the background was variable by a factor of during the observation of 1993 June 19. Therefore, the light curves obtained from the 1993 observation are not suitable for variability studies. During the observation of 1991 June 23, the background was reasonably constant. The background subtractions were carried out after appropriately scaling the background light curve to have the same area as the source extraction area. In order to test the constancy of the background light curves and soft X-ray variability of the QSOs, we have fitted constant count rates to the background light curves and source light curves. From the best-fit minimum values, it was found that background count rates obtained separately for each QSO are reasonably constant. It was also found that all QSOs, except MJM 10, do not show significant short-term variability during the observation of 1993 June-July. The soft X-ray variability characteristics of the QSO MJM 10 has been discussed by Dewangan et al. (2001).
A comparison of count rates during the observations 1991 and 1993 (see Table 3) reveals that 9 out of 22 QSOs show long term (time scale ) variability. The QSOs MJM 2, 15, 17, and 48 varied by a factor of 2 within 2 yr while the QSOs MJM 7, 21, and, 30 varied by factor of , , and , respectively. The two QSOs MJM 56, and MJM 63, which are not detected above level during the observation of 1993, varied by factor of more than 3.6 and 1.3, respectively.
3.4 X-ray Spectral Analysis
Photon energy spectra of all the QSOs in our sample were accumulated from their PSPC observation of 1991. The same regions for the source and the background, as described above (), were used. To improve the statistics, the ROSAT PSPC pulse height data obtained in 256 pulse height channels for each QSO were appropriately re-grouped to have at least 20 counts in each channel. As examples, X-ray spectra of two QSOs thus obtained from the observation of 1991 are shown in Figure 4111Rest of the X-ray spectra can be made available on request to G. C. Dewangan (email: gulab@tifr.res.in).
We used the XSPEC (Version 11.0) spectral analysis package to fit the data with spectral models. An appropriate response matrix and an auxiliary response file of the effective area of the telescope were used to define the energy response of the PSPC. The ROSAT PSPC spectra of QSOs shown in Fig. 4, were used for fitting spectral models. The X-ray spectrum of each QSO in the sample was first fitted with a redshifted power-law model with photon index, , and absorption due to an intervening medium (Model A) with the absorption cross-sections as given by Balucinska-Church & McCammon (1992) and using the method of -minimization. The results of this fitting and the best-fit spectral model parameters are shown in Table 4. The errors quoted were calculated at the confidence level based on +2.71. This simple model is a good fit to all the individual QSO spectra as evidenced by the minimum reduced values. The absorbing column densities derived by fitting the power-law model to the spectra of MJM 2, MJM 3, MJM 11, MJM 13, MJM 17, MJM 18, MJM 20, MJM 21, MJM 23, MJM 24, MJM 31, MJM 37, MJM 56, MJM 57, and MJM 61 are similar within errors to that due to our own Galaxy measured from 21-cm radio observations along the line of sight to the source (Dickey & Lockman 1990), however, the error bars in the derived are quite large for some objects. To better constrain the photon indices for these QSOs, we next fixed the absorbing column density to the Galactic value and fitted the power-law model (Model B) to each QSO. The results of this fitting are also given in Table 4.
The absorbing column densities, , , , derived for the QSOs MJM 7, MJM 10, and MJM 15 by fitting absorbed power-law model are in excess of the Galactic value () measured along their line of sight. This indicates that all the X-ray absorption may not be only due to matter in our own Galaxy but also due to matter local to the source. In order to verify the presence of excess absorption, we fixed the neutral hydrogen column density to the Galactic value and fitted the absorbed power-law model (Model B). In each case, although the fit is acceptable, there is an increase in the value of ( for 23 dof in case of MJM 7; for 25 dof in case of MJM 10; for 15 dof in case of MJM 15). To estimate the excess absorption local to each of the three QSOs, we introduced an additional component for absorption local to the source in our model B (Model C – redshifted power-law modified with Galactic as well as intrinsic absorption local to the source) and fitted to PSPC spectrum of the each of the three QSOs. The derived excess absorption, , are for MJM 7, for MJM 10, and for MJM 15. The best-fit photon indices () are , , and for MJM 7, MJM 10, and MJM 15, respectively. We measure the statistical significance of the reduction in the best-fit with addition of an intrinsic absorption component, described by as a free parameter, using the F-test (Bevington 1969). The calculated values of F-statistic values and the corresponding probabilities are given in Table 5 for the QSOs MJM 7, 10, and 15. The F-statistics probability is the probability that the reduction in is not statistically significant. As can be seen the Table 5, at level, the presence of additional absorption component local to the source is significant for the QSOs MJM 7, MJM 10 and MJM 15.
| MJM No. | Modela | Minimum | dof | ||||
|---|---|---|---|---|---|---|---|
| Reduced | |||||||
| 2 | A | 7.06 | 0.16 | 0.695 | 25 | ||
| B | 7.9(fixed) | 7.10 | 0.15 | 0.673 | 26 | ||
| 3 | A | 8.81 | 5.8 | 0.888 | 15 | ||
| B | 7.9(fixed) | 8.85 | 7.56 | 0.944 | 16 | ||
| 7 | A | 4.74 | 9.1 | 0.661 | 22 | ||
| B | 7.9(fixed) | 4.38 | 4.21 | 0.864 | 23 | ||
| C | 7.9(fixed), | 4.55 | 18.8 | 0.742 | 22 | ||
| 10 | A | 8.8 | 1.71 | 0.96 | 24 | ||
| B | 7.9(fixed) | 8.22 | 0.72 | 1.58 | 25 | ||
| C | 7.9(fixed), | 8.8 | 1.9 | 0.96 | 24 | ||
| 11 | A | 4.10 | 1.54 | 1.201 | 15 | ||
| B | 7.9(fixed) | 4.06 | 1.43 | 1.130 | 16 | ||
| 13 | A | 3.70 | 14.2 | 1.091 | 17 | ||
| B | 7.9(fixed) | 3.51 | 8.45 | 1.105 | 18 | ||
| 15 | A | 6.32 | 13.2 | 1.112 | 15 | ||
| B | 7.9(fixed) | 5.93 | 6.35 | 1.458 | 16 | ||
| C | 7.9(fixed), | 6.14 | 36.10 | 1.225 | 15 | ||
| 17 | A | 2.43 | 5.80 | 1.010 | 8 | ||
| B | 7.9(fixed) | 2.41 | 5.39 | 0.903 | 9 | ||
| 18 | A | 2.36 | 6.91 | 1.250 | 15 | ||
| B | 7.9(fixed) | 2.26 | 4.93 | 1.205 | 15 | ||
| 20 | A | 2.76 | 7.4 | 0.825 | 13 | ||
| B | 7.9(fixed) | 2.62 | 4.31 | 0.850 | 14 | ||
| 21 | A | 1.56 | 2.0 | 0.736 | 5 | ||
| B | 7.9(fixed) | 1.55 | 1.85 | 0.618 | 6 | ||
| 23 | A | 4.25 | 2.68 | 1.055 | 12 | ||
| B | 7.9(fixed) | 4.24 | 3.24 | 0.995 | 13 | ||
| 24 | A | 1.96 | 3.51 | 0.663 | 8 | ||
| B | 7.9(fixed) | 1.96 | 4.46 | 0.731 | 9 | ||
| 29 | A | 3.07 | 11.35 | 0.545 | 12 | ||
| B | 7.9(fixed) | 3.06 | 14.5 | 0.519 | 13 | ||
| 30 | A | 1.86 | 4.81 | 1.350 | 8 | ||
| B | 7.9(fixed) | 1.79 | 5.90 | 1.351 | 9 | ||
| 31 | A | 1.47 | 9.35 | 0.830 | 7 | ||
| B | 7.9(fixed) | 1.41 | 6.17 | 0.778 | 8 | ||
| 37 | A | 1.42 | 4.29 | 1.167 | 10 | ||
| B | 7.9(fixed) | 1.42 | 4.15 | 1.061 | 11 | ||
| 48 | A | 2.79 | 0.46 | 0.747 | 15 | ||
| B | 7.9(fixed) | 2.62 | 0.70 | 0.971 | 16 | ||
| 56 | A | 1.73 | 17.4 | 1.343 | 13 | ||
| B | 7.9(fixed) | 1.57 | 6.79 | 1.319 | 14 | ||
| 57 | A | 1.91 | 2.77 | 0.652 | 15 | ||
| B | 7.9(fixed) | 1.74 | 4.93 | 0.721 | 16 | ||
| 61 | A | 2.55 | 42.3 | 0.854 | 7 | ||
| B | 7.9(fixed) | 2.44 | 63.4 | 1.021 | 8 | ||
| 63 | A | 1.53 | 10.4 | 0.933 | 6 | ||
| B | 7.9(fixed) | 1.45 | 15.6 | 1.296 | 9 |
Model A(B) a is redshifted simple power-law model modified by an intervening medium (Galaxy) described by (Galactic ) at z=0.0. Model C is same as model B with an addition absorbing component at the source redshift.
Observed flux in units of in the energy band .
Unabsorbed soft X-ray luminosity in units of in the energy band .


| MJM No. | F-statistics value | F-statistic probability | dof |
|---|---|---|---|
| 7 | 4.79 | 22 | |
| 10 | 18.0 | 24 | |
| 15 | 4.04 | 15 |
For the QSOs MJM 29, MJM 30, MJM 48, MJM 61, and MJM 63, the amount of the absorbing column derived from the power-law fitting is unphysically small compared to the Galactic values of absorbing columns along their respective lines of sight. In order to constrain the photon indices, we fixed the absorbing column density to the Galactic value along the respective sight lines of individual QSOs and carried out the power-law model fitting to the PSPC spectra of the above QSOs. The PSPC spectra of the QSOs are well described by a power-law modified with absorbing column in our own Galaxy, as evidenced by the reduced values (see Table 4).
| MJM No. | Modela | Minimum | dof | ||||
|---|---|---|---|---|---|---|---|
| Reduced | |||||||
| 2 | B | 7.9 | 14.27 | 0.3 | 0.751 | 23 | |
| 3 | B | 7.9 | 6.47 | 5.5 | 1.007 | 10 | |
| 7 | B | 7.9 | 7.13 | 7.8 | 2.123 | 18 | |
| C | 7.9, | 7.64 | 994.0 | 1.344 | 17 | ||
| 10 | B | 7.9 | 1.1 | 1.11 | 12 | ||
| C | 7.9, | 2.9 | 0.82 | 11 | |||
| 11 | B | 7.9 | 3.85 | 1.5 | 0.802 | 10 | |
| 13 | B | 7.9 | 2.08 | 4.14 | 1.330 | 5 | |
| 15 | B | 7.9 | 2.35 | 11.8 | 0.760 | 10 | |
| 17 | B | 7.9 | 3.53 | 8.6 | 0.664 | 6 | |
| 18 | B | 7.9 | 3.70 | 7.4 | 0.768 | 7 | |
| 20 | B | 7.9 | 2.27 | 3.1 | 1.520 | 5 | |
| 21 | B | 7.9 | 2.67 | 3.2 | 1.245 | 9 | |
| 23 | B | 7.9 | 3.84 | 2.8 | 0.454 | 6 | |
| 24 | B | 7.9 | 2.96 | 6.9 | 1.117 | 4 | |
| 29 | B | 7.9 | 4.11 | 18.5 | 1.486 | 7 | |
| 30 | B | 7.9 | 2.55 | 9.2 | 0.629 | 5 | |
| 48 | B | 7.9 | 2.44 | 0.5 | 0.669 | 6 | |
| 57 | B | 7.9 | 2.29 | 4.9 | 1.335 | 5 |
Models B and C are same as that defined in Table 4.
Observed flux in units of in the energy band .
Unabsorbed soft X-ray luminosity in units of in the energy band .
In order to investigate any change in the soft X-ray spectral shape and flux, we have also analyzed the PSPC spectra of the QSOs observed in 1993. The PSPC spectra of the QSOs and the corresponding background spectra were extracted from the observation of 1993 using the similar extraction regions as for the observation of 1991. The same spectral models, namely redshifted and absorbed power-law model with as a free parameter and fixed to the Galactic, as described above were fitted to the PSPC spectra obtained in 1993. The power-law model with as a free parameter is a good description to the observed PSPC spectra of individual QSOs. Except for the QSOs MJM 7 and MJM 10, the Galactic along the line of sight of each QSO was found to be well within the range of derived . Therefore, the power-law model with fixed to the Galactic value was fitted to the spectrum of each QSO. The best-fit parameters derived are given in Table 6.
The PSPC spectrum of the QSO MJM 7 is well described by a power-law of , and (reduced for 17 dof). The best-fit value of is much higher than the Galactic value () suggesting excess absorption. The power-law fit with fixed to the Galactic value is not acceptable (reduced for 18 dof). Addition of an absorbing component, apart from the Galactic absorption component, local to the QSO gives an acceptable fit (reduced for 17 dof) The best-fit parameters are , and . The F-statistic value for the addition of the intrinsic absorption component to the power-law with fixed at the Galactic value is 11.4 and the F-statistic probability is . Thus the addition of an excess absorption at the QSO redshift to the power-law model with fixed is a significant improvement at level.
The power-law model with as a free parameter is an acceptable fit (reduced for 11 dof) to the PSPC spectrum of MJM 10. The best-fit parameters are and . The best-fit value of is significantly higher than the Galactic value () indicating excess absorption. The best-fit power-law model with fixed to the Galactic value is also an acceptable fit (reduced for 12 dof) although the fit is becomes poor again indicating excess absorption. Next, we introduced an additional absorbing component local to the source and carried out the model fitting. The fit is an acceptable fit (reduced for 11 dof). The F-statistic value for the addition of new component to the power-law model with fixed is 5.24 and the corresponding F-statistic probability is . Hence the power-law model modified by Galactic absorption and intrinsic absorption is a significant improvement at level but not a significant improvement at level over the power-law model with Galactic absorption. In the case of MJM 15, an excess absorption is not inferred from the 1993 observations. This discrepancy could be due to the low S/N and poor spectral resolution of the PSPC spectra of MJM 15.
3.5 Optical Spectroscopy
Optical spectra of 12 of the 22 QSOs were obtained on the night of 1994 April 7 with the Multi Object Spectrograph (MOS) on the 3.6-m Canada France Hawaii Telescope (CFHT) as a part of a program to identify X-ray sources (McHardy et al. 1998). A grism in the first order with a Lorel3 CCD detector was used to cover a wavelength range of – with resolution.
Optical spectra of the 12 QSOs were reduced using IRAF (v2.11.3). For details of the reduction see McHardy et al (1998). The flux calibration is somewhat uncertain because the slitlets were not aligned at the parallactic angle. The flux calibrated spectra were corrected for Galactic extinction by adopting the extinction law in Cardelli et al. (1989). Color excess due to Galactic reddening along the line of sight of each QSO was calculated from the neutral hydrogen column density using the relation
| (1) |
(Diplas & Savage 1994). The dereddened spectra were then deredshifted by dividing the starting wavelength and the pixel width in Angstrom by (1+z). The final spectra of 12 QSOs are shown in Figure 5. For each of the 12 objects, relative flux against the rest wavelength in has been plotted. Strong emission lines have been marked in the figure.
The analysis of the emission lines of MJM 10 has been discussed by Dewangan et al. (2001). Emission lines of other QSOs were modeled by Gaussian profiles using the IRAF task ngaussfit. As a first step, we fitted a single Gaussian profile to the strong emission lines. Most of the emission lines are described by a single Gaussian profiles, however, the broad wings of the Mg II lines in the spectra of the QSOs MJM 3, 7, and 20 are not well fitted by a single Gaussian profile. Therefore, the Mg II line in the spectra of the above QSOs were modeled by two Gaussian which gave satisfactory fit to the line core as well as to the wings. The two component fitting to the Mg II line revealed that the broad component is blue shifted with respect to the narrow component (see Table 7). The broad components of the Mg II line is blue shifted by , , and in the spectra of MJM 3, 7, and 20, respectively. In the rest of the QSO spectra only one component is detected. This could be due to the low S/N ratios of the optical spectra.

| MJM | Line | Component 1 | Component 2 | Comments | ||||
| No. | EW | EW | ||||||
| () | () | () | () | () | () | |||
| 3 | Mg II | – | ||||||
| (0.2) | (56.9) | (3.2) | (0.8) | (346.3) | (7.1) | – | ||
| 7 | Mg II | – | ||||||
| (0.6) | (144.8) | (4.1) | (2.0) | (722.9) | (7.9) | – | ||
| C III] | – | – | – | Blended with Si III] | ||||
| and Al III | ||||||||
| (3.2) | (1558.1) | (33.8) | – | – | – | – | ||
| 10 | H | from Dewangan et al. (2001) | ||||||
| – | (520) | (3.6) | – | (91) | (3.8) | |||
| 5007 | – | – | – | – | ” | |||
| – | – | – | – | – | (0.5) | ” | ||
| H | 6563 | 6563 | 54.5 | ” | ||||
| – | (479) | (7.5) | – | (41) | – | ” | ||
| Fe II | – | – | 159 | – | – | – | ” | |
| 13 | – | – | – | – | – | – | – | Line parameters unreliable |
| 20 | Mg II | C III] parameters unreliable | ||||||
| (0.7) | (244.9) | (11.3) | (3.4) | (1264.0) | (19.8) | |||
| 23 | – | – | – | – | – | – | – | Line parameters unreliable |
| 24 | Mg II | 2795.9 | – | – | – | Broad component undetectable | ||
| (0.6) | (123.0) | (2.7) | – | – | – | – | ||
| C III] | – | – | – | – | – | FHHMs unreliable. | ||
| – | – | (2.3) | – | – | – | |||
| 29 | Mg II | – | – | – | Broad component not detectable | |||
| (0.3) | (69.2) | (4.8) | – | – | – | C III] profile corrupted | ||
| 30 | Mg II | 2798.6 | – | – | – | Only one component detected | ||
| (0.8) | (318.9) | (124.2) | – | – | – | C III] line corrupted | ||
| C IV | – | – | – | – | ||||
| (0.2) | (101.3) | (106.4) | – | – | – | – | ||
| 31 | Mg II | – | – | – | – | |||
| (1.1) | (231.6) | (32.2) | – | – | – | – | ||
| C III] | – | – | – | Deblending not possible | ||||
| (0.6) | (388.0) | (16.2) | – | – | – | – | ||
| 56 | Mg II | – | – | – | C III] corrupted | |||
| (1.3) | (330.4) | (40.7) | – | – | – | – | ||
| 61 | C III] | – | – | – | – | |||
| (3.2) | (1106.8) | (269.7) | – | – | – | – | ||
| C IV | – | – | – | Ly + N V is corrupted | ||||
| (0.4) | (172.6) | (53.7) | – | – | – | – | ||
Corrected for the instrumental broadening (FWHM).
4 Discussion

4.1 The soft X-ray spectral shape
The deep PSPC observations together with improved sensitivity and energy resolution, compared with earlier instruments, allows us to determine the shape of the soft X-ray continua of QSOs of redshifts up to 3.43. There are three QSO namely MJM 7, MJM 10, and MJM 15 which show steeper soft X-ray continua (). The QSO MJM 10 is known to be a narrow-line QSO (NLQSO) – high luminosity version of narrow-line Seyfert 1 galaxies (NLS1s) (Dewangan et al. 2001). The average photon index of the QSOs is with a dispersion of . 10 QSOs with have mean photon index of (with dispersion about mean of ) and 12 QSO with have mean photon index of with a dispersion of . The average photon index of the QSOs with in our sample appears to be flatter than the average photon index of QSOs at low redshifts. Walter & Fink (1993) analyzed the PSPC spectra of 58 AGNs observed in the All Sky Survey (RASS) which contains a subsample of 24 QSOs with mean photon index, (Laor et al. 1997). A similar average photon index of was found by Schartel et al. (1996) for 72 QSOs from the LBQS sample detected in the RASS. Laor et al. (1997) studied the PSPC spectra of a complete sample of 23 optically selected QSOs with and found average photon index of for their sample.
In order to further explore the redshift dependence of soft X-ray spectral slope of QSOs, we formed average spectra of QSOs in four redshift bins – (5 QSOs), (7 QSOs), (7 QSOs), and (3 QSOs). The average spectra were then fitted by simple power-law modified by the Galactic absorption only. In Figure 6, we have plotted the average photon index as a function of redshift for the QSOs in our sample. Also plotted in Fig. 6 is the average photon index of 23 Quasars from the Bright Quasar Survey (BQS) sample of Laor et al. (1997). The average photon index flattens at higher redshifts e.g., at and at .
Blair et al. (2000) studied soft X-ray spectral evolution with redshift using a large sample of 165 QSOs observed with ROSAT and found the average spectra in 5 redshift bins harden from at to at . This result is similar to that found here. Blair et al. (2000) also noted that the spectra in band show no significant variation in spectral index with redshift suggesting the presence of a spectral upturn below . While Blair et al. (2000) found that at lower redshifts spectra need a soft excess component in addition to a power-law and inclusion of a blackbody component () for the soft excess results in a significant improvement over a single power-law, Laor et al. (1997) did not require such a soft excess component. The discrepancy could be due to the fact that Laor et al. (1997) added systematic errors in quadrature to the statistical errors. The difference between the average spectral slopes of QSOs at low and high redshifts can be understood in terms of mean X-ray spectrum consisting of a power-law of and a soft excess below in the rest frame. At higher redshifts () the rest frame soft excess component below is not covered in the observed band, the observed spectrum is a power-law with . While at lower redshifts, the observed spectrum, consisting of both soft excess and power-law component, is steeper when fitted with a single power-law and similar to that of QSOs when the soft excess component below is excluded from the fit. This could also be the reason why Reeves & Turner (2000) found mean photon index of in the ASCA band for their sample of 27 radio quiet quasars.
4.2 Intrinsic Absorption
Due to the low signal-to-noise of the PSPC spectra of the QSOs in our sample, we are not able to determine the consistency of HI columns derived from the 21 cm radio observations (Dickey & Lockman 1990) and HI columns derived from the absorbed power-law model fits to the observed PSPC spectra. Laor et al. (1997) have shown that the two columns agree to a level of about at high Galactic latitudes. There are indications that some broad-line AGNs show intrinsic absorption (e.g., Page et al. 2001; Akiyama et al. 2000). The power-law models modified by the Galactic absorption provide acceptable fits to the PSPC spectra of all QSOs except MJM 7, MJM 10, and MJM 15 (see Tables 4,& 5). Thus most of the QSOs in our sample lack intrinsic absorption. Only three QSOs, MJM 7, MJM 10, and MJM 15, out of 22 show indications for the presence of intrinsic absorption. The amount of intrinsic absorption inferred from the best-fit absorbed power-law models, for MJM 7, is quite high and may cause the QSO to be redder than others in the sample. The ratio of soft X-ray to optical R band flux can be written as
| (2) |
where and are X-ray and optical R band fluxes, and is the R band magnitude. For MJM 7, the ratio of observed X-ray and optical flux () is calculated to be while the ratio is 0.0160 for MJM 15 which is located at the same redshift (z=1.14) as MJM 7. In order to investigate whether the lack of soft X-ray emission of MJM 7 is only due to intrinsic absorption or the QSO is intrinsically X-ray weak, we calculated the ratio of unabsorbed soft X-ray flux and observed R band flux for MJM 7 and MJM 15. The ratio () is 0.017 for MJM 7 and 0.072 for MJM 15. Thus, the low observed X-ray flux of MJM 7 may not be entirely due to absorption and MJM 7 could be intrinsically weaker. The amount of intrinsic HI column in MJM 10 is small () and is similar to that observed in some NLS1 galaxies (Grupe et al. 1998).
4.3 Optical Spectra
Optical spectra of the 12 QSOs, except MJM 10, are typical of QSOs. The optical spectra of MJM 10 is typical of NLS1 galaxies or NLQSOs and has been discussed in detail by Dewangan et al. (2001). The other 11 QSOs show broad permitted lines in the ultra-violet region. The Mg II lines in the spectra of the QSOs MJM 3, 7, and 20 have been decomposed into a narrow and a broad component. The broad component is found to be blueshifted by , , and with respect to the narrow component in the spectra of MJM 3, 7, and 20. The Mg II lines in the spectra of the QSOs MJM 3, 7, and 20 have been decomposed into a narrow and a broad component. The broad component is found to be blueshifted by , , and with respect to the narrow component in the spectra of MJM 3, 7, and 20. This suggests that either the red wings of the Mg II lines of MJM 3, 7, and 20 are affected by absorption features more strongly than the blue wings or the broad components of the Mg II lines originate in the outflowing winds.
5 Conclusions
We have derived soft X-ray spectral shapes and light curves of a nearly complete
sample of 22 QSOs. We also presented optical spectra of 12 QSOs
from our sample. Our main results are as follows.
(i) About of the QSOs show a long term ()
soft X-ray variability while only one QSO MJM 10 shows rapid variability.
(ii) Only three QSOs, MJM 7, 10, and 15 out of 22 QSOs () show
indications for the presence of significant intrinsic absorption.
The former two QSOs show excess
absorption during both the observations of 1991 and 1993, while MJM 15 does not
show excess absorption during the observation 1993.
(iii) The soft X-ray photon index of the QSOs in our
sample ranges from 1.4 to 3.7. The average photon index of the sample
is with a dispersion of .
(iv) The average photon index of the QSOs is found to flatten at higher redshift.
This can be
understood in terms of the redshift effect of mean intrinsic QSO spectra
consisting two components – a soft excess component and a power-law.
(v) Only one QSO MJM 10 out of 22 has been found to be an NLQSO.
(vi) The broad component of the Mg II line in the spectra of MJM 3, 7,
and 20 are found to be blueshifted by , , and
, respectively.
References
- [] Akiyama, M. et al. 2000, ApJ, 532, 700
- [] Balucinska-Church, M., & Mc Cammon, D., 1992, ApJ, 400, 699.
- [] Bevington, P. R., 1969, in Data Reduction and Error Analysis for the Physical Sciences.
- [] Blair, A. J., Stewart, G. C., Georgantopoulos, I., Boyle, B. J., Griffiths, R. E., Shank, T., & Almaini, O., 2000, MNRAS, 314, 138.
- [] Canizares, C. R., & White, J. L., 1989, ApJ, 339, 27.
- [] Cardelli, J. A., Clayton, G. C., and Mathis, J. S., 1989, ApJ, 345, 245.
- [] Comastri, A., Setti, G., Zamorani, G., Elvis., M., Giommi, P., Wilkes, B. J., & McDowell, J. C., 1992, ApJ, 384, 62.
- [] Dewangan, G. C., Singh, K. P., Jones, L. R., McHardy, I. M., Mason, K. O., Newsam, A. M., 2001, MNRAS, 325, 1616.
- [] Dickey, J. M., & Lockman, F. J., 1990, ARA&A, 28, 215.
- [] Diplas, A., & Savage, B. D., 1994, ApJ, 427, 274.
- [] Grupe, D., Beuermann, K., Thomas, H. -C., Mannheim, K., & Fink, H. H., 1998, A&A, 330, 25.
- [] Jones, L. R., McHardy, I. M., Merrifield, M. R., Mason, K. O., Smith, P. J., Abraham, R. G., Branduardi-Raymont, Newsam, A. M., Dalton, G., Rowan-Robinson, M., & Luppino, G., 1997, MNRAS, 285, 547.
- [] Laor, A., Fiore, F., Elvis, M., Wilkes, B. J., & McDowell, J. C., 1994, ApJ, 435, 611.
- [] Laor, A., Fiore, F., Elvis., M., Wilkes, J., & McDowell, J. C., 1997, 477, 93.
- [] Lawson, A. J., Turner, M. J., Williams, O. R., Stewart, G. C., & Saxton, R. D., 1992, MNRAS, 259, 743.
- [] McHardy, I. M., Jones, L. R., Merrifield, M. R., Mason, K. O., Newsam, A. M., Abraham, R. G., Dalton, G. B., Carrera, F., Smith, P. J., Rowan-Robinson, M., Wegner, G. A., Ponman, T. J., Lehto, H. J., Branduardy-Raymont, G., Luppino, G. A., Efstathiou, G., Allan, D. J., & Quenby, J. J., 1998, MNRAS, 295, 641.
- [] Mathur, S., 2000, MNRAS, 314, L17.
- [] Mushotzky, R. F., 1984, Adv. Space Res., 3(10), 157.
- [] Osterbrock, D. E., 1987, Lecture Notes in Physiscs, Springer Verlag Heidelberg, 307, 1.
- [] Page, M. J., Mittaz, J. P. D., & Carrera, F. J. 2001, MNRAS, 325, 575.
- [] Pfeffermann, E., et al. 1987, Proc. SPIE Int. Soc. Opt. Eng., 733, 519.
- [] Reeves, J. N., & Turner, M. J. L., 2000, MNRAS, 316, 234.
- [] Remillard, R. A., Grossan, B., Bradt, H. V., Ohashi, T., Hayashida, K., Makino, F., & Tanaka, Y., 1991, Nature, 350, 589.
- [] Reynolds, C. S., 1997, MNRAS, 286, 513.
- [] Rush, B., Malkan, M. A., Fink, H. H., & Voges, W., 1996, ApJ, 471, 190.
- [] Schartel, N., Walter, R., Fink, H. H., Trümper, J., 1996, A&A, 307, 33.
- [] Trümper, J. 1982, Adv. Space Res., 2, 241.
- [] Wang, T., Brinkmann, W., & Bergeron, J., 1996, A&A, 309, 81.
- [] Williams, O. R., et al. , 1992, 389, 157.
- [] Walter, R., & Fink, H. H., 1993, A&A, 274, 105.
- [] Wilkes, B. J., & Elvis, M., 1987, ApJ, 323, 243.