ISO-LWS observations of C+ and O0 lines in absorption toward Sgr B2111Based on observations with ISO, an ESA project with instruments funded by ESA Member States (especially the PI countries: France, Germany, the Netherlands and the United Kingdom) with the participation of ISAS and NASA.
Abstract
High spectral resolution Fabry-Pérot observations of the [O I] 63.2 and 145.5 m and [C II] 157.7 m fine structure lines are presented for the center of the Sagittarius B2 complex (Sgr B2). The data were obtained with the Long Wavelength Spectrometer on board the Infrared Space Observatory (ISO). Both the [O I] 63.2 m and the [C II] 157.7 m lines are detected in absorption. The upper state level of atomic oxygen at 145.5 m is in emission. Whereas the [O I] 63.2 m line is seen in absorption over the entire wavelength range to 100 km s-1, the [C II] 157.7 m line displays a more complex profile: absorption occurs at velocities 20 km s-1 and emission comes from the Sgr B2 complex at velocities greater than 20 km s-1. Using observations of the CO isotopes and of the H I lines, absorption components can be associated with many clouds along the Sagittarius B2 line of sight. From these data, we were able to disentangle three different layers which contain atomic oxygen. These layers, as predicted by PDR models, are characterized by different forms of carbon in the gas phase, i.e. the C+ external layer, the C+ to C0 transition and the CO internal layer. We derive lower limits for the column densities of atomic carbon and oxygen of the order of 1018 cm-2 and 3 1019 cm-2, respectively. An O0/CO ratio of around 2.5 is computed in the internal cores of the clouds lying along the line of sight, which means that 70% of gaseous oxygen is in the atomic form and not locked into CO. The fact that the [C II] 157.7 m line is detected in absorption implies that the main cooling line of the interstellar medium can be optically thick especially in the direction of large star-forming complexes or in the nuclei of galaxies. This could partially account for the deficiency in the [C II] 157.7 m line which has been recently found toward infrared bright galaxies in ISO data.
1 Introduction
Observations have suggested that, in some molecular clouds, most of the gas-phase oxygen might be in atomic form, in contradiction with predictions of steady state chemical models (e.g., Lee, Bettens & Herbst 1996) which yield CO, O, and O2 as the major oxygen bearing species in molecular clouds. First suggestions of a high atomic oxygen abundance were made by Jacq et al. (1990) and Schulz et al. (1991) in order to interpret their HDO observations of hot cores and quiescent clouds. These results are in accord with models which take into account cosmic-ray induced photo-dissociation (e.g., Jacq et al. 1990; Wannier et al. 1991). Further evidence has been obtained from observations of the [O I] 63.2 m fine structure line which has been detected in absorption against the far-infrared continuum of bright galactic sources, namely: DR 21 (Poglitsch et al. 1996), Sgr B2 (Baluteau et al. 1997) and NGC 6334V (Kraemer et al. 1998). These observations indicate that the absorbing material is predominantly in foreground cloud(s) where the abundance of the atomic oxygen is within a factor of a few of the cosmic abundance.
Recent studies have strengthened the above results. Based on ISO-LWS Fabry-Pérot data, Vastel et al. (2000) have modelled the [O I] 63.2 m line absorption components in the direction of the compact H II region W49 N. Combining these observations with molecular (CO and its isotopes) and H I observations, they showed that both molecular and atomic clouds absorb the strong continuum at 63 m, and disentangled the absorption due to the molecular clouds from the absorption due to the atomic (H I ) clouds. They concluded that the major part of the 63.2 m [O I] absorption is due to the cold molecular clouds along the line of sight and, through the computation of O0/CO ratio, that in these clouds the gaseous oxygen is almost totally in atomic form.
Similar results were obtained toward Sgr B2 by Lis et al. (2001). They found three [O I] 63.2 m absorption components corresponding to foreground clouds, for which the oxygen content of the atomic halo gas could be estimated based on H I observations. Lis et al. (2001) found that the remaining O0 column density is correlated with the observed 13CO column density, corresponding to an average O0/CO ratio of about 9 and to an atomic oxygen abundance of 2.7 10-4 in the dense gas phase.
The full Fabry-Pérot ISO-LWS spectrum which was obtained on Sgr B2 as part of the ISO Central Program (see Baluteau et al. in preparation, for a detailed description) enables us to study, at high spectral resolution, the atomic fine-structure of oxygen and carbon in this source and to analyze in a consistent way the profiles of the [O I] lines at 63.2 and 145.5 m and of the [C II] 157.7 m line. Sgr B2 is the most massive star-forming region of an ensemble of dense cloud cores in the central ( pc) region of the Galaxy. Its estimated mass is larger than (Lis, Carlstrom & Keene 1991), and the high opacities found toward Srg B2 makes it one of the best candidate for absorption studies. Sgr B2 is located at about 8.5 kpc from the Sun (adopting the IAU distance) and has a projected distance of from the Galactic Center. Ground-based spectroscopic observations of Sgr B2 have shown a very complex pattern of absorption features, with numerous components of foreground gas associated with clouds along the line of sight, covering a wide range of velocities (see Sect. 3.3).
In this paper we present the observational data of the three main far-infrared cooling lines and of the isotopic CO lines in Sect. 2. The absorption lines arising from foreground clouds, which have no physical connection with Sgr B2, are modeled in Sect. 3, where we try to disentangle the absorption due to the molecular cores from that due to the external layers of these clouds. We discuss these results and summarize them in Sect. 4 and 5 respectively.
2 Observations and Results
2.1 ISO observations of the C+ and O0 lines
Sgr B2 has been observed with the Long Wavelength Spectrometer (hereafter LWS; Clegg et al. 1996) on board the Infrared Space Observatory (hereafter ISO; Kessler et al. 1996), using the high resolution mode (AOT L03), within the guaranteed time program ISM_V. The whole LWS spectral range, from 47 to 196 m, was covered with 36 separate observations (Baluteau et al. in preparation). Each observation was carried out using a sampling interval of a quarter of a spectral resolution element with each data point repeated at least three times.
The LWS beam of approximately 80 was centered at , (J2000). At this position the beam encompasses the Sgr B2 (M) source but not the Sgr B2 North and South sources (following the nomenclature of Goldsmith et al. 1992). The peak of the far-infrared emission is found to be centered near the Sgr B2 (M), in the north-west direction, at a distance of 7 and 14 at 50 m and 100 m, respectively (Goldsmith et al. 1992). No significant difference in the far-infrared continuum emission is found when our observations are compared with other AOT L04 observations centered on Sgr B2 (M). We therefore consider hereafter that the major part of the far-infrared emission is included within the LWS field of view.
During each observation, in the L03 operating mode, one detector was selected as the ‘prime’ detector as its band pass filter included the wavelength range of interest. However, every detector still received some radiation if the combination of FP and grating settings were right. These detectors are known as ‘non-prime’ and often contain useful data that can complement the prime data.
The atomic oxygen fine structure line at 63.2 m was included in the prime observation carried out in ISO revolution 504 on 1997 April 3. The resolving power of the LWS short wavelength FP (FPS) at this wavelength was determined by interpolating between measurements made on the ground and in orbit and found to be R 6900. The [O I] 63.2 m line was also observed in non-prime observations between 1997 April 3 and April 5. Three observations covered the line entirely and two covered the edges and adjacent continuum. All these observations were performed using the LWS long wavelength FP (FPL) outside of its nominal wavelength range. FPL had a slightly lower resolving power at 63 m (R 5800) than FPS but achieved much better signal to noise ratio due to its better overall transmission. The prime and non-prime observations were calibrated and reduced using the same procedure as described in Polehampton et al. (2002).
Figure 1 presents the resulting spectrum at 63 m using L03 prime observations compared to the spectrum obtained by combining three prime observations in L04 mode during ISO revolutions 326 and 464. In the following, we will use the spectrum obtained in the L03 non-prime mode, whose systematic and random noise at line center is 2.5 times lower than in the L03 prime mode to study the [O I] 63.2 m line.
The [O I] line at 145.5 m and the [C II] line at 157.7 m were observed during ISO revolutions 476 (1997 March 6) and 507 (1997 April 6), respectively, as prime observations. There were no good observations of either of these lines on non-prime detectors. These data were reduced in the same way as the 63.2 m line prime observations. The resolution element of FPL from ground based measurement is 36 km s-1 and 34 km s-1 at 145 m and 158 m respectively. For the 63.2 m line non-prime observations the resolution is 52 km s-1. The instrumental profiles are represented by Airy profiles whose parameters are resolution dependent.
Figure 2 presents both the [O I] 63.2 m and 145.5 m lines together with the [C II] 157.7 m line toward Sgr B2 as observed with the ISO-LWS Fabry-Pérot. While the [O I] 145.5 m line is seen in emission, the [C II] 158.7 m line presents a deep absorption in its blue wing whereas the [O I] 63.2 m is totally absorbed over a large range of velocities.
2.2 IRAM 30-meter observations of 13CO and C18O
Molecular observations of Sgr B2 have been carried out in the 13CO (1 - 0) and (2 - 1) and C18O (1 - 0) and (2 - 1) lines in June 1997 at the IRAM-30 meters telescope (Pico Veleta, Spain). The Sgr B2 complex was mapped over the 80′′ LWS beam area with a beam size of 21′′ at 2.6 mm and 11′′ at 1.3 mm.
The spectra show a bright emission profile at the velocity of the HII region around 60 km s-1. Many molecular components appear at velocities between 120 km s-1 and 35 km s-1 in absorption in the central part of the map over a 30′′ 30′′ area, and in emission around. The clouds mapped in the LWS beam seem to be homogeneous and uniform as the emission components also have their counterparts in the absorption components. We averaged the spectra surrounding the 30′′ 30′′ area and replaced the central spectra by this average. We then convolved the resulting spectra with a gaussian weighting function to degrade the spatial resolution to 80′′ (ISO/LWS beam). The constructed spectra are shown in Figure 3. Up to ten velocity components are detected and their parameters, as derived from Gaussian fits, are listed in Table 1. The upper limits were derived following the relation:
| (1) |
assuming a gaussian profile, where is the line width of the 13CO or C18O (1 - 0) transition, RMS and are parameters of the observed spectrum. The emission component at 130 km s-1 represents the 175,13 184,14 transition of the SO2 molecule.
One molecular component at 76.0 km s-1 only appears in absorption in a 30′′ 30′′ area centered in the 13CO map at the coordinates of Sgr B2 (M), which means that the molecular cloud is not extended in the beam and/or has a low 13CO column density. This component, not listed in Table 1, is averaged over the central positions. It can be fitted by a gaussian with a 1.4 km s-1 line width and a line to continuum ratio of 0.6 for the 13CO (1 - 0) transition.
3 Modelling the C+ and O0 Absorption Features
3.1 The clouds along the line of sight to Sgr B2
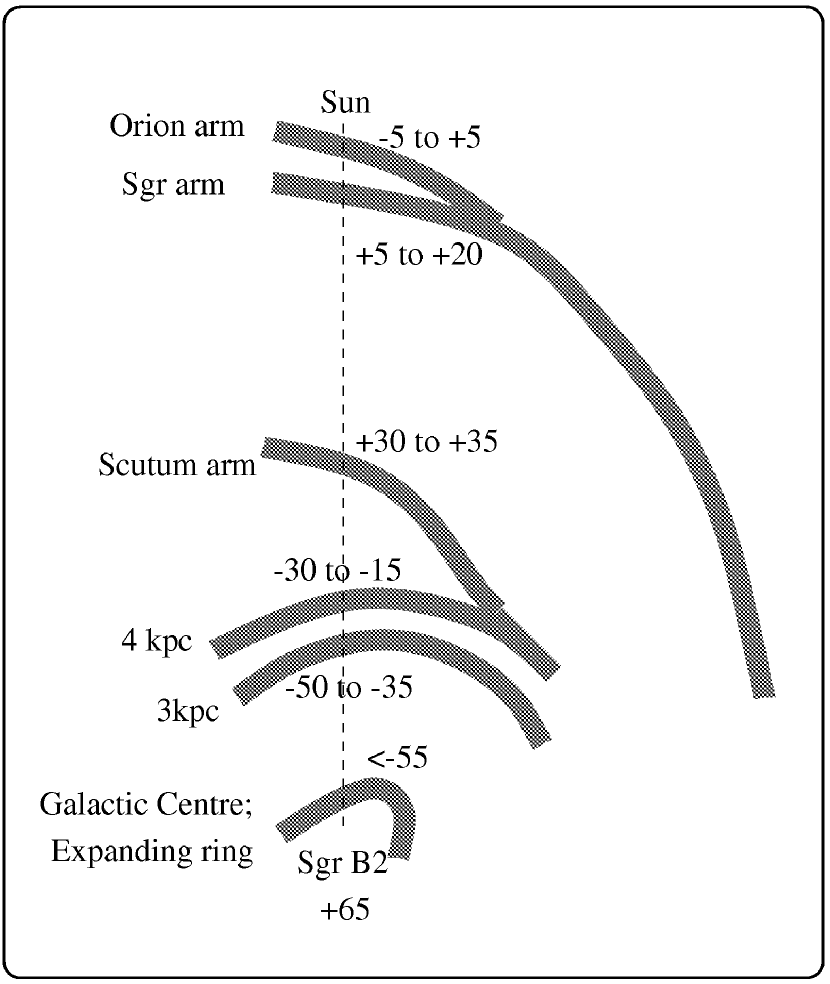
Individual absorbing clouds can be distinguished in the line of sight only if they have a unique radial velocity. For lines of sight away from the galactic center the distances to absorbing clouds at different central velocities should be estimated from the galactic rotation curve. However, material in the Galaxy rotates in orbits deviating from circular ones. Figure 4 presents a sketch of the proposed location of background sources and molecular clouds from Greaves & Williams (1994).
Due to the large number of velocity components toward Sgr B2, the determination of the location remains difficult and we will adopt, in the following, the Greaves & Williams schematic diagram, except for the component at a velocity around 0 km s-1. Under circular galactic orbits, any rotating clouds that cross the line of sight could contribute to the 0 km s-1 absorption and would be mixed with the absorption due to material within a few kpc from the Sun.
The clouds along the line of sight of Sgr B2 are expected to be illuminated by UV photons from the mean interstellar radiation field incident on their external layers ( = 1 - 10 in units of the standard interstellar flux of 1.6 10-3 erg s-1 cm-2, Habing 1968). Following the traditional schematic geometry of the photo-dissociation regions (Hollenbach & Tielens 1999), three different major layers can be distinguished in the study of these clouds from their surface to their core. Ionized carbon, atomic hydrogen and atomic oxygen coexist in the warm, mostly neutral, layer that lies at the surface on which the UV impinges. In the next (deeper) layer, where molecular hydrogen is able to resist photo-dissociation, ionized carbon and atomic oxygen still coexist. The third layer, which constitutes the cold self-shielded molecular core of the cloud, contains molecular hydrogen, carbon monoxide and atomic oxygen.
In the present study the [O I] absorption at 63.2 m is separated into two parts for each cloud: the absorption due to atomic oxygen present in the first two layers where C+ and O are coexistent (hereafter ”external cloud layers”) and that due to atomic oxygen in the cold molecular cores where O and 13CO are coexistent (hereafter ”internal molecular cores”).
3.2 The external cloud layers
3.2.1 H I observations
The diffuse atomic components are parametrized using observations of the H I 21 cm line seen in absorption toward Sgr B2 (M). These observations were performed by Garwood & Dickey (1989) using the VLA with a spectral resolution of 5 km s-1 after Hanning smoothing and a spatial resolution of . We re-fitted the absorption components in this spectrum as we found some errors in the fit parameters quoted by Garwood & Dickey (1989). All absorption features in the observed spectrum were fitted by Gaussians whose parameters are the central velocities (), the line widths (v(H I )) and the H I optical depths ((H I )). These parameters are listed in the three first columns of Table 2 for velocities between 110 and +10 km s-1. Higher velocities, corresponding to diffuse H I clouds associated with the Sgr B2 main complex, are not listed as our present study concerns only clouds along the line of sight to this complex.
3.2.2 The [C II] 157.7 m line
At velocities below , the [C II] 157.7 m line is seen in absorption toward Sgr B2 and in emission at larger velocities (Fig. 2). Before performing any modelling of the absorption feature, an estimate of the C+ emission component is required. The physical conditions prevailing in the external cloud layers, where C+ is the dominant part of the carbon, are assumed to be also valid for atomic oxygen where the [O I] 145.5 m line is emitted, due to the higher gas temperature found in these layers (Tielens & Hollenbach 1985). The [O I] 145.5 m line (Fig. 2) is well fitted with a Gaussian centered around , with an FWHM of , convolved with the instrumental profile. The fit compared to the observations is shown in Fig. 5. We will model the C+ emission component by adopting similar parameters as for the [O I] 145.5 m line.
The C+ absorption features are fitted by Gaussians whose centers and line widths are deduced from the H I 21 cm line parameters. This implies that the physical conditions of the layer where hydrogen is mainly atomic are also valid for the second layer where H2 is able to resist against photo-dissociation.
The absorption function used for the computations is defined by:
| (2) |
where Ic is the continuum flux and the optical depth function, , is defined by:
| (3) |
where is the optical depth at line center, is the wavelength at line center and is proportional to the width of the absorption lines.
The optical depth of each C+ absorption feature is adjusted in order to reproduce the observed spectrum when combined with the emission at 60 km s-1. The final fit of the 157.7 m line is shown in Fig. 6 after convolution of the spectrum with the instrumental profile of the LWS-FP at 158 m. Note that the fit at velocities above is not perfect, which is due to the lack of information at these velocities (see, e.g., Garwood and Dickey 1989). Another origin of this discrepancy could be due to the transient effects of the LWS detectors (Caux et al. 2002), not corrected in this data set. However, this has no implication for the following results since we are concerned with clouds at velocities lower than 10 km s-1.
The [C II] 157.7 m optical depth can be linked to the line width and to the C+ column density, for a given density and temperature (see, e.g., Crawford et al. 1985). For densities lower that 3.3 103 cm-3, a reasonable estimate of the C+ column density for all temperatures is:
| (4) |
where the line width v is in km s-1. The computed C+ optical depths and column densities are listed in Table 2 (columns 4 and 5, respectively) for each component seen in the H I observations.
3.2.3 The [O I] 63.2 m line
In the external layers, (as defined above), the major oxygen and carbon bearing species, in the gas phase, are O0 and C+. The variation of their abundances is poorly known at galactocentric distances lower than 5 kpc. The standard cosmic ratio O/C of 2.3 is used to compute the column density of atomic oxygen in the external layers of the clouds (Table 2, column 6). This standard ratio is obtained using the cosmic abundance compared to hydrogen in the gas phase of 1.4 10-4 for carbon (Cardelli et al. 1996) and 3.2 10-4 for oxygen (Meyer, Jura & Cardelli 1998). The total column density of atomic oxygen in the external layers of clouds at lower than 10 km s-1 is estimated to be 8.5 1018 cm-2.
Since the density in the external layers is believed to be low (generally less than 103 cm-3), we can safely assume that, in the absorbing region, the majority of oxygen atoms are in the ground state. Therefore the column density of atomic oxygen is directly proportional to the optical depth (Spitzer 1978) as follows:
| (5) |
| (6) |
where is the statistical weight of level , = 8.46 10-5 s-1 (Baluja & Zeippen 1988) is the Einstein coefficient, = 63.184 m, is the optical depth at line center and v(O0) is the full width at half maximum in km s-1 of the absorption line.
In the external part of the clouds, the absorption by atomic oxygen, parametrized by (O), is computed using the measured H I line width and the derived column density of atomic oxygen (see Table 2). Above 15 km s-1, due to the expected presence of an [O I] 63.2 m emission line around 60 km s-1 from the compact regions in the core of the Sgr B2 complex, the absorption by atomic oxygen in foreground clouds cannot be defined. Again, this has no implication on our results since we restrict our study to clouds with velocities lower than 10 km s-1. The resulting spectrum is then convolved with the instrumental profile of the LWS-FP at 63 m and compared to the observations (Fig. 7).
A clear result deduced from Fig. 7 is that an important fraction of the observed absorption cannot be accounted for solely by the external layers of the clouds at velocities lower than 10 km s-1. Therefore the contribution of the cold molecular cores to the atomic oxygen absorption can now be determined.
3.3 The internal molecular cores
Molecules that have been detected in foreground gas clouds not associated with Sgr B2 include H2CO (Mehringer, Palmer & Goss 1995), HCO+, HCN (Linke, Stark & Frerking 1981), C3H2 (Matthews & Irvine 1985), NH3 (Hüttemeister et al. 1993), CS, C34S, H13CN, H13CO+ and SiO (Greaves et al. 1992), CH (Stacey, Lügten & Genzel 1987), H216O and H218O (Neufeld et al. 2000). HCN (3 - 2), CS (2 - 1) and (3 - 2) absorption lines have been detected toward Sgr B2 indicating a cloud averaged n density close to 200 cm-3 and a kinetic temperature between 10 and 20 K (Greaves 1995).
From our 13CO and C18O observations, we derive the physical parameters of eight molecular cloud cores listed in Table 1 with velocities lower than 10 km s-1, using a standard LVG model described in Castets et al. (1990). The computations were performed in a restricted range of densities and temperatures taking into account the previous estimates through molecular observations. We used the 13CO, C18O (1 - 0) and (2 - 1) transitions to simultaneously compute the temperature, density and 13CO column density (columns 3, 4, and 5 of Table 3, respectively). We took into account the galactocentric gradient of 16O/18O and 12CO/13CO in the Galaxy as measured by Wilson & Rood (1994) and Langer et al. (1990, 1993). At a galactocentric distance lower or equal than 4 kpc, we adopted the values 12CO/13CO = 30 and 13CO/C18O = 6. The component near 0 km s-1 is not clearly attributed to clouds in the Sgr B2 complex or to a summation of clouds along the line of sight. In this case we used typical values for the local interstellar medium, i.e. 12CO/13CO = 60 and 13CO/C18O = 10. The kinetic temperature and density of the 76 km s-1 cloud cannot be computed through our LVG model with only the absorption component of the (1 - 0) 13CO transition. Nevertheless, one can estimate the 13CO column density in this cloud under the assumption of local thermodynamic equilibrium (LTE). Dickman (1976) has found that the column density of 13CO derived in LTE is accurate to within a factor of 2 for dark clouds. N(13CO) is estimated to be 4.8 1014 cm-2. For the other clouds, we estimate that using the LVG model, the uncertainty on the 13CO column density is lower than 20%. This value was computed taking into account the uncertainties on the best fit of the lines. For the 76 km s-1 cloud the uncertainty on the 13CO column density is accurate to within a factor of 2. The final column densities with their errors are presented in Table 3.
Assuming that the atomic oxygen in the cold molecular component is coexistent everywhere with 13CO, the line centers and the line widths should be the same for the two species. Combining the absorption due to both parts of the clouds (the external layers and the molecular cores), we can now find the best fit to the observed absorption by varying the O0 optical depth in each molecular core and convolving with the instrumental profile. The background Sgr B2 source is fitted by an emission component at 60 km s-1 for the present computations, corresponding to the observed position of the 13CO and C18O line emission (see Sect. 2.2). The resulting [O I] 63.2 m optical thickness and the corresponding atomic oxygen column densities, computed using Eq. 6, are reported in Table 3 in columns 6 and 7. The total atomic oxygen column density in the molecular cores along the line of sight to Sgr B2 is estimated to be 2.2 1019 cm-2 between 120 km s-1 and +10 km s-1, i.e. about three times more than that derived for the diffuse external parts of the clouds. Considering the number of parameters used in the computation of the atomic oxygen column density, the uncertainty is difficult to determine. Nevertheless, taking into account a 30% variation in the O0 linewidth and the combined systematic and random error of the LWS data, we estimate that the result cannot change by more than 50%.
The final result for the combination of the different layers of the clouds along the line of sight to Sgr B2 is shown in Figure 8. Additional clouds, responsible for absorption by atomic oxygen at velocities larger than 10 km s-1, were introduced only for the fit shown in this figure, but their parameters are not reported in Table 3 as they are clearly dependent on the assumed [O I] 63.2 m emission profile and they have no impact on the results of this present study.
The computed O0/13CO ratios in the nine molecular components along the line of sight of Sgr B2 are presented in column 8 of Table 3. In order to compare with the canonical value of for the O0/12CO ratio predicted by chemical models (e.g., Lee, Bettens & Herbst 1996), we took into account the variation of the isotopic ratio 12CO/13CO as function of the galactocentric distance. The O0/12CO ratio (column 9 of Table 3) then is found to range between 3 and 37. The uncertainties are presented in this table, taking into account the combined errors on the 13CO and atomic oxygen column densities.
4 Discussion
A total atomic oxygen column density of 3.1 1019 cm-2 is derived through the method developed in this paper, taking into account the diffuse and molecular parts of the clouds between 120 km s-1 and +6 km s-1. This value is consistent with the minimum column density of atomic oxygen computed by Baluteau et al. (1997) toward Sgr B2 of 1019 cm-2 using the LWS in its low resolution mode (grating).
As already discussed in Section 3.1, the traditional geometry of photo-dissociation regions imply that any cold molecular core should be associated with external layers, generally more diffuse and probably as halos, that can be observed through atomic H I absorption. We consider in the following that this association is effective when the velocity at which 13CO absorption occurs is within the observed line width of the H I absorption feature. Eight such “clouds” are found along the line of sight to Sgr B2, within the velocity range from 110 and +10 km s-1, and their properties are listed in Table 4. The cloud label, the H I and 13CO associated velocities and the estimated galactocentric distance (see Section 3.1) are given in columns 1 to 4.
For each cloud the derived ratio of the neutral oxygen column densities of the molecular cores to the whole cloud (external layers + molecular cores) is given in column 5. This ratio is indicative of the importance in mass of the molecular core(s) within each cloud. Two clouds (labelled B and E) are found not to be associated with any significant molecular core. As indicated in Section 3.3, the molecular cores along the line of sight to Sgr B2 provide an atomic oxygen column density about three times that due to the diffuse external layers of the clouds.
4.1 The C+/H ratio in the external layer of the clouds
The H I column densities of the diffuse atomic components seen along the line of sight to Sgr B2 (M) can be computed with the standard relation:
| (7) |
where (Tspin) is the H I spin temperature. Through observations of hydrogen absorption features in the direction of Sgr B2, Cohen (1977) derived the spin temperature of each absorbing cloud. However, the radio beam (13′ by 13′ angular resolution), is much too large compared to the ISO/LWS one, and their determination of the spin temperature cannot be used in our study. To derive an H I column density for each cloud along the line of sight to Sgr B2, in the range of velocities between 110 and +10 km s-1, we used a standard value of 150 K for the spin temperature (value well within the range derived by Cohen, 1977). The resulting H I column density is given in columns 6 of Table 4. The total column density of atomic hydrogen in the clouds listed in Table 4 is about 1.6 1022 cm-2.
Assuming that the standard ratio Av/N(H) = 5.3 10-22 cm-2 applies, we calculated that the clouds along the line of sight have a diffuse atomic hydrogen surface layer with Av between 0.1 and 4.4 (see column 7 of Table 4). It appears that the lower the galactocentric distance is, the lower the visual extinction of this layer is. This could be explained by the higher FUV interstellar radiation field encountered at smaller galactocentric distances, leading to a sharpening of the atomic H I layer as indicated by PDR models (Hollenbach & Tielens 1999). However, the identified H I clouds may be separated into several smaller clouds if they were viewed at higher resolution. The computed values of the visual exctinction in each of the identified clouds should be taken as an average value and cannot be significantly indicative of their characteristics.
The computed values for the C+ abundance compared to atomic hydrogen (column 8 of Table 4) in the cloud external layers are always found larger than the cosmic value in the gas phase of 1.4 10-4 (Cardelli et al. 1996), except in one case (cloud E at 52 km s-1). This is compatible with the picture of 2 external layers: the first one where C+ is coexistent with atomic hydrogen and the second one, deeper in the cloud, where C+ is coexistent with molecular hydrogen. The derived value of C+/H then provides a method to estimate the mass of the regions filled by C+ and H I (as the second layer was not included separately in the calculation). Assuming a C/H cosmic ratio valid for all the clouds, we found that the mass in the C+/H I and C+/H2 layers should be approximately the same, which is consistent with what is found for standard PDRs models (Hollenbach & Tielens 1999).
4.2 The C0 layer in the clouds
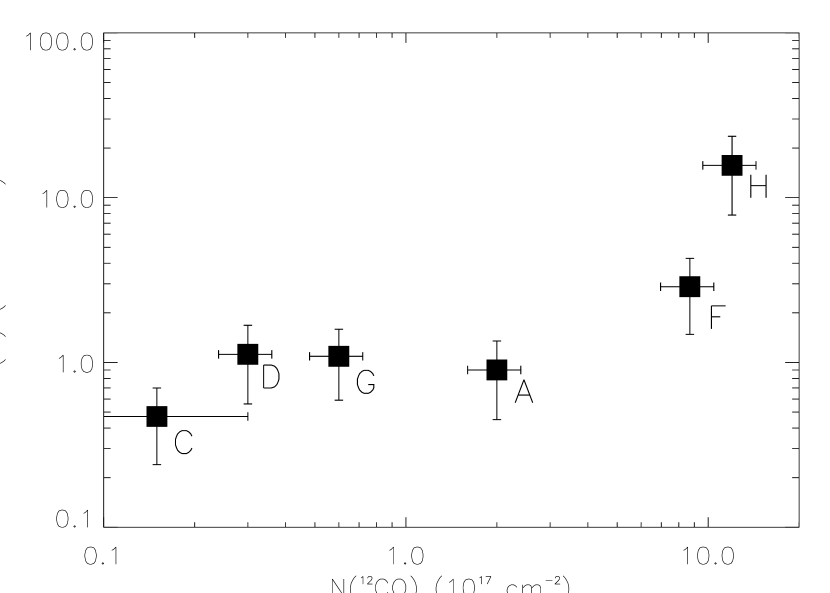
The O0 column densities of the six clouds exhibiting molecular core are plotted versus their CO column densities in Figure 9, with the assumption about the galactocentric variation of the 13C/12C ratio as given above. There is a clear linear correlation between N(O0) and N(CO), except for cloud H (at 1.7 km s-1) which is believed to result from a blending of clouds with uncertain galactocentric distances. We performed a linear least-square fit (N(O0) = a + bN(CO)) taking into account that both N(CO) and N(O0) data have errors. This method based on the minimization of the function leads to the estimation of the a and b parameters. The function is defined by:
| (8) |
where is the difference between the observed and fitted value of N(O0), and is the weighted sum of the variance in the direction of the smallest between each data point and the line with slope b. and are, respectively, the N(CO) and N(O0) standard deviation for the ith point. The resulting slope is 2.5 1.8 and the intersection point with the N(O0)-axis gives an excess amount of atomic oxygen with an average column density of (5.6 2.0) 1017 cm-2. This atomic oxygen in excess is interpreted as due to an intermediate layer between the C+ external layer and the CO core where the atomic oxygen coexist with the atomic carbon, as predicted by PDR models.
From theoretical PDR models, a layer of
neutral atomic carbon should exist near the surfaces of molecular clouds
or clumps within clouds where the UV interstellar radiation field
strikes these surfaces (e. g. Tielens & Hollenbach 1985) as part
of the C+/C/CO transition region. Observations by
Plume, Jaffe & Keene (1994) confirmed that the C0 emission
may arise from PDRs on the surfaces of the molecular clumps distributed
throughout the molecular cloud. As discussed in Tielens & Hollenbach
(1985) and Hollenbach, Takahashi & Tielens (1991), the column
density of neutral carbon is insensitive to the strength of the
external FUV field. Only the depth at which the C+/C/CO transition
occurs depends on the FUV field. This strengthens the case for having a
constant atomic carbon column density in all our clouds.
Using the cosmic O/C ratio introduced previously with our observations, we deduce
an average column density for atomic carbon in each cloud along the
line of sight to Sgr B2 of (2.4 0.9) 1017 cm-2.
This derived C0 column density, found in each cloud associated with a molecular core, is well within the range of values derived by Usuda et al. (in preparation) from C0 observations. Their first detection of the [C I] 3P1 - 3P0 absorption lines in the direction of Sgr B2 in the 10.6′′ beam of JCMT leads to an estimate of the C0 column density in five cloud complexes (clouds labelled here A, C, D, F and G) between 1 and 13 1017 cm-2.
A summary of previous measurements of the C0/CO ratio in galactic interstellar clouds is illustrated in Figure 9 of Usuda et al. (in preparation) where this ratio is plotted against the cloud visual extinction. The highest values of this ratio (between 2 and 20) are obtained in diffuse interstellar clouds (Federman et al. 1980) while the lowest values (ranging from 0.03 to 0.3) are found in dense photo-dissociation regions (Keene et al. 1985). The general slope of the C0/CO vs AV relation indicates that the column density of C0 is relatively constant in clouds with visual extinction greater than unity. Our derived values of the C0/CO ratio are consistent with this general relation; clouds C and D could be classified as diffuse clouds (e.g. Federman et al. 1980) where C0/CO = [16.2, 8.1], clouds A and G as translucent clouds (e.g. Stark & van Dishoeck 1994) where C0/CO = [1.2, 4.0] and cloud F as a dense cloud (e.g. Schilke et al. 1995; Maezawa et al. 1999) where C0/CO = 0.3.
Values for the C+/C0 ratio in the six clouds associated with a molecular core can be derived from this study. While clouds close to the galactic center (labelled A, C and D) yield a C+/C0 ratio less than 0.7, those at galactocentric distance of 3-4 kpc (F and G) have ratios close to 2.5. For G0/n 3 10-3 cm3, the C+/C/CO transition is drawn to the cloud surface (Kaufman et al. 1999) which could explain the low C+/C0 ratio ( 1) found near the galactic center.
4.3 The O0/CO ratio in the molecular cores
In the previous Section we provide observational arguments for the presence of
a neutral carbon layer, at the surface boundary of the molecular cores,
and give estimates of the column density of the associated neutral oxygen.
Therefore, the actual column density of neutral oxygen in the region where
CO is the major carbon reservoir can be derived, leading to a better
estimate of the true N(O0)/N(CO) ratio in the molecular clouds along
the line of sight to Sgr B2. However, because of the large uncertainties
still present a mean value, derived from the slope of the linear correlation between
N(O0) and N(CO) appears more relevant than individual values.
Taking into account the errors presented in
the previous section, it appears that the O0/CO ratio is lower than 4.3 and
larger than 0.7 with a best fit value of 2.5. It is in good agreement with the 1.8
value found by Goldsmith (2001: see his Table 3) taking into account a
molecular depletion in dark cloud cores. Furthermore, this value is within the same
range of magnitude than the values computed with standard models for dense interstellar
clouds in steady states (Lee, Bettens & Herbst 1996).
Our derived O0/CO ratio implies that 70% of gaseous oxygen is in the atomic form and not locked into CO in the molecular clouds along the Sgr B2 line of sight. The upper (respectively lower) limits of this ratio corresponds to 80% (respectively 40%) of the gaseous oxygen in the atomic form.
The value derived here should be compared to the lower
limit of 15 for the O/CO ratio obtained for molecular clouds along the
W49N HII region line of sight (Vastel et al. 2000). Note that the
[C II] 157.7 m profile of this source does not present any trace of
either emission or absorption components at the velocities of the
distant clouds. The physical and chemical characteristics of the
clouds in these two lines of sight seem very different and
cannot then be directly connected. Furthermore, the lack of information on the
intermediate neutral carbon layer in the clouds along the W49N line of sight leads
to slightly overvalue the O/CO ratio.
Considering the calculated uncertainties, we cannot directly determine the exact oxygen budget in these molecular clouds. However, only the lower limit on the O0/CO ratio is consistent with the predictions of steady states models and though we cannot exclude values as low as this (O0/CO 1), the probability of larger ratios is much higher. The oxygen chemistry in dense clouds is still not well known as it is very difficult to reproduce the O2 and H2O abundances limits measured by SWAS. Further observations of the O0, O2 and H2O species will provide important clues to constrain the chemistry in these cold molecular clouds.
4.4 Optical thickness of the C+ line
The [C II] fine structure transition at 157.741 m is the major coolant of the warm interstellar medium. Carbon is the fourth most abundant element and has a lower ionization potential (11.26 eV) than hydrogen. Therefore, carbon is in the form of C+ on the surface of far UV illuminated neutral gas clouds. In addition, the C+ line is relatively easy to excite, so that the line can efficiently cool the warm neutral gas. Depending on the density in this layer, the line may be self-absorbed. The first observational evidence of an absorption feature in the C+ spectrum has been carried out by the Kuiper Astronomical Observatory toward the W51 HII region (Zmuidzinas, 1987). The absorption feature in its profile was attributed to a separate “cooler” low density foreground cloud. Recently, studies of many bright galaxies showed that the [C II] 157.7 m line is deficient compared to the total FIR luminosity. Non detection or weak detection have been highlighted toward FIR bright galaxies (Stacey et al. 1991; Malhotra et al. 1997; Luhman et al. 1998). These observations were carried out at a much lower resolution than that used in our study of Sgr B2. Our results indicate that if these galaxies were viewed at high spectral resolution, the spectra could reveal both emission and absorption components present in the C+ profile. This strengthens the idea that under certain conditions the C+ line could be optically thick in the direction of large star-forming complexes or in the nuclei of galaxies.
5 Conclusion
Using [C II] 157.7 , [O I] 63.2 and 145.5 line observations, we were able to distinguish between the contributions of the different layers within the galactic clouds along the line of sight to Sgr B2. We separate the layers of the atomic diffuse surface and of the molecular core of these clouds. This is a major improvement over the previous analysis of this line of sight by Lis et al. (2001), which was based on observations of the [O I] 63 m line only. We were able to associate atomic oxygen with three layers through the clouds characterized by different forms of carbon in the gas phase, as predicted by standard PDR models: i.e. the major form of carbon changing from C+ to C0 and finally to CO.
From the line shape modelling presented here, a total column density of atomic oxygen in the line of sight to Sgr B2 of about 3.1 1019 cm-2 is derived within the clouds with velocities between 120 km s-1 and +10 km s-1. Less than 30 % of this total O0 column density is found to be due to the external layers of the clouds (where C+ is the major form of carbon).
The method used in this study leads to an estimate of the oxygen
content in the intermediate layer where C0 is the dominant form of
carbon. The atomic carbon column densities derived here for the
galactic clouds, with a mean value about 2.4 1017 cm-2,
are in good agreement with recent observations of the
[C I] 492 GHz line. The derived C0/CO ratios are indicative of
clouds, ranging from diffuse to dense,
along the line of sight of the Sgr B2 complex which have been
fragmented and illuminated by the galactic interstellar radiation field.
C+/C0 ratios close to 2.5 are derived for the clouds at galactocentric
distances of 3 - 4 kpc, and ratios less than 0.7 for clouds in the
galactic center region.
The method used to disentangle the different layers of the clouds in
the line of sight leads to the accurate computation of the O0/CO
ratio ( 2.5) in
the internal layers. Therefore, about 70% of gaseous oxygen is in
the atomic form and not locked into CO in the molecular clouds along
the Sgr B2 line of sight.
Future instrumentation will enable the present analysis to be improved. The
Herschel project, with its high spectral resolution (HIFI) capability, will
allow to better characterize the physical conditions of these clouds along
the line of sight to Sgr B2 (and maybe on other lines of sight in
direction of the galactic center as well), in particular from the C+
and C0 lines and from high J transitions of CO. SMA and ALMA will provide
high spatial resolution C0 observations of these clouds necessary
to separate each of them. At high spectral resolution, the
fundamental transitions of atomic oxygen will only be accessible to
the second instrument generation on board the SOFIA observatory.
References
- (1) Baluja, K.L., & Zeippen, C.J., 1988, J.Phys.B 21, 1455
- (2) Baluteau, J.P., Cox, P., Cernicharo, J., et al., 1997, A&A 322, L33
- (3) Cardelli, Jason A., Meyer, D., Jura, M., Savage, B., 1996, ApJ 467, 334
- (4) Castets, A., Duvert, G., Dutrey, A., et al., 1990, A&A 234,469
- (5) Caux, E., 2002, proceeding of “The Calibration Legacy of the ISO mission” held in Vilspa in 2001
- (6) Clegg, P.E., Ade, P.A.R., Armand, C., et al., 1996, A&A 315, L38
- (7) Cohen, R.J., 1977, MNRAS 178, 547
- (8) Crawford, M.K., Genzel, R., Townes, C., & Watson, D., 1985, ApJ291, 755
- (9) Dickman, R.L., PhD Thesis, 1976
- (10) Federman, S., Glassgold, A., Jenkins, E., Shaya, E., 1980, ApJ 242, 545
- (11) Garwood, R., & Dickey, J., 1989, ApJ 338, 841
- (12) Goldsmith, P., 2001, ApJ 557, 736
- (13) Goldsmith, P., Lis, D., Lester, D., & Harvey, P., 1992, ApJ 389, 338
- (14) Greaves, J.S., White, G.J., Ohishi, M., Hasegawa, T., & Sunada, K., 1992, A&A 260, 381
- (15) Greaves, J.S., & Williams, P.G., 1994, A&A 290, 259
- (16) Greaves, J.S., 1995, MNRAS 273, 918
- (17) Habing, H.J., 1968, Bull. Astron. Inst. Netherlands 19, 421
- (18) Hollenbach, D.J., Takahashi, T., and Tielens, A.G.G.M., 1991, ApJ 377, 192
- (19) Hollenbach, D.J., & Tielens, A.G.G.M., 1999, Reviews of Modern Physics, 71, 173
- (20) Hüttemeister, S., Wilson, T., Henkel, C. & Mauersberger, R, 1993, A&A 280, 255
- (21) Jacq, T., Walmsley, C, Henkel, C., et al., 1990, A&A 228, 447
- (22) Kaufman, M., Wolfire, M., Hollenbach, D., Luhman, D., 1999, ApJ 527, 795
- (23) Keene, J., Blake, G., Phillips, T.G., Huggins, P., Beichman, C., 1985, ApJ 299, 967
- (24) Kessler, M.F., Steinz, J.A., Anderegg, M.E., et al., 1996, A&A 315, L27
- (25) Kraemer, K., Jackson, J., & Lane, A., 1998, ApJ 503, 785
- (26) Langer, W., & Penzias, A., 1990, ApJ 357, 477
- (27) Langer, W., & Penzias, A., 1993, ApJ 408, 539
- (28) Lee, H.H., Bettens, R.P.M., & Herbst, E., 1996, A&AS 119, 111
- (29) Linke, R, Stark, A. & Frerking, M., 1981, ApJ 242, 147
- (30) Lis, D, Carlstrom, J., & Keene, J., 1991, ApJ 380, 429
- (31) Lis, D.C., Keene, J., Phillips, T.G., Schilke, P., Werner, M.W., & Zmuidzinas, J., 2001, ApJ 561, 823
- (32) Luhman, M., Satyapal, S., Fischer, J., Wolfire, M., et al., 1998, ApJ 504, L11
- (33) Maezawa, H., Ikeda, M., Ito, T., Saito, G., 1999, ApJ 524, 129
- (34) Malhotra, S., Helou, G., Stacey, G., Hollenbach, D., et al., 1997, ApJ 491, L27
- (35) Matthews, H. & Irvine, W., 1985, ApJ 298, 61
- (36) Mehringer, D., Palmer, P. & Goss, W., 1995, ApJSS 97, 497
- (37) Meyer, D., Jura, M., & Cardelli, J., 1998, ApJ 493, 222
- (38) Neufeld,D., Ashby, M., Bergin, E., et al., 2000, ApJ 539, L111
- (39) Plume, R., Jaffe, D., Keene, J., 1994, ApJ 425, 49
- (40) Polehampton, E., Baluteau, J.-P., Ceccarelli, C., Swinyard, B, Caux, E., 2002, A&A 388, L44
- (41) Poglitsch, A., Herrmann, F., Genzel, R., et al., 1996, ApJ 462, 43
- (42) Schilke, P., Keene, J., Le Bourlot, J., Pineau des Forets, G., Roueff, E., 1995, A&A 294, 17
- (43) Schulz, A., Guesten, R., Walmsley, C., & Serabyn, E., 1991, A&A 246, 55
- (44) Spitzer, L., 1978, In: Physical Processes in the Interstellar Medium, John Wiley & Sons
- (45) Stacey, G., Lügten, J. & Genzel, R., 1987, ApJ 313, 859
- (46) Stacey, G., Geis, N., Genzel, R., Lugten, J., et al., 1991, ApJ 373, 423
- (47) Stark, R., van Dishoeck, E., 1994, A&A 286, 43
- (48) Tielens, A.G.G.M., & Hollenbach, D.J., 1985, ApJ 291, 722
- (49) Vastel, C., Caux, E., Ceccarelli, C., Castets, A. et al., 2000, A&A 357, 994
- (50) Wannier, P., Kuiper, T., Frerking, M., Gulkis, S., et al., 1991, 377, 171
- (51) Wilson, T., & Rood, R., 1994, ARA&A 32, 191
- (52) Zmuidzinas, J., 1987, PhD Thesis


| vLSR(13CO) | 13CO (1 - 0) | 13CO (2 - 1) | C18O (1 - 0) | C18O (2 - 1) | FWHM |
|---|---|---|---|---|---|
| (km s-1) | Tmb (K) | Tmb (K) | Tmb (K) | Tmb (K) | (km s-1) |
| 113.6 | 0.11 | 0.09 | 0.04 | 0.13 | 4.3 |
| 104.8 | 0.38 | 0.13 | 0.03 | 0.10 | 7.5 |
| 57.8 | 0.18 | 0.27 | 0.07 | 0.21 | 1.6 |
| 46.2 | 0.78 | 0.12 | 0.17 | 0.27 | 3.0 |
| 41.0 | 1.27 | 0.28 | 0.25 | 0.06 | 4.2 |
| 25.8 | 0.14 | 0.23 | 0.06 | 0.17 | 2.4 |
| 20.6 | 0.19 | 0.10 | 0.06 | 0.17 | 2.7 |
| 1.7 | 0.73 | 0.25 | 0.03 | 0.07 | 15.0 |
| 22.7 | 0.30 | 0.10 | 0.06 | 0.06 | 2.1 |
| 33.3 | 0.51 | 0.23 | 0.04 | 0.13 | 4.5 |
| VLSR | v(H I ) | (H I ) | (C+) | N(C+) | N(O0) |
|---|---|---|---|---|---|
| (km s-1) | (km s-1) | (1017 cm-2) | (1017 cm-2) | ||
| 7.0 | 0.14 | 0.10 | 1.3 | 3.0 | |
| 14.0 | 0.13 | 0.08 | 1.5 | 3.5 | |
| 14.0 | 0.19 | 0.10 | 1.8 | 4.1 | |
| 7.0 | 0.3 | 0.10 | 0.9 | 2.1 | |
| 8.0 | 0.55 | 0.10 | 1.0 | 2.3 | |
| 8.0 | 1.1 | 0.60 | 6.2 | 14.3 | |
| 15.0 | 0.5 | 0.30 | 5.9 | 13.6 | |
| 11.5 | 1.4 | 0.50 | 7.5 | 17.3 | |
| 12.0 | 1.2 | 0.70 | 10.9 | 25.1 |
| Position | FWHM | T | n | N(13CO) | (O0) | N(O0) | O0/13CO | O0/12CO |
|---|---|---|---|---|---|---|---|---|
| (km s-1) | (km s-1) | (K) | (cm-3) | (1015 cm-2) | (1018 cm-2) | |||
| 4.32 | 10 | 200 | 1.7 0.3 | 0.3 | 0.27 0.13 | 159 | 5 | |
| 7.47 | 10 | 600 | 5.0 1.0 | 0.7 | 0.63 0.31 | 126 | 4 | |
| 1.40 | 0.5 | 1.7 | 0.47 0.23 | 940 | 31 | |||
| 1.60 | 10 | 200 | 1.0 0.2 | 3.3 | 1.12 0.56 | 1120 | 37 | |
| 2.96 | 10 | 300 | 6.0 1.2 | 1.8 | 1.12 0.56 | 187 | 6 | |
| 4.20 | 10 | 200 | 23.0 4.6 | 2.0 | 1.76 0.88 | 77 | 3 | |
| 2.44 | 10 | 200 | 1.0 0.2 | 1.0 | 0.51 0.25 | 510 | 17 | |
| 2.74 | 10 | 200 | 1.0 0.2 | 1.0 | 0.58 0.29 | 580 | 19 | |
| 14.97 | 15 | 300 | 20.0 4.0 | 5.0 | 15.72 7.86 | 786 | 13 |
| Cloud | external layers | molecular cores | RG | N(O0) ratio | N(H I ) | Av | C+/H | O0/12CO |
|---|---|---|---|---|---|---|---|---|
| label | VLSR (km s-1) | VLSR (km s-1) | (kpc) | core/total | (1020 cm-2) | (10-4) | ||
| A | 108 | 113.6/104.8 | 1 | 75% | 2.7 | 0.1 | 4.8 | 5 |
| B | 92 | 1 | 0% | 5.0 | 0.3 | 3.0 | ||
| C | 77 | 76 | 1 | 53% | 7.3 | 0.4 | 2.5 | 31 |
| D | 60.5 | 57.8 | 1 | 84% | 5.7 | 0.3 | 1.6 | 37 |
| E | 51.9 | 3 | 0% | 12.0 | 0.6 | 0.8 | ||
| F | 44 | 46.2/41.0 | 3 | 67% | 24.1 | 1.3 | 2.6 | 3 |
| G | 21.5 | 25.8/20.5 | 4 | 44% | 20.5 | 1.1 | 2.9 | 18 |
| H | 3.5/5.5 | 1.7 | ? | 79% | 83.4 | 4.4 | 1.7 | 13 |