Mass segregation in rich clusters in the Large Magellanic Cloud – III. Implications for the initial mass function
Abstract
The distribution of core radii of rich clusters in the Large Magellanic
Cloud (LMC) systematically increases in both upper limit and spread with
increasing cluster age. Cluster-to-cluster variations in the stellar
initial mass function (IMF) have been suggested as an explanation. We
discuss the implications of the observed degree of mass segregation in
our sample clusters for the shape of the initial mass function.
Our results are based on Hubble Space Telescope/WFPC2 observations
of six rich star clusters in the LMC, selected to include three pairs of
clusters of similar age, metallicity, and distance from the LMC centre,
and exhibiting a large spread in core radii between the clusters in each
pair.
All clusters show clear evidence of mass segregation: (i) their
luminosity function slopes steepen with increasing cluster radius, and
(ii) the brighter stars are characterized by smaller core radii. For all sample clusters, both the slope of the luminosity function in
the cluster centres and the degree of mass segregation are similar to
each other, within observational errors of a few tenths of power-law
slope fits to the data. This implies that their initial mass
functions must have been very similar, down to .
We therefore rule out variations in the IMF of the individual sample
clusters as the main driver of the increasing spread of cluster core
radii with cluster age.
keywords:
stars: luminosity function, mass function – galaxies: star clusters – Magellanic Clouds1 Introduction
The Large Magellanic Cloud (LMC) contains massive star clusters at all stages of their evolution, exhibiting a wide range of intrinsic physical properties. The focus of this paper is a detailed comparison among the stellar populations in six rich LMC star clusters, which were chosen in three pairs of similar age, mass, metallicity, and distance from the centre of the LMC, but exhibiting a large range in core radii. We have chosen pairs of clusters with very different core radii at the same age to test directly if variations in the initial mass function (IMF) are the cause of the systematic increase in both the upper limit and spread of the cluster core radii with increasing age seen in the rich clusters in the Magellanic Clouds (e.g., Mackey & Gilmore 2002 and references therein).
1.1 The distribution of LMC cluster core radii
In Fig. 1, we show the distribution of cluster core radii as a function of age in the LMC, using the most recent determination of these properties by Mackey & Gilmore (2002), based on a randomly selected sample of 53 LMC clusters observed with the Hubble Space Telescope (HST). These authors confirm the observational trend that the upper limits of the core radii systematically increase with cluster age, as previously discussed by Elson, Freeman & Lauer (1989b), Elson (1991, 1992), and van den Bergh (1994), based on smaller cluster samples observed from the ground. This trend reflects true physical evolution of the LMC cluster population, with some clusters experiencing little or no core expansion, while others undergo large-scale expansion due to some unknown process.
One possible explanation is cluster-to-cluster variations in the IMF (e.g., Elson et al. 1989b), and therefore different expansion rates of the clusters due to varying mass loss rates of the evolving stellar population (Chernoff & Weinberg 1990). However, the IMF slopes required to explain the largest core radii are too flat to allow these clusters to survive stellar mass loss beyond several yr (Elson 1991, Mackey & Gilmore 2002), while an increasing body of evidence points towards the universality of the IMF (see Gilmore 2001 for a review).
Alternative explanations for generating the largest core radii include the dynamical effects of the binary stellar population in the cluster, the merger of binary pairs of clusters (e.g., de Oliveira, Bica & Dottori 2000), and expansion due to tidal forces.
We will evaluate the observational evidence in terms of these core expansion mechanisms in Section 5.

1.2 Effects of mass segregation
Over the lifetime of a star cluster, encounters between its member stars gradually lead to an increased degree of energy equipartition throughout the cluster. The most significant consequence of this process is that the higher-mass cluster stars gradually sink towards the cluster centre and in the process transfer their kinetic energy to the more numerous lower-mass stellar component, thus leading to mass segregation.
The time-scale on which a cluster will have lost all traces of its initial conditions is, to first order, well-represented by its characteristic (half-mass) relaxation time, . The relaxation time-scale of a specific stellar species is directly related to its mean mass. Thus, significant mass segregation among the most massive stars in the cluster core, occurs on the local, central relaxation time-scale (comparable to just a few crossing times, depending on the stellar mass, see Bonnell & Davies 1998), whereas a time-scale is required to affect a large fraction of the cluster mass.
However, the time-scale for a cluster to lose all traces of its initial conditions also depends, among other factors, on (i) the smoothness of its gravitational potential or, equivalently, the number of stars (Bonnell & Davies 1998); (ii) the degree of energy equipartition reached (e.g., Hunter et al. 1995); and (iii) the slope of the mass function (MF; e.g., Lightman & Shapiro 1978, Inagaki & Saslaw 1985, Pryor, Smith & McClure 1986, Sosin 1997).
As the dynamical evolution of a cluster progresses, low-mass stars will, on average, attain larger orbits than the cluster’s higher-mass stars, and the low-mass stars will thus spend most of their time in the cluster’s outer regions, at the extremes of their orbits. For this reason alone, we would not expect to achieve global equipartition in a cluster (e.g., Inagaki & Saslaw 1985). In these outer parts, the cluster’s gravitational potential is weaker and constantly changing due to the ongoing redistribution of mass (Chernoff & Weinberg 1990), and it is more easily affected by the tidal field in which the cluster resides.
In these circumstances, two effects will enhance the mass segregation signatures observed in old, evolved clusters, (i) evaporation and ejection across the cluster’s tidal boundary of (preferentially) low-mass stars, because of their higher velocity dispersion and number density (Chernoff & Weinberg 1990, Giersz & Heggie 1997), and (ii) tidal stripping by the external gravitational field of the low-mass stars sent to the cluster’s outer regions by the relaxation process in the inner regions.
We will discuss the effects of the tidal field on a cluster’s degree of mass segregation in relation to its size in Section 5. In Section 2, we present our sample of six rich LMC clusters, for which we analyse the degree of mass segregation attained over their lifetimes in Section 4, based on the clusters’ luminosity functions (LFs) derived in Section 3.
2 Sample selection, observations and data reduction
2.1 Our LMC cluster sample
As part of HST GO programme 7307, we obtained WFPC2 imaging observations of the rich LMC clusters in Table 1, where we have also included a few of their basic properties. Their location in the (log(age) vs. ) diagram is indicated in Fig. 1. For a full overview of the clusters’ physical parameters, we refer the reader to http://www.ast.cam.ac.uk/STELLARPOPS/LMCdatabase/.
The clusters in our sample are among the richest in the LMC, and have masses . Half-mass radii are typically arcsec, and maximum radii arcsec. (At the distance of the LMC, kpc, 4 arcsec pc). Crossing times at the half-mass radius are years, and characteristic two-body relaxation times are years in the cluster core and years at the half-mass radius (Elson, Fall & Freeman 1989a, see also de Grijs et al. 2002a,b, hereafter Papers I,II, for NGC 1805 and NGC 1818). Our clusters are chosen with ages spanning this range, and should thus resolve the evolutionary processes that operate on each time-scale. They are paired in age to help discriminate between trends and coincidences (eg., in the [initial] MF, see Section 4), and each pair is at a similar distance (and if possible in a similar direction) from the centre of the LMC (both the geometrical centre [Bica et al. 1996], and the dynamical, rotation centre [see Westerlund 1990]), to minimise any differential effects of the tidal field of the LMC on the cluster’s evolution. They are also at the greatest possible distance from the LMC centre, where the effects of the tidal field are smaller, and stellar backgrounds are sparser. The total radial range occupied by our sample clusters ranges from about 3.5 to 5.5 degrees for the entire sample (out of the full radial range occupied by the LMC cluster sample from to degrees), with differences between the two clusters in each pair of less than a degree. Care was taken to avoid clusters exhibiting post-core-collapse (PCC) characteristics.
| Cluster | log(age) [yr] | Ref. | [Fe/H] (dex) | Ref. | log() | Ref. | (pc)a | Ref. | (deg)b | Ref. |
|---|---|---|---|---|---|---|---|---|---|---|
| NGC 1805 | 4,14 | 10 | 11 | 1,11 | 12 | |||||
| NGC 1818 | 2,4 | 10 | 11 | 1,11 | 12 | |||||
| NGC 1831 | 3,9 | 3 | 11 | 11 | 12 | |||||
| NGC 1868 | 6,12,13 | 13 | 11 | 11 | 12 | |||||
| NGC 2209 | 8,9,12 | 5,7 | 11 | 11 | 12 | |||||
| Hodge 14 | 6,8,13 | 13 | 11 | 11 | 12 |
Notes: a Based on distance moduli determined by Castro et al. (2001); b Distance from the LMC centre in degrees, w.r.t. the optical, geometrical centre (Bica et al. 1996), and the dynamical, rotation centre (see Westerlund 1990).
References: 1, paper I; 2, paper II; 3, Bonatto et al. (1995); 4, Cassatella et al. (1996); 5, Chiosi et al. (1986); 6, Elson et al. (1989a); 7, Frogel et al. (1990); 8, Geisler et al. (1997); 9, Girardi et al. (1995); 10, Johnson et al. (2001); 11, Mackey & Gilmore (2002); 12, Meurer et al. (1990); 13, Olszewski et al. (1991); 14, Santos et al. (1995)
2.2 HST/WFPC2 Observations
In this section, we will give a brief overview of the available WFPC2 data for the star clusters in our sample. This paper builds on the preparatory research by Santiago et al. (2001) for the entire sample, and is an extension of Papers I and II, which focused on mass segregation in the youngest pair of LMC clusters in our sample, NGC 1805 and NGC 1818.
We obtained WFPC2 exposures through the F555W and F814W filters (roughly corresponding to the Johnson-Cousins V and I filters, respectively) for each cluster, with the PC centred on both the cluster centre, and on its half-mass radius. Following Santiago et al. (2001), we will refer to these two sets of exposures as our CEN and HALF fields, respectively. For the CEN fields, we obtained both deep and shallow images. Exposure times for the former were 140s and 300s, respectively, for each individual image in F555W and F814W, while for the latter exposure times of 5s and 20s were used for the F555W and F814W filters, respectively. The shallow exposures were intended to obtain aperture photometry for the brightest stars in the cluster centres, which are saturated in the deeper exposures. For the HALF field, we obtained deep observations with a total exposure time of 2500s through each filter. At each position, for each set of deep and shallow exposures, and through both filters, we imaged our clusters in sets of 3 observations, to facilitate the removal of cosmic rays. The observations obtained for NGC 1805 and NGC 1818 were described in detail in Paper I; in Table 2 we present an overview of the observations obtained for the remaining LMC clusters in our sample.
| Object | Field | Filter | Exposure | RAa | Deca | Position | Date (UT) |
|---|---|---|---|---|---|---|---|
| time (s) | (J2000) | angle (∘)b | (dd/mm/yyyy) | ||||
| NGC 1831 | CEN | F555W | 3x5 | 05:06:16.502 | 64:55:06.391 | 90.86 | 25/07/1998 |
| 3x140 | |||||||
| F814W | 3x20 | 25/07/1998 | |||||
| 3x300 | |||||||
| HALF | F555W | 2x800 | 05:06:08.846 | -64:55:05.481 | 142.01 | 29/05/1998 | |
| 900 | |||||||
| F814W | 3x800 | 29/05/1998 | |||||
| 900 | |||||||
| NGC 1868 | CEN | F555W | 3x5 | 05:14:36.061 | 63:57:16.460 | 22.39 | 12/11/1998 |
| 3x140 | |||||||
| F814W | 3x20 | 12/11/1998 | |||||
| 3x300 | |||||||
| HALF | F555W | 2x800 | 05:14:36.025 | 63:57:34.112 | 153.09 | 20/05/1998 | |
| 900 | |||||||
| F814W | 3x800 | 24/05/1998 | |||||
| 900 | |||||||
| NGC 2209 | CEN | F555W | 3x5 | 06:08:35.135 | 73:50:12.084 | 145.97 | 29/03/1998 |
| 3x140 | |||||||
| F814W | 3x20 | 29/03/1998 | |||||
| 3x300 | |||||||
| HALF | F555W | 2x800 | 06:08:37.047 | 73:49:07.330 | 177.89 | 06/05/1998 | |
| 900 | |||||||
| F814W | 3x800 | 05/05/1998 | |||||
| 900 | |||||||
| Hodge 14 | CEN | F555W | 3x5 | 05:28:37.884 | 73:37:50.214 | 153.32 | 31/03/1998 |
| 3x140 | |||||||
| F814W | 3x20 | 31/03/1998 | |||||
| 3x300 | |||||||
| HALF | F555W | 2x800 | 05:28:33.458 | 73:38:08.567 | 164.91 | 04/05/1998 | |
| 900 | |||||||
| F814W | 3x800 | 04/05/1998 | |||||
| 900 | |||||||
a centre of the PC; b East w.r.t. North.
The pixel size of the WF and PC chips is 0.097 and 0.0455 arcsec, respectively, with a total combined field of view of roughly 4850 arcsec2 for the entire WFPC2 detector.
2.3 Initial data processing
To obtain the clusters’ luminosity functions (LFs) used in this paper we followed identical procedures as discussed in Paper I, based on the pipeline image reduction and recalibration of the WFPC2 images using the updated and corrected on-orbit flat fields and related reference files most appropriate for our observations.
As in Paper I, owing to the significant stellar density gradient across the cluster fields, completeness corrections are a strong function of position within a cluster. Therefore, we computed completeness corrections for all observations in circular annuli around the centre of each cluster, for both the PC and the WF fields, located at intervals between the centre and 3.6 arcsec, arcsec, arcsec, arcsec, arcsec and at radii arcsec for NGC 1831 and NGC 1868. The much sparser appearance of NGC 2209 and Hodge 14 allowed us to sample their completeness functions using only two radial ranges, for radii smaller and greater than 18 arcsec, respectively. The results of this exercise, based on the long CEN and HALF exposures, are shown in Fig. 2. These completeness curves were corrected for the effects of blending or superposition of multiple randomly placed artificial stars as well as for the superposition of artificial stars on genuine objects (see Paper I for a full discussion). The progressive increase in completeness fraction with radius for a given source brightness, in particular for NGC 1831 and NGC 1868, clearly illustrates the potentially serious effects of crowding in the inner regions of the clusters. In the analysis performed in this paper, we only include those ranges of the stellar LF where the completeness fraction is in excess of 50 per cent.

3 Luminosity functions
In the remainder of this paper, we will examine the dependence of the shape and slope of the stellar LF on position within the clusters. Since there is a one-to-one correlation between a cluster’s LF and its MF, we will use these terms interchangeably. However, in view of the uncertainties involved in the conversion of luminosities to masses (see Paper II for a detailed discussion), in this paper we will only use the LFs to reach our conclusions on the effects of mass segregation. This approach is therefore less model-dependent and leads to identical results, without having to keep in mind the large systematic uncertainties inherent to any luminosity-to-mass conversion (see Paper II).
Where the full 2-dimensional CMDs were used in the literature to infer the presence and the effects of mass segregation, this was mostly based on differences in the concentration of specific stellar types, most often main-sequence and giant branch stars. However, the cluster stars in our young and intermediate-age clusters start to saturate at the faint end of the red giant branch, so this approach is not feasible. In fact, with the exception of a handful of the brightest stars, in our cluster sample we are limited to the analysis of main-sequence stars between the main-sequence turn-off (MSTO) and the 50 per cent completeness limit.
First, we need to correct the observed stellar LFs in the CEN and HALF fields for the contribution of stars from the LMC background in these fields. We used the background field LFs described in Paper I (see also Castro et al. 2001) for this purpose. Thus, when we refer to the cluster LFs in the remainder of this paper, this applies to the background and completeness-corrected LFs. Foreground stars are not a source of confusion in the case of our LMC clusters, for , as already shown in Paper I. Since this is consistent with the standard Milky Way star count models (e.g., Ratnatunga & Bahcall 1985) and supported by the appearance of their CMDs, we extrapolate this result to the other four star clusters included in the present study.
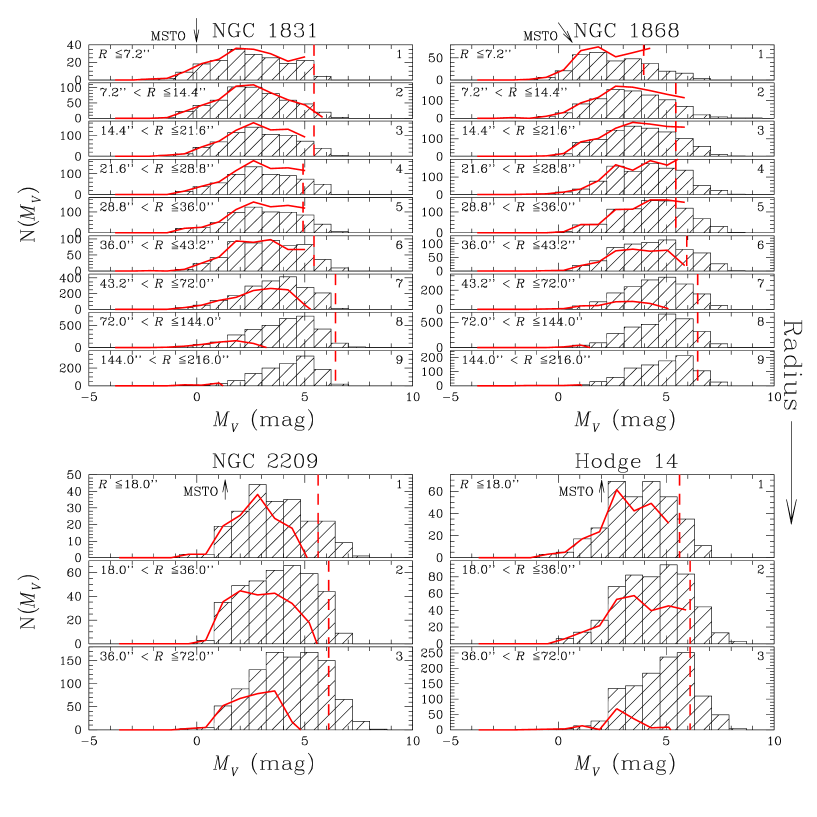
Fig. 3 shows the distribution of stellar magnitudes as a function of distance from the cluster centres. The shaded histograms represent the total number of stars in our final source lists, not corrected for incompleteness, area covered or background star contamination; the thick solid lines are the actual cluster star distributions, obtained by subtracting the background contribution expected in the area covered by each annulus from the observed total LFs and subsequently correcting for incompleteness effects. The 50 per cent completeness limits in each annulus are indicated by the vertical dashed lines through the centres of the last magnitude bin above this limit.
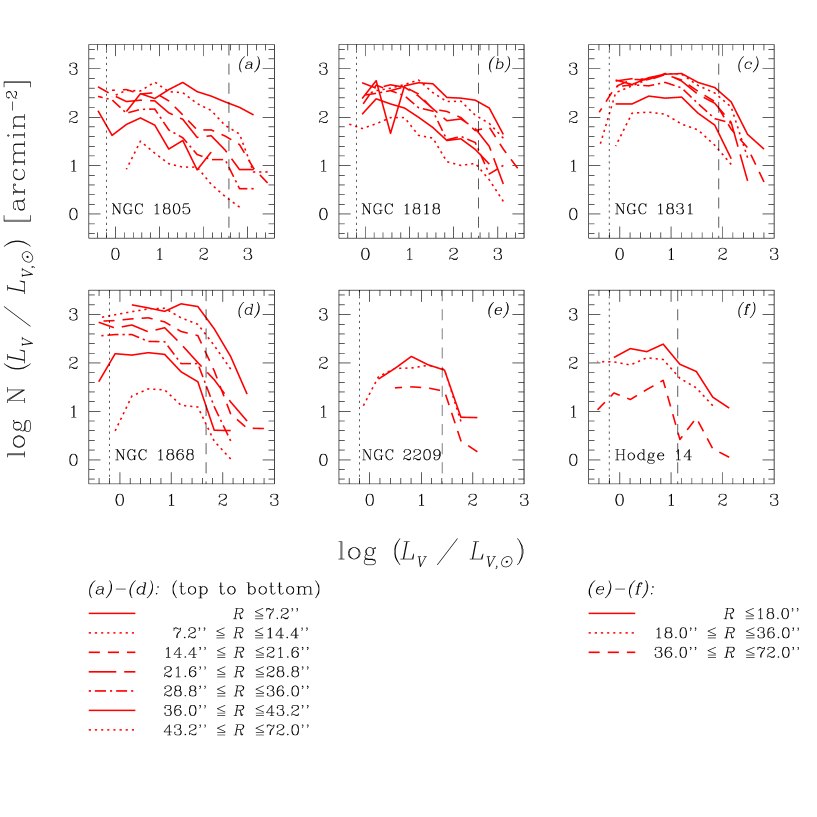
In Fig. 4 we show all annular cluster LFs out to arcsec, corrected for the effects of incompleteness (as a function of radial distance from the cluster centres), background contamination and for the sampling area covered by each (partial) annulus, for all of our sample clusters. In this representation, the radial dependence of the cluster LFs is more easily visible than in Fig. 3.
4 The slope of the luminosity function
We subsequently determined the LF slopes, assuming a simple power-law dependence for the number of stars of a given luminosity, i.e., , where is the LF slope. We realise, however, that the inner LFs in Fig. 4 show clear maxima inside our fitting ranges in most cases, and that the overall cluster LFs are clearly not linear.
Despite this, a comparison of LF slopes obtained using power-law fits over identical luminosity ranges is still valuable to quantify the radial dependence of the cluster LFs. We chose to use fitting ranges in luminosity that covered the maximum overlap among our annular LFs between the clusters in each pair, in order to minimise the effects of small-scale statistical fluctuations in the LFs. The results are shown in Fig. 5. For NGC 1805 and NGC 1818, we used the ranges ; for NGC 1831 and NGC 1868, ; and for NGC 2209 and Hodge 14, . These ranges correspond to the luminosity range between the faintest MSTO magnitude in each pair and the corresponding 50 per cent completeness limit. The radial ranges to which the data points apply are indicated by small bars at the bottom of each panel.

In all of our sample clusters the LF slopes clearly steepen with increasing cluster radius. This corresponds to clear mass segregation, the amount of which is sensitively dependent on the luminosity-to-mass conversion used (see Paper II). Although the trend towards steeper LFs with increasing radius is clear, the associated error bars are large. They are dominated by the non-linearity of the annular LFs and point-to-point variations.
Nevertheless, it is apparent from the comparison of the dependence of the LF slope as a function of radius (expressed in units of their core radii) between the clusters in each pair (right-hand panels of Fig. 5), that, within the uncertainties, this dependence is identical for both clusters in a given age pair.

In Fig. 6 we compare the dependence of the LF slope on cluster radius for all of our sample clusters. The LF slopes were determined over the largest possible common luminosity range, , i.e., from the MSTO of Hodge 14 to the 50 per cent completeness limit at . Surprisingly, we find that both the central LF slope and the degree of mass segregation of all sample clusters, as indicated by the gradient of the LF slope with radius, are confined within narrow ranges, at most spanning a range in parameter space. This is a robust result, and is indeed rather surprising in view of the large range in age (and therefore in dynamical state), mass, metallicity, and structural parameters (core radii) occupied by the ensemble of our sample clusters. We will discuss the implications of this result in more detail in Section 5.
Finally, we determined the dependence of core radius on the adopted luminosity (magnitude) range, as shown in Fig. 7. Core radii were derived based on fits to stellar number counts – corrected for the effects of incompleteness111We only used magnitude (mass) ranges for which the completeness fractions were at least 50 per cent. and background contamination – of the generalised fitting function proposed by Elson, Fall & Freeman (1987a), in the linear regime:
| (1) |
where and are the radial and central surface brightness, respectively, corresponds to the profile slope in the outer regions of the cluster, and .

For all of our sample clusters we clearly see the effects of mass segregation, in the sense that the brighter stars below the MSTO magnitude are increasingly concentrated towards the cluster centres (i.e., they are characterized by smaller core radii). In Table 3 we list, for stars below the MSTO, the core radii for each magnitude range for the oldest four sample clusters (for NGC 1805 and NGC 1818 these numbers were published in Paper II).
| Magnitude | NGC 1831 | NGC 1868 | NGC 2209 | Hodge 14 | |||||
|---|---|---|---|---|---|---|---|---|---|
| range | (central) | (pc) | (pc) | (pc) | (pc) | ||||
| 0.44 | 25.54 | 6.44 | 13.85 | 3.44 | |||||
| 0.30 | 30.39 | 7.66 | 15.69 | 3.90 | 51.68 | 11.93 | 44.89 | 10.86 | |
| 0.16 | 39.44 | 9.94 | 19.30 | 4.80 | 40.39 | 9.32 | 50.91 | 12.32 | |
| 0.09 | 43.79 | 11.04 | 21.52 | 5.35 | 60.66 | 14.00 | 45.99 | 11.12 | |
| 0.00 | 46.22 | 11.65 | 23.20 | 5.77 | 68.94 | 15.91 | 49.90 | 12.07 | |
The slightly larger scatter for NGC 1818, NGC 2209 and Hodge 14 is due to the smaller number of stars in each magnitude bin compared to the other clusters; for these three clusters the associated uncertainties are determined by a combination of the scatter in the derived core radii and background effects, while the uncertainties for the others are dominated by the effects of background subtraction. The upper limits for the core radii determined from the distribution of the brightest cluster stars () in NGC 1818, NGC 1831 and NGC 1868 are due to the combined effects of background corrections, small number fluctuations, and the radial sampling of the stellar distributions.
We have also indicated the core radii obtained from profile fits to the overall surface brightness profiles of the clusters. It is clear that these are dominated by the mass-segregated high-mass (bright) stars. It is also encouraging to notice that the core radii determined independently from the surface brightness profiles and those from the brighter cluster stars are internally consistent.
4.1 Comparison with previously published results
In Paper I, we compared our LF slopes as a function of cluster radius for NGC 1805 and NGC 1818 to previously published values, the most important of these being the preliminary analysis of our entire cluster sample by Santiago et al. (2001). In this section, we compare our results for the remaining four sample clusters to those of Santiago et al. (2001), to illustrate the sensitivity of a simple single-parameter LF fit to cluster star count data. The results of this comparison are presented in Figs. 8a, c, d and e. All of the adopted luminosity range, radial range, completeness range, and background subtraction affect an apparently robust result. For NGC 1831 we also compare our LF slopes to those obtained from Mateo (1988; Fig. 8b); for NGC 1868 and NGC 2209, Elson et al. (1999) published preliminary LFs at various cluster radii based on deep STIS observations. We will present a more detailed study of these STIS observations for all clusters in Beaulieu et al. (in prep.).

Since Santiago et al.’s (2001) published annular LF slopes were determined over a different magnitude fitting range than ours, we redetermined the slopes for both our LFs and those of Santiago et al. (2001) over the maximum common magnitude range available for each of our clusters (from the MSTO to our 50 per cent completeness limit), after converting Santiago et al.’s WFPC2 flight system magnitudes to the standard V-band system: (i) for NGC 1831, we used the range ( – Fig. 8a); (ii) for NGC 1868, ( – Fig. 8c); (iii) for NGC 2209, ( – Fig. 8d); and (iv) for Hodge 14, ( – Fig. 8e). The right-hand subpanels of these figures show the global LF slopes for each of the clusters; open circles are the results from our data, while the filled bullets are based on Santiago et al.’s (2001) published data points, for which we have also indicated the radial ranges used to obtain the annular LFs by horizontal bars at the bottom of each figure. We observe reasonable consistency between our results, within the associated fitting uncertainties, although a small discrepancy is seen in the outer regions, beyond arcsec for NGC 1868, as for NGC 1805 and NGC 1818 in Paper I. The comparison of LF slopes for NGC 2209 from our data and those obtained by Santiago et al. (2001) is marginally consistent. This is most likely due to the very sparse appearance of this cluster, which renders completeness and background corrections subject to large uncertainties.
In Fig. 8b, we also compare our LF slopes with those obtained from the cumulative LF of Mateo (1988). It is instructive to see that Mateo’s (1988) LF is significantly steeper than ours, which is most likely due to observational uncertainties, such as crowding, and blending of sources in his ground-based data.
5 Discussion
5.1 Mass dependence of the core radius – age relationship
The reduced spread in core radii for the younger LMC clusters could possibly be caused artificially if their luminosity profiles are dominated by a few high-luminosity, high-mass young stars. This would be a possible effect of mass-segregated stellar populations, which we know to be important already for the youngest clusters in our sample (see Papers I and II). Such luminosity profiles would not be representative of the dominant stellar population in the cluster, but constitute an anomaly. Therefore, in Fig. 9 we show the effect of considering only the lowest-mass stars in the observational LFs of our sample clusters, of mass . We see that the increase in upper limit and spread in core radius with increasing age is retained. The dynamical relaxation time-scale for a cluster core radius to grow by the amount observed in Fig. 9 for the stellar population in all of our clusters is significantly longer than their lifetimes, even for the oldest clusters (see, e.g., Paper II). Thus, we conclude that this effect of increasing upper limit and spread in core radius with age is real, and that we observe the signature of the initial conditions, at the time of formation of our sample clusters.

5.2 Core expansion due to mass loss and the universality of the IMF
A possible explanation offered for the increasing spread in physical cluster core radii with age between and yr (Fig. 1) was very large changes in the IMF; a change by 2 in the slope is required. Cluster-to-cluster variations in the IMF simulated using Fokker-Planck models (Elson et al. 1989a,b, Elson 1991) imply different expansion rates of the clusters due to varying mass loss rates of the evolving stellar population (Chernoff & Weinberg 1990). This rate of expansion of a star cluster is thus governed by its mass spectrum, i.e., by the MF slope, in the sense that clusters with flat MF slopes will have formed large fractions of high-mass stars, so that stellar winds, supernovae and other stellar ejecta would have caused an important change in the cluster binding energy. Mass-loss-induced cluster expansion will continue until a cluster overflows its Roche lobe and spills beyond its tidal limits, leaving a substantial halo of unbound cluster stars, which will eventually (on the time-scale of several orbital periods of the cluster about the LMC, on the order of yr; see Elson et al. 1987a) be stripped away by the tidal field of the cluster’s parent galaxy (e.g., Elson et al. 1987a, 1989a, van den Bergh 1991, Goodwin 1997). This may have partially happened already in NGC 1831 (Goodwin 1997).
However, Elson (1991) and Mackey & Gilmore (2002) point out that, while local, roughly Salpeter-type IMF variations seem to be able to explain the small scatter in the core radii around pc, the IMF slopes required to explain the largest core radii – which are roughly four times larger than the smallest core radii – are too flat (IMF slope ) to allow these clusters to survive self-disruption beyond yr. In addition, an increasing body of evidence points towards the universality of the IMF (see Gilmore 2001 for a review). Finally, detailed N-body simulations by Goodwin (1997), which include the effects of the expulsion of residual gas from a cluster, and considerations regarding the initial conditions of cluster formation and the resulting star formation efficiency (see also Elson et al. 1987a), also appear to be unable to produce a fourfold increase in the cluster core radii over their lifetimes, even if the star formation efficiency remains low throughout.
As shown in Fig. 5, both the change of the LF (or MF) slope with radius, and the absolute LF (MF) slopes between the two clusters in each of our cluster pairs of similar age are identical within the observational (and systematic) uncertainties. If there is such a thing as a universal IMF, then a minimal expectation would be that the younger LMC clusters, with no significant dynamical evolution, a wide range of stellar masses, and in some cases very similar metallicities, should have indistinguishable mass functions. This is supported by the very similar LF (MF) slopes as a function of radius for NGC 1805 and NGC 1818.
Moreover, Fig. 6 shows unambiguously, that this result also holds for all clusters in our sample, irrespective of their evolutionary state or core radius: both the central LF slope and the degree of mass segregation, as seen from the gradient of the LF slope with radius, are confined within narrow ranges, at most spanning a range in parameter space. While the intermediate result in Fig. 5 merely allowed us to conclude that the present-day MFs of the clusters in each pair must be very similar, the similarity of the degree of mass segregation and of the actual LF slopes in the inner cluster regions among all of our sample clusters implies that their initial MF must have been very similar, if not identical, within the uncertainties: after all, if the IMF in each cluster had been different, it seems highly unlikely that the MFs as a function of (core) radius of all of our clusters are currently so similar. This is yet another important result in favour of a universal IMF among star clusters of widely disparate properties.
Similarly, Elson et al. (1999) concluded from a pilot study of the LFs of NGC 1868 and NGC 2209 based on deep HST/STIS observations, that IMF variations do not appear to be responsible for the differences in core radii between these clusters.
Although we are strongly in favour of using LFs instead of their associated MFs, due to the large systematic uncertainties involved in the luminosity-to-mass conversions, we can still reach robust conclusions on the importance of the steepness of the MF slopes with respect to the Salpeter IMF slope for our sample clusters. In Paper II we converted the LFs of the two youngest clusters in our sample, NGC 1805 and NGC 1818, to present-day MFs. Although the effects of mass segregation in these clusters resulted in a radial dependence of the MF slope, the overall cluster slopes were found to be close to the generic Salpeter IMF slope, or perhaps slightly steeper, depending on the mass fitting range and luminosity-to-mass conversion used (for ; see Paper II). The result visualized in Fig. 6 indicates that the global present-day MF slopes for NGC 1831, NGC 1868, NGC 2209 and Hodge 14 are also similar to each other at masses down to , and are certainly not flatter than the higher-mass IMF slope. If we then assume that the main effect of mass segregation is a redistribution of the cluster stars, this implies that the initial MF of all clusters is closely represented by a Salpeter IMF.
This is consistent with the result of Mateo (1988), who concluded that the IMF slopes in the range from for six young and intermediate LMC star clusters, including NGC 1831, are remarkably similar to the Scalo (1986) IMF for field stars in the solar neighbourhood (see also Sagar & Richtler [1991], and Banks, Dodd & Sullivan [1995] for Salpeter-like MF slopes in LMC clusters).
The full range of variation in IMF slope allowed by our observations is a few tenths. By contrast, the models require an order of magnitude larger change in slope to explain the core evolution. We conclude that IMF variations in our sample clusters do not drive the core radius–age relationship.
5.3 The effects of a significant binary population
Alternatively, it has been argued that the spread in core radii towards greater ages might be due to the effects of a very large difference in the (unresolved) binary and multiple star population in these clusters. For young star clusters the optical/near-infrared CMDs often show a clear binary sequence parallel to the single-star main sequence (Hut et al. 1992, Elson et al. 1998, Johnson et al. 2001), for older clusters the main sequence becomes almost vertical, thus hiding a possible binary sequence.
For the LMC clusters in our sample, Chiosi (1989) argues that assuming a 30 per cent binary fraction for NGC 1831 yields a perfect match to the observed broadening of the CMD, in particular of the red giant branch. Elson et al. (1998) show for NGC 1818, that the binary fraction increases towards the cluster centre from per cent in the outer parts to per cent inside the core, with mass ratios . They argue that this increase is entirely consistent with predicted dynamical mass segregation effects, based on N-body calculations.
Binary stars play a dynamically important role in the evolution of star clusters (Elson, Hut & Inagaki 1987b, Hut et al. 1992, Meylan & Heggie 1997). Observations seem to show that all clusters have a substantial binary fraction, and that large cluster-to-cluster variations are not found. It is unlikely that the allowed variations of up to a factor of two can produce the roughly fourfold increase in core radii observed between the youngest and the oldest LMC clusters.
5.4 Merging binary clusters?
Finally, N-body simulations of encounters betweeen unequal-mass clusters (e.g., Rao, Ramamani & Alladin 1987, Barnes & Hut 1986, 1989, Rodrigues et al. 1994, de Oliveira, Dottori & Bica 1998) have shown that external effects, such as mergers and tidal disruption, are important processes in the dynamical evolution of binary clusters.
The observational evidence for (i) bumps, sharp shoulders and central dips in the radial surface brightness profiles of young and intermediate-age LMC clusters (including NGC 1818, e.g., Elson et al. 1987a, Elson 1991, Mackey & Gilmore 2002), (ii) the markedly non-zero ellipticity of some clusters with large core radii (e.g., NGC 1818 and NGC 1831; Sugimoto & Makino 1989, Elson 1991, de Oliveira et al. 2000), and (iii) the evidence for a constant or declining star formation rate, or – alternatively – multiple bursts of star formation within a single star cluster (e.g., Chiosi 1989) have led to the suggestion that these could simply be manifestations of merging binary (sub)clusters (e.g., Elson 1991, de Oliveira et al. 2000) or subunits within a single progenitor molecular cloud complex (e.g., Bhatia & MacGillivray 1988, Elson 1991). It is well known that interacting binary, presumably coeval cluster pairs are fairly common in the LMC (e.g., Bhatia, Cannon & Hatzidimitriou 1987, Bhatia & Hatzidimitriou 1988, Bhatia & MacGillivray 1988, Bhatia et al. 1991, Bica & Schmitt 1995, de Oliveira et al. 1998, 2000, Bica et al. 1999; see also Mackey & Gilmore 2002), which could merge on relatively short time-scales given suitable conditions (Bhatia 1990), possibly leading to significant core expansion. De Oliveira et al. (2000) show, based on N-body modeling, that the merger of an unequal-mass binary cluster pair can reach a stable state on time-scales as short as Myr, after which it can have attained a significantly different structure and ellipticity from the original main cluster.
NGC 1831 is one of the clusters with the largest core radii in our sample. De Oliveira et al. (2000) show that its structure is consistent with models of a merged system of binary clusters. In addition, NGC 1831 and NGC 1868 have peculiar CMDs (e.g., Chiosi 1989, Santiago et al. 2002), which can be interpreted as (i) the result of constant, continuously declining, or multiple bursts of star formation (e.g., Chiosi 1989), or (ii) having been caused by a merger of a binary cluster system (e.g., Chiosi 1989, Santiago et al. 2002): although binary clusters are likely fairly coeval, age differences of yr are not ruled out (Elson et al. 1987a, Chiosi 1989, and references therein).
De Oliveira et al.’s (2000) N-body simulations show that the merger of two clusters with a mass ratio of 10:1, with the less massive one orbiting the massive cluster on an elliptical orbit, will eventually lead to the disruption of the smaller cluster. The end product of such a merger is a single cluster, with the stars of the disrupted cluster forming a halo around the final cluster in the original orbital plane of the less massive cluster, while some are ejected from the system. Typically, in the absence of an external tidal field, per cent of the mass of the disrupted cluster member ( per cent of the total mass of the system) will be dispersed into the field, i.e. beyond the tidal truncation radius of the final cluster.
However, the number of true binary cluster candidates is far too small for this scenario to be very important.
6 Summary and Conclusions
In this paper, we have quantified mass segregation as a function of cluster core radius in a sample of LMC clusters in order to investigate the trend of the upper limit on the core radius of the LMC cluster system to increase with increasing cluster age. We discuss the implications of the observed degree of mass segregation for the shape of the IMF.
Our results are based on HST observations of six rich star clusters in the LMC, selected to include three pairs of clusters of similar age, mass, metallicity, and projected distance from the LMC centre, while we required the largest possible spread in core radii between the clusters in each pair.
We study the dependence of the shape and slope of the stellar LF on position within the clusters. Although there is a one-to-one correlation between a cluster’s LF and its associated MF, in view of the uncertainties involved in the conversion of luminosities to masses we only used the LFs to reach our conclusions on the effects of mass segregation. This approach is therefore less model-dependent and leads to identical, robust results, without having to keep in mind the large systematic uncertainties inherent to any luminosity-to-mass conversion.
All of our sample clusters show clear evidence of mass segregation, in the sense that (i) the LF (MF) slopes steepen with increasing cluster radius, and (ii) the brighter stars are increasingly concentrated towards the cluster centres (i.e., they are characterized by smaller core radii): while the effects of mass segregation are most clearly seen for stellar masses in the youngest sample clusters, NGC 1805 and NGC 1818, clear mass segregation is seen for the four older star clusters down from the MSTO magnitudes.
Although the trend towards steeper LFs with increasing radius is clear, the associated error bars are large, clearly reflecting the non-linearity of the annular LFs. Nevertheless, it is apparent from the comparison of the dependence of the LF slope as a function of radius between the clusters in each pair, that, within the uncertainties, this dependence is identical for both clusters in a given age pair. If there is such a thing as a universal IMF, then a minimal expectation would be that the younger LMC clusters, with no significant dynamical evolution, a wide range of stellar masses, and in some cases very similar metallicities, should have indistinguishable mass functions. This is supported by the very similar LF (MF) slopes as a function of radius for NGC 1805 and NGC 1818.
Moreover, we find that both the central LF slope and the degree of mass segregation of our sample clusters, as indicated by the gradient of the LF slope with radius, are confined within narrow ranges, at most spanning a few tenths in slope. This result is indeed rather surprising in view of the large range in age (and therefore in dynamical state), mass, metallicity and structural parameters (core radii) occupied by the ensemble of our sample clusters. While the intermediate comparison of the LFs of clusters within a given pair allowed us to conclude that the present-day MFs of the clusters in each pair must be very similar, the similarity of the degree of mass segregation and of the actual LF slopes in the inner cluster regions among all of our sample clusters implies that their initial MF must have been very similar, if not identical, within the uncertainties, down to masses of (depending on the luminosity-to-mass conversion adopted). This is yet another important result in favour of a universal IMF among star clusters of widely disparate properties.
We can thus firmly rule out variations in the IMF as the main driver of the increasing spread of cluster core radii as a function of increasing age in our cluster sample. We are currently investigating the evolutionary effects of the LMC tidal field on its star cluster population. The results of this analysis, based on -body simulations, will be published elsewhere (Wilkinson et al., in prep.).
Acknowledgments
This paper is based on observations with the NASA/ESA Hubble Space Telescope, obtained at the Space Telescope Science Institute, which is operated by the Association of Universities for Research in Astronomy (AURA), Inc., under NASA contract NAS 5-26555. This research has made use of NASA’s Astrophysics Data System Abstract Service.
References
- [] Banks T., Dodd R.J., Sullivan D.J., 1995, MNRAS, 274, 1225
- [] Barnes J.E., Hut P., 1986, Nat., 324, 446
- [] Barnes J.E., Hut P., 1989, ApJS, 70, 389
- [] Bhatia R.K., 1990, PASJ, 42, 757
- [] Bhatia R.K., Cannon R.D., Hatzidimitriou D., 1987, in Azzopardi M., Matteucci F., eds., ESO Conf. and Workshop Proc., Stellar Evolution and Dynamics in the Outer Halo of the Galaxy. ESO Publ., Garching, p. 489.
- [] Bhatia R.K., Hatzidimitriou D., 1988, MNRAS, 230, 215
- [] Bhatia R.K., MacGillivray H.T., 1988, A&A, 203, L5
- [] Bhatia R.K., Read M.A., Hatzidimitriou D., Tritton S., 1991, A&AS, 87, 335
- [] Bica E., Schmitt H., 1995, ApJS, 54, 33
- [] Bica E., Clariá J.J., Dottori H., Santos J.F.C., Piatti A.E., 1996, ApJS, 102, 57.
- [] Bica E., Schmitt H., Dutra C.M., Oliveira H.L., 1999, AJ, 117, 238
- [] Bonatto C., Bica E., Alloin D., 1995, A&AS, 112, 71
- [] Bonnell I.A., Davies M.B., 1998, MNRAS, 295, 691
- [] Cassatella A., Barbero J., Brocato E., Castellani V., Geyer E.H., 1996, A&A, 306, 125
- [] Castro R., Santiago B.X., Gilmore G.F., Beaulieu S., Johnson R.A., 2001, MNRAS, 326, 333
- [] Chernoff D.F., Weinberg M.D., 1990, ApJ, 351, 121
- [] Chiosi C., 1989, Rev. Mex. A&A, 18, 125
- [] Chiosi C., Bertelli G., Bressan A., Nasi E., 1986, A&A, 165, 84
- [] de Grijs R., Johnson R.A., Gilmore G.F., Frayn C.M., 2002a, MNRAS, 331, 228 (Paper I)
- [] de Grijs R., Gilmore G.F., Johnson R.A., Mackey A.D., 2002b, MNRAS, 331, 245 (Paper II)
- [] de Oliveira M.R., Bica E., Dottori H., 2000, MNRAS, 311, 589
- [] de Oliveira M.R., Dottori H., Bica E., 1998, MNRAS, 295, 921
- [] Elson R.A.W., 1991, ApJS, 76, 185
- [] Elson R.A.W., 1992, MNRAS, 256, 515
- [] Elson R.A.W., Fall S.M., Freeman K.C., 1987a, ApJ, 323, 54
- [] Elson R.A.W., Fall S.M., Freeman K.C., 1989a, ApJ, 336, 751
- [] Elson R.A.W., Freeman K.C., Lauer T.R., 1989b, ApJ, 347, L69
- [] Elson R.A.W., Hut P., Inagaki S., 1987b, ARA&A, 25, 565
- [] Elson R.A.W., Sigurdsson S., Davies M.B., Hurley J., Gilmore G.F., 1998, MNRAS, 300, 857
- [] Elson R.A.W., Tanvir N., Gilmore G.F., Johnson R.A., Beaulieu S.F., 1999, in Chu Y.-H., Suntzeff N., Hesser J., Bohlender D., eds., Proc. IAU Symp. 190, New Views of the Magellanic Clouds. Astron. Soc. Pac., San Francisco, p. 417
- [] Frogel J.A., Mould J.R., Blanco V.M., 1990, ApJ, 352, 96
- [] Geisler D., Bica E., Dottori H., Clarma J.J., Piatti A.E., Santos Jr. J.F.C., 1997, AJ, 114, 1920
- [] Giersz M., Heggie D.C., 1997, MNRAS, 286, 709
- [] Gilmore G., 2001, in Tacconi L.J., Lutz D., eds., Proc. Ringberg meeting, Starbursts: Near and Far. in press (astro-ph/0102189)
- [] Girardi L., Chiosi C., Bertelli G., Bressan A., 1995, A&A, 298, 87
- [] Goodwin S.P., 1997, MNRAS, 286, 669
- [] Hunter D.A., Shaya E.J., Holtzman J.A., Light R.M., O’Neil E.J., Lynds R., 1995, ApJ, 448, 179
- [] Hut P., et al., 1992, PASP, 104, 981
- [] Inagaki S., Saslaw W.C., 1985, ApJ, 292, 339
- [] Johnson R.A., Beaulieu S.F., Gilmore G.F., Hurley J., Santiago B.X., Tanvir N.R., Elson R.A.W., 2001, MNRAS, 324, 367
- [] Lightman A.P., Shapiro S.L., 1978, Rev. Mod. Phys., 50, 437
- [] Mackey A.D., Gilmore G.F., 2002, MNRAS, in press
- [] Mateo M., 1988, ApJ, 331, 261
- [] Meylan G., Heggie D., 1997, A&AR, 8, 1
- [] Meurer G.R., Cacciari C., Freeman K.C., 1990, AJ, 99, 1124
- [] Olszewski E.W., Schommer R.A., Suntzeff N.B., Harris H.C., 1991, AJ, 101, 515
- [] Pryor C., Smith G.H., McClure R.D., 1986, AJ, 92, 1358
- [] Rao P.D., Ramamani N., Alladin S.M., 1987, JA&A, 8, 17
- [] Ratnatunga K.U., Bahcall J.N., 1985, ApJS, 59, 63
- [] Rodrigues I., Rodriguez A., Schmitt H., Dottori H., Bica E., 1994, in Layden A., Smith R.C., Storm J., eds., ESO Conf. and Workshop Proc. 51, The Local Group: Comparative and Global Properties. ESO Publ., Garching, p. 216
- [] Sagar R., Richtler T., 1991, A&A, 250, 324
- [] Santiago B.X., Beaulieu S., Johnson R., Gilmore G.F., 2001, A&A, 369, 74
- [] Santiago B.X., Kerber L., Castro R., de Grijs R., 2002, MNRAS, submitted
- [] Santos Jr. J.F.C., Bica E., Clariá J.J., Piatti A.E., Girardi L.A., Dottori H., 1995, MNRAS, 276, 1155
- [] Scalo J.M., 1986, Fund. Cosmic Phys., 11, 1
- [] Sosin C., 1997, AJ, 114, 1517
- [] Sugimoto D., Makino J., 1989, PASJ, 41, 1117
- [] van den Bergh S., 1991, ApJ, 369, 1
- [] van den Bergh S., 1994, AJ, 108, 2145
- [] Westerlund B.E., A&ARv, 2, 29