COMPTEL upper limits for the 56Co -ray emission from SN1998bu
Supernova 1998bu in the galaxy M96 was observed by COMPTEL for a total of 88 days starting 17 days after the explosion. We searched for a signal in the 847 keV and 1238 keV lines of radioactive 56Co from this type Ia supernova. Using several different analysis methods, we did not detect SN1998bu. Our measurements should have been sensitive enough to detect 60Co gamma-rays as predicted from supernova models. Our flux limit is photons cm-2 s-1; this would correspond to 0.35 M⊙ of ejected 56Ni, if SN1998bu were at a distance of 11.3 Mpc and transparent to MeV gamma rays for the period of our measurements. We discuss our measurements in the context of common supernova models, and conclude disfavoring a supernova event with large mixing and major parts of the freshly-generated radioactivity in outer layers.
Key Words.:
stars: supernovae: individual: SN1998bu – Gamma-rays: observations – nucleosynthesis1 Introduction
Despite their widespread use as ’standard candles’, the physical nature of supernovae of type Ia is still not understood in terms of physical processes; therefore corrections of evolutionary aspects remain empirical (Branch, 1998; Niemeyer & Truran, 2000). Type Ia supernovae are believed to be caused by thermonuclear explosions of CO white dwarfs (Livio, 2000; Höflich & Khoklov, 1996; Nomoto et al., 1997). Radioactive energy of 0.5 M⊙ of 56Ni synthesized in such explosions is considered the driver of all types of observed light from these objects. The nearby SN1998bu supernova was a unique opportunity to directly measure gamma-rays from the 56Ni decay chain with the Compton Observatory.
The dynamics of a white dwarf explosion are difficult to model due to the range of scales involved in flame ignition and propagation (Iwamoto et al., 1999). Theories which are most successful in describing observations of type Ia supernovae include empirical components for key aspects. Observationally type Ia supernovae are a fairly homogeneous phenomenon (Branch, 1998), suggesting a narror range of synthesized 56Ni masses. Constraints from models of the bolometric light curve of type Ia supernovae imply that typically 0.3–0.5 M⊙ of radioactive 56Ni energy are needed(Höflich & Khoklov, 1996). Observations of the supernova light curve’s peak magnitude or of NIR lines of Fe[II] and Co[II] have mostly been used to derive 56Ni masses; the rather wide range of inferred 56Ni (0.1 – 1.14 M⊙)(Contardo et al., 2001) is difficult to understand if a single well-tuned process is held responsible for the supernovae of type Ia and in particular their ”standard candle” characteristics. Among different types of models, a rather wide range of 56Ni masses of 0.1 up to 0.8 M⊙ is discussed (see ‘Discussion’ section below).
Critical parameters of the explosion models are the ignition density of the white dwarf at its core, and the transition from the early deflagration stage (sub-sonic flame propagation) into a detonation (super-sonic flame propagation)(e.g. Leibundgut, 2000; Livio, 2000). The former is estimated from evolutionary models of the (uncertain) progenitor and the effective binary accretion rate, involving uncertain issues such as steady or flash-like nuclear burning of the accreted H and He material, or modulation of the accretion flow from the companion through the wind of the white dwarf (at the higher accretion rates required by the lower ignition densities preferred from otherwise excessive production of neutron-rich Fe group isotopes(Nomoto et al., 1997)). The acceleration of the flame speed can only be treated as a purely empirical parameter of models at present, but critically determines the final 56Ni mass and the Fe group to lighter element ratio (Iwamoto et al., 1999). Three-dimensional model treatments of this flame “micro-physics” is promising, but still a challenging problem (Reinecke et al., 1999).
The fact that type Ia supernovae are rather homogeneous (Branch, 1998) suggests a clear evolutionary path towards a well-definied presupernova star and a robust ignition condition. This led to the model of binary accretion of H and He rich matter onto a CO white dwarf at a well-tuned accretion rate such that H and especially He nuclear burning proceeds non-catastrophically and the white dwarf C mantle grows in mass until the Chandrasekhar mass limit is reached; the thermonuclear runaway explosion ensues from fast nuclear burning of Carbon ignited at the core due to heating from gravitational pressure and H and He shell-burning heat conduction (Nomoto, 1982). Sub-Chandrasekhar mass white dwarfs could also explode as type Ia supernovae (Livne, 1990): The merging of two white dwarfs would disrupt the lighter of the two into a C-O envelope accreting onto the more massive white dwarf (”double-degenerate” model). As the accretion proceeds to exceed the Chandrasekhar limit, the white dwarf ignites C centrally as above (Iben & Tutukov, 1984). There are some doubts if the merging process will avoid core collapse of the merged object and produce a thermonuclear supernova; e.g. transport of rotational energy is critical (Livio, 2000). Alternatively, a single-degenerate sub-Chandrasekhar model has been proposed: A He layer built up from accretion and steady hydrogen burning as above may ignite in a flash and thus send a shock wave into the white dwarf core, adding to the gravitational heat and thus also igniting carbon in the center for a lower-mass white dwarf (Nomoto, 1982; Livne, 1995). In this scenario much of the radioactive material would be produced towards the outside, resulting in different evolution of radioactivity-derived supernova light. Recent constraints on early spectra and the absence of intermediate-mass elements in the outer fast ejecta disfavor this scenario somewhat (Livio, 2000).
A deflagration model was recently favored for SN1998bu on purely spectroscopic arguments (Vinko et al., 2001). And the occurrence near or in a spiral arm and the observation of a light-echo (Cappellaro et al., 2001) may suggest that the progenitor system could be younger than those of the average type Ia supernovae, therefore anomalous and igniting at a particularly low density.
With such diversity of models and the difficulties of detailed physics modeling, observations of a variety of aspects of type Ia supernovae are a key to clarify the true nature of these events.
Observations of a large sample of supernovae in UV, optical and infrared bands have been made and discussed widely. But this radiation originates from driving processes deep inside the object, the bolometric light curve and its evolution reflect the supernova envelope structure, with much less information on the core. Spectral information tells us about material mixing and the total kinetic energy. However optical photons are created long after the initial explosion; most information from the early stage of the supernova event is lost. This makes it difficult to discriminate between different explosion models or model parameters.


Observations of -rays promise more direct information from the core of the supernova and the explosion mechanism. The radioactivity produced in the initial event decays and produces gamma-ray lines, which can be observed directly once the supernova is transparent to gamma-rays (after about 30-100 days). Even in the early stages, -rays from radioactivity will escape from outer layers, their intensity depending on ejecta mixing. Differences in the predicted -ray spectra have been suggested as the key observation to discriminate between models and the extent of mixing (Höflich et al., 1998; Pinto et al., 2001). This is best observed at early times; at times later than 30 days, differences in total 56Ni masses can mimic differences between sub- and Chandrasekhar models (Pinto et al., 2001).
The sensitivity of the -ray instruments on-board CGRO (OSSE and COMPTEL) limits the observations of type Ia supernovae to events within about 15 Mpc. To date, only one event, SN1991T, was marginally detected with COMPTEL (Morris et al., 1997). SN1998bu provides a second opportunity for line searches in type Ia supernovae. Some theoretical models predict -ray line fluxes well above the sensitivity limits of COMPTEL and OSSE for an assumed distance of 11 Mpc. Although COMPTEL lacks the spectral resolution to provide unique and decisive -ray line shape diagnostics, an independent proof of the radioactive 56Ni mass origin through detection of the corresponding -ray line fluxes was attempted, and is important given the complexity and unknowns of conversion of radioactive energy in a supernova envelope.
On May 9.9 UT in 1998 supernova SN1998bu was discovered in the galaxy M96 (NGC 3368) (Villi, 1998). From wide-band spectrograms it was classified as type Ia (Ayani et al., 1998; Meikle et al., 1998). From an earlier observation (Faranda & Skiff, 1998) and an estimate of the maximum blue light at 10952.7 0.5 TJD (i.e. May 19), Meikle et al. (1998) inferred the date of the explosion to be May 2.0 1.0 UT (i.e. TJD 10935 1). The distance to M96 had been known from HST Cepheid measurements as 11.3 0.9 Mpc (Hjorth & Tanvir, 1997), though another value of 9.6 0.6 Mpc had been derived from measurements of planetary nebulae (Feldmeier et al., 1997). SN1998bu appears to be a typical type Ia event (Jah et al., 1999), its reddening can be attributed to dust in the host galaxy. From its dereddened brightness it was concluded (using the methods described in Nomoto et al. (1997) and Iwamoto et al. (1999)) that the total ejected Ni mass was rather typical. A value of 0.77 M⊙ has been derived from analysis of the bolometric light curve (Leibundgut, 2000; Contardo et al., 2001).
2 Observations
The COMPTEL observations of SN1998bu began on TJD 10952, 17 days after the explosion. Due to this late start and to the low sensitivity of COMPTEL for low energies, we missed the opportunity to measure the decay lines of 56Ni (d) at 750 keV and 812 keV. 56Co, the daughter nucleus of 56Ni, has a mean life of d and decays to stable 56Fe. In this decay two -ray lines are emitted at 847 keV and 1238 keV. The COMPTEL observations spanned a total duration of 88 days, ending at TJD 11071, 136 days after the explosion.
The COMPTEL telescope detects -rays through a Compton scatter interaction in its upper plane of liquid-scintillation detectors (“D1”), followed by detection of another interaction in the lower plane of NaI(Tl) scintillation detectors (“D2”), ideally totally absorbing the scattered -ray. Imaging information is provided by the Compton scatter kinematics through energy deposit and interaction location measurements (For a detailed description of COMPTEL see Schönfelder et al., 1993).
3 Analysis and Results
To obtain a higher sensitivity at lower energies the observations were carried out in a “low-threshold” mode, where the energy thresholds of the D2 modules were reduced below the normal 600 – 700 keV range; the normal mode would have degraded the instrument response for the 847 keV photons. Two different analysis approaches were used: ”spectral” and ”imaging” analysis.
3.1 Spectral analysis
In this approach the full spectral response, i.e. the photo peak and the Compton tail, is exploited. Imaging parameters of the measurement are used for coarse field-of-view selection of the events. Only events with D2 energy deposits above 600 keV were used to avoid the 511 keV line background which originates from positrons. These result mainly from 22Na within the instrument, one of the major sources of instrumental background, which has its origin in activation of COMPTEL passing through the radiation belts (Weidenspointner et al., 2001).
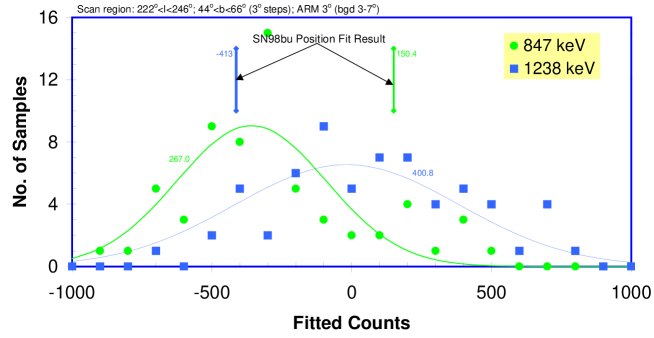
Spectra were derived for a FWHM beam on a grid around the SN position with a grid spacing of . Fig. 1 shows an example for the direction covering the SN position. The beam size was chosen through the selections of events from within a wide range around the pivot direction, performed near the cone-shaped response in the COMPTEL data space. Background spectra were constructed from the same direction, selecting a ring-like wide region around the same pivot direction. Background-subtracted spectra were then analyzed for the relevant Co decay lines (see Fig. 1). Gaussian-shaped lines with instrumental resolution are fitted to the data to determine line intensities. This analysis and in particular the background determination may include unknown systematic effects that could mimic lines. To account for these uncertainties (in addition to the statistical uncertainties), we determined the variance of the fitted line intensities across our measured sample empirically: We histogrammed the fitted line intensities from all spatial grid points and used the width of this distribution to estimate uncertainties and significances, for both -ray lines of interest (see Fig. 2). The exposure and effective detector area were used to convert line intensities and uncertainties into source photon flux units.
No significant difference between the spectra of the supernova and off-supernova positions was found. We obtained a upper flux limit of photons cm-2 s-1 for the 847 keV line and photons cm-2 s-1 for the 1238 keV line.
3.2 Imaging analysis
In this analysis the imaging capability of COMPTEL was fully exploited, thus increasing the sensitivity of the instrument mainly in the 847 keV line due to a better background suppression. In the “low-threshold” observing mode most of the D2 detector thresholds are well below the 847 keV line of interest. However, there is a considerable spread of thresholds, the lowest value being 450 keV. In standard COMPTEL analysis, event selection with D2 energy deposits above 650 keV is applied, to simplify the modular composition of the instrument response function. This is now inappropriate, and response function composition and usage is more complex, as a price for the improved 847 keV sensitivity. For the upper detector plane D1, all modules have hardware thresholds in a narrow range at or below 50 keV, thus still allowing the use of a homogeneous analysis threshold at 50 keV for all D1 detectors.

Instrument imaging response functions were derived for our analysis from simulations, where each D2 module was treated with its effective hardware threshold. The full-instrument data were analyzed in two different ways: We first used a summed response function for both lines, but for the 847 keV line we also analyzed separately for “mini-telescopes” and composed the individual results.
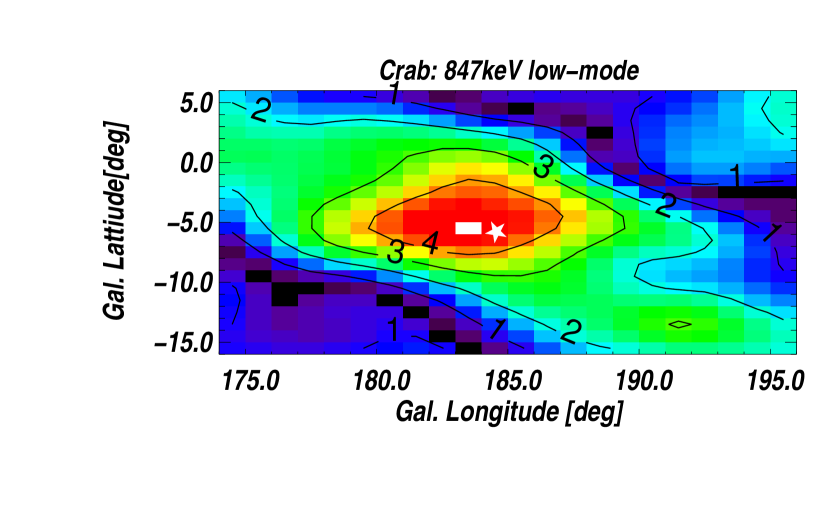
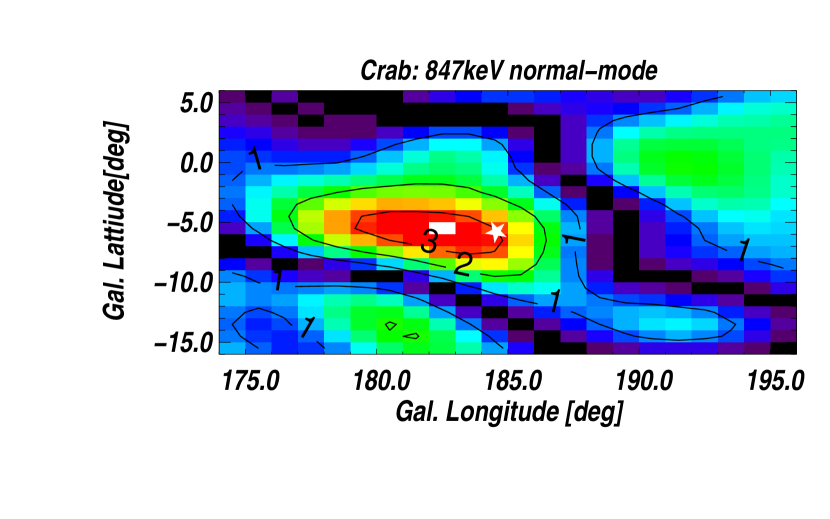
We demonstrate the difference between standard analysis and our more complex “low-energy-threshold-mode” response function on 3 days of Crab low-threshold data, fortuitously collected during an observation of Geminga. Using the low-mode response we clearly detect Crab with 4.5 at 847 keV, compared to only 3.0 with the standard response (see Fig. 3). For the 1238 keV line the values are 1.6 and 0.63, respectively. This shows that most D2 modules are now sensitive below the 650 keV analysis threshold used for the standard analysis, resulting in a larger sensitivity mainly for the 847 keV line.
Unfortunately, due to the strong background line at 511 keV, we did not obtain the theoretically-achievable sensitivity at the 847 keV line. To reduce the impact of this background via its scattering pattern, we applied a cut of 400 in the angle between the incident and the scattered -ray (the so-called angle (see Schönfelder et al., 1993)). This sacrifices a fraction of source events.
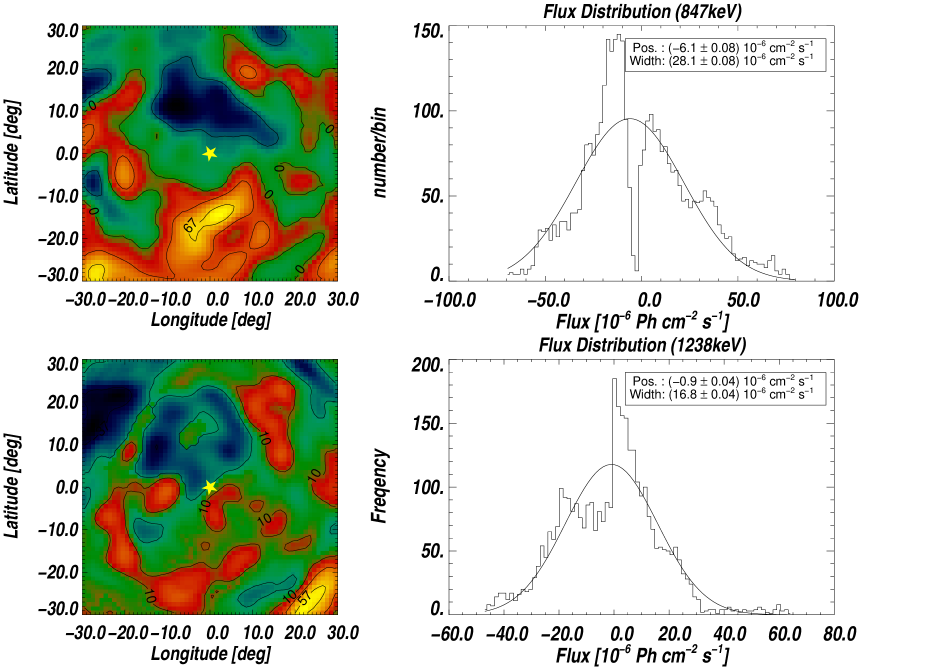
Using these simulated summed responses and the cut, maps for the two -ray energies (shown on the left side in Figure 4) are produced through a maximum-likelihood method. There is no detectable signal from the supernova.
For determination of an upper limit on the flux in the -ray lines we estimated statistical and systematic uncertainties. In a histogram of flux values for all pixels in the maps of Fig. 4, the flux variances provide a global measure of the uncertainty. Using the Bayesian method described in Georgii et al. (1997), which accounts for the systematic and statistical uncertainties, 2 upper limits of photons cm-2 s-1 for the 847 keV line and of photons cm-2 s-1 for the 1238 keV line were determined. The less constraining limit for the 847 keV line is a result of the cut for background suppression.

Therefore another analysis method was applied to the 847 keV line, only. Here separate maximum-likelihood imaging of the SN1998bu region was made for each mini-telescope (the combination of one single D2 module with all D1 modules) by applying the specific response for each D2 module. With energy cuts at 650 keV, but no cut, 511 keV background suppression retains better 847 keV sensitivity than above. Since the likelihood values are additive (probabilities) we combined these results to derive a 2 upper limit of photons cm-2 s-1 (see Fig. 5).
3.3 Summarizing the results
From the imaging analysis we obtain a 2 upper limit of photons cm-2 s-1 for the 847 keV line and photons cm-2 s-1 for the 1238 keV line. Spectral analysis yields photons cm-2 s-1 for the 847 keV line and photons cm-2 s-1 for the 1238 keV line, respectively. The reason for the different values for both lines in the spectral analysis lies in the steep decrease of the background with the energy. In contrast, in imaging analysis the background on the sky around the source is not much different for both lines.
The analysis presented here was based on the assumption that the emitted lines are narrow. This is justified because of the energy resolution of COMPTEL (about 88 keV for the 847 keV and about 110 keV for the 1238 keV line). However, due to the velocity of the expelled matter, the lines are broadened and even shifted (only shortly after the explosion) by the Doppler effect (see Höflich et al. (1998); Isern (1997)). An analysis of the expected degradation of the upper limits yields for a persistent Doppler broadening of the 1238 keV line of 10 000 km/sec (Höflich et al., 1998), an increase of the upper limit flux by 12 % compared to the narrow-line assumption. This changes the flux upper limits only marginally and we therefore neglected it.
4 Discussion
To compare -ray upper limits with theoretical Ni mass predictions, the distance to the SN plays an essential role. The host galaxy M96 had a HST-Cepheid-determined distance of 11.6 0.9 Mpc (Tanvir et al., 1995), later revised to 11.3 0.9 Mpc by Hjorth & Tanvir (1997). This makes SN1998bu one of seven SN observed in galaxies with a distance set by Cepheid measurements. We adopt this distance of 11.3 Mpc for our analysis.
A second key factor is the transparency of the supernova to -rays. This is a key issue determining how much radioactive energy is converted into kinetic energy and supernova light. The maximum of the optical light curve (about 10 days after the explosion) is set by a maximum of the product of (declining) energy deposition and (rising) -ray energy escape (Pinto and Eastman, 2001). Furthermore, the Compton scattering optical depth to 1 MeV -rays is below unity beyond about 50 days after explosion (Pinto et al., 2001), but absorption corrections to observed line -rays are probably significant for typical models up to about 100 days after explosion (see e.g. Fig. 11 in Höflich et al., 1998, calculated for energies down to 10 keV, however). This illustrates clearly the importance of -ray measurements with high spectral resolution and at those early times, in order to directly address the explosion mechanism: the line shapes and the ratio of the different line intensities from the 56Ni decay chain can reveal the ratio between deposited and directly radiated radioactive energy (e.g. Höflich & Khoklov (1996)).
For illustrative purposes and simplification, we may simply assume as an extreme case that the supernova was transparent for our observation of the gamma-rays from 56Co decay over days 17-136 with emphasis on the late part; in this case we directly convert our flux limits into 56Co (and therefore original 56Ni) masses. Our lowest upper limit for the 1238 keV line of photons cm-2 s-1 then constrains the visible 56Ni mass to below 0.35 M⊙. If we then want to reconcile this with the 0.77 M⊙ of total 56Ni determined bolometrically (Leibundgut, 2000), more than half of the -ray energy would be deposited in the supernova over this time window. We therefore do have to look in detail at the energy deposition efficiency around peak optical luminosity and/or effectiveness of -ray escape soon thereafter.
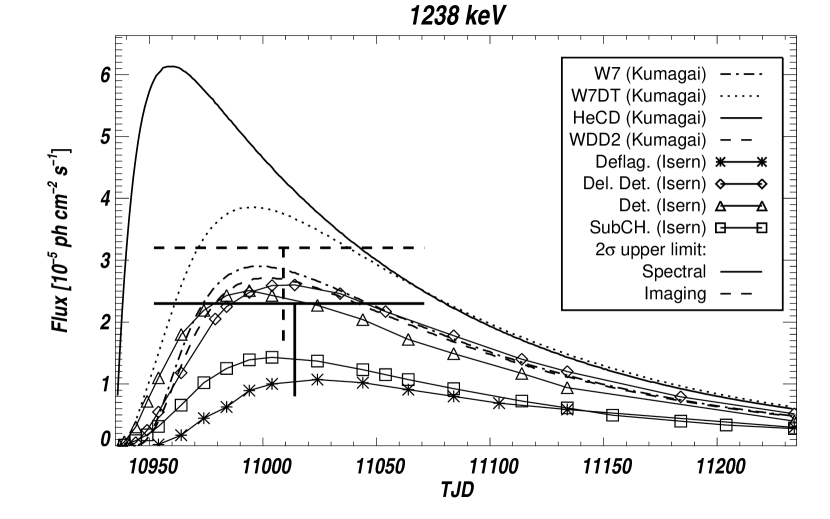
For several model classes (detonation, delayed detonation, and sub-Chandrasekhar), -ray light curves have been calculated through detailed Monte-Carlo photon transport in the expanding supernova (Höflich et al., 1998; Kumagai, 1998; Isern, 1997; Pinto et al., 2001). Considerable variety in the gamma-ray flux by factors up to 5 arises from the different explosion models, envelope structures, and photon transport treatments employed in such calculations. In Fig. 6, expected -ray light curves for a few typical models (Isern, 1998; Kumagai, 1998) are shown, re-scaled for a distance of 11.3 Mpc. In Table 1 we list the 56Ni mass for each of these models, together with time-averaged fluxes over the observation time for each -ray line. We see that the predicted 56Co -ray flux does not follow the straightforward scaling to the amount of 56Ni, the explosion mechanism and the envelope photon transport determine the time-dependent -ray fluxes. For the same type of explosion model, predicted 56Ni masses vary within a factor of two: For the delayed-detonation class of models, values between 0.55 M⊙ and 0.96 M⊙ have been published (Iwamoto et al., 1999; Woosley and Weaver, 1991; Isern, 1997), as a result of differences in the point at which the initially-slow nuclear burning (deflagration) is assumed to turn into a detonation. This typical intrinsic variability within an explosion type of a factor of two, which directly translates into the -ray flux scaling, indicates the systematics which typically remains, within an explosion type. In fact, any of the SNe Ia scenarios (sub-Chandrasekhar, deflagration, delayed detonations, and pulsating delayed detonation models) has been shown to be capabable to produce a wide variety of 56Ni masses ranging from 0.1 to 1 M⊙ (e.g. Nomoto et al. (1984); Höflich & Khoklov (1996); Höflich et al. (1998)).
On the other hand, Fig. 6 illustrates that, for approximately the same amount of total 56Ni, pure deflagration or detonation models are about a factor of two dimmer in -rays, while the sub-Chandrasekhar model with substantial 56Ni sitting further outside reaches a -ray flux about twice as large as the typical delayed-detonation model.
| Model | 56Ni mass | I105 | I105 |
|---|---|---|---|
| [M⊙] | [ph cm-2s-1] | [ph cm-2s-1] | |
| W7111Kumagai (1998) | 0.58 | 4.2 | 3.0 |
| W7DTa | 0.77 | 5.8 | 4.1 |
| HeCDa | 0.72 | 8.2 | 5.5 |
| WDD2a | 0.58 | 3.9 | 2.8 |
| Deflag.222Isern (1998) | 0.50 | 1.5 | 1.0 |
| Del. Det.b | 0.80 | 4.3 | 2.7 |
| Det.b | 0.70 | 4.0 | 2.7 |
| SubCH.b | 0.60 | 2.7 | 1.5 |
In Table 1 we also list the time-averaged 56Co -ray fluxes of each model, together with our 2 upper limits. Our SN1998bu flux limits are well below the ”HeCD” and the ”W7DT” model predictions for both lines. The ”W7”, ”WDD2”, delayed detonation and detonation model fluxes are marginally consistent with our flux limits, while the fluxes predicted from the sub-Chandrasekhar model and the deflagration model are consistent with our limits for both line energies at the adopted distance.
This comparison illustrates that with a 56Ni mass in the ”typical” range derived for SN1998bu, around 0.7-0.8 M⊙ (Leibundgut, 2000), we should have seen 56Co -rays at least due to those models which turn more rapidly from deflagration into detonation (W7DT) or partially-produce radioactivity in their outer ejecta (HECD). Yet, within Chandrasekhar-type models of the presently-favored type of a delayed transition from deflagration into detonation, a total 56Ni mass as high as about 1 M⊙ may still be consistent with our measurement.
At a distance of 9.6 0.6 Mpc (Feldmeier et al., 1997) based on planetary nebulae (PN) all models would be inconsistent with our 1238 keV and 847 keV flux limits, indicating either this distance is incorrect (see (Maoz et al., 1999) for a discussion on a possible correction in the distance ladder scale) or that model treatments generally overestimate the 56Ni masses.
It will require time-resolved measurements of the -ray flux (hence a brighter / more nearby supernova or a more sensitive instrument), or exploitation of spectral-shape details as promised by the spectrometer aboard INTEGRAL (see discussion in Isern, 1997), to decide among explosion models from gamma-ray line measurements alone.
Acknowledgements.
The COMPTEL project is supported by the German government through DLR grant 50 QV 90968, by NASA under contract NAS5-26645, and by the Netherlands Organization for Scientific Research (NWO).References
- Ayani et al. (1998) Ayani, K., Nakatani, H., Yamaoka, H., IAU Circ. No, 6905, 1998.
- Branch (1998) Branch D., ARA&A, 36, 17–55, 1998.
- Bravo et al. (1993) Bravo, E., Dominguez, I., Isern, J, et al., A&A 269, 187–194, 1993.
- Cappellaro et al. (2001) Cappellaro, E., Patat, F., Mazzali, P. A., et al., ApJ 549, L215–L218, 2001.
- Contardo et al. (2001) Contardo G., Leibundgut B., Vacca W.D., A&A 359, 876–886, 2000.
- Faranda & Skiff (1998) Faranda ,C. and Skiff, B.A., IAU Circ. No. 6905, 1998.
- Feldmeier et al. (1997) Feldmeier, J.J., Ciardullo, R. and Jacoby, G.H., ApJ 479, 231–243, 1997.
- Georgii et al. (1997) Georgii, R., Diehl, R., Lichti, G., et al., Proc. 2nd INTEGRAL workshop, ESA SP-382, 51–54, 1997.
- Hjorth & Tanvir (1997) Hjorth, J. and Tanvir, N.R., ApJ 482, 68–74, 1997.
- Höflich et al. (1998) Höflich P., Gerardy C. L., Fesen R. A., Sakai S., ApJ 568, 791, 2002
- Höflich et al. (1998) Höflich, P., Wheeler, J.C. and Khokhlov, A., ApJ 492, 228–245, 1998.
- Höflich & Khoklov (1996) Höflich, P., and Khokhlov, A., ApJ 457, 500, 1996.
- Iben & Tutukov (1984) Iben I. Jr., and Tutukov A.V., ApJS 54, 335, 1984.
- Isern (1997) Isern, J., Gòmez-Gomar J., Bravo E., Jean P., ESA-SP-382, 89, 1997
- Isern (1998) Isern, J., private communication, based on (Isern, 1997; Bravo et al., 1993)
- Iwamoto et al. (1999) Iwamoto,K., Brachwitz, F., Nomoto, K., et al., ApJS 125, 439–462, 1999.
- Jah et al. (1999) Jha,S. ,Garnavich, P.M., Kirshner, R.P., et al., ApJS 125, 73–79, 1999.
- Leibundgut (2000) Leibundgut B., Astr.Astroph.Rev. 10, 179-209, 2000.
- Livio (2000) Livio M., in ”Type Ia Supernovae: Theory and Cosmology”, eds. Niemeyer J.C. and Truran J.W., Cambr. Univ. Press, p 33–48, 2000.
- Livne (1990) Livne E., ApJ 354, L53–L55, 1990.
- Livne (1995) Livne E., Arnett D., ApJ 452, 62–74, 1995.
- Kumagai (1998) Kumagai, S., private communication, based on (Kumagai and Nomoto, 1997).
- Kumagai and Nomoto (1997) Kumagai S. and Nomoto K., in ”Thermonuclear Supernovae”, eds. R. Canal, P. Ruiz-Lapuente and J. Isern, p 515.
- Maoz et al. (1999) Maoz, E., Newman, J.A., Ferrarese, L., et al., Nat. 401, 351–354, 1999.
- Meikle et al. (1998) Meikle, P., Hernandez, M., Fassia, A., IAU Circ. No, 6905, 1998.
- Morris et al. (1997) Morris, D.J., Bennett, K., Bloemen, H., et al., Proc. of the 4th Compton Symposium, AIP Conf. Proc. 410, 1084–1088, 1997.
- Niemeyer & Truran (2000) Niemeyer J.C. and Truran J.W. (eds.), ”Type Ia Supernovae: Theory and Cosmology”, Cambr. Univ. Press, 2000.
- Nomoto et al. (1997) Nomoto, K., Iwamoto, K., Nakasato, N., et al., Nucl. Phys. A621, 467–476, 1997.
- Nomoto et al. (1984) Nomoto, K., Thielemann F.-K., Yokoi K., ApJ 286, 644–658, 1984.
- Nomoto (1982) Nomoto, K., ApJ 253, 798–810, 1982.
- Pinto et al. (2001) Pinto, P.A., Eastman, R.G. and Rogers, T., ApJ. 551, 231–243, 2001.
- Pinto and Eastman (2001) Pinto, P.A., and Eastman, R.G., T., New Astr. 6, 307–319, 2001.
- Reinecke et al. (1999) Reinecke M., Hillebrandt W., Niemeyer J.C., A&A 347, 739–755, 1999.
- Schönfelder et al. (1993) Schönfelder, V., Aarts, H., Bennett, K., et al., ApJS 86, 657–692, 1993.
- Tanvir et al. (1995) Tanvir, N.R., Shanks, T., Ferguson, H.C., Robinson, D.R.T., Nature 377, 27–31, 1995.
- Villi (1998) Villi, M., IAU Circ. No. 6899, 1998.
- Vinko et al. (2001) Vinko, J., Csak, B., Csizmadia, Sz., et al., A&A 372, 824–832, 2001.
- Weidenspointner et al. (2001) Weidenspointner, G., Varendorff, M., Oberlack, U., et al., A&A 368, 347–368, 2001.
- Woosley and Weaver (1991) Woosley S.E., Weaver T.A., Les Houches Lecture Notes, eds. J. Audouze et al. (Amsterdam:Elsevier), 1991.