The ELAIS Deep X-ray Survey I:
Chandra Source Catalogue and First Results
Abstract
We present an analysis of two deep (75 ks) Chandra observations of the European Large Area ISO Survey (ELAIS) fields N1 and N2 as the first results from the ELAIS deep X-ray survey. This survey is being conducted in well studied regions with extensive multi-wavelength coverage. Here we present the Chandra source catalogues along with an analysis of source counts, hardness ratios and optical classifications. A total of 233 X-ray point sources are detected in addition to 2 soft extended sources, which are found to be associated with galaxy clusters. An over-density of sources is found in N1 with 30% more sources than N2, which we attribute to large-scale structure. A similar variance is seen between other deep Chandra surveys. The source count statistics reveal an increasing fraction of hard sources at fainter fluxes. The number of galaxy-like counterparts also increases dramatically towards fainter fluxes, consistent with the emergence of a large population of obscured sources.
keywords:
surveys - catalogues - X-rays: general - X-rays: galaxies - X-rays: diffuse background - X-rays: galaxies: clusters - galaxies: active - quasars: general1 Introduction
The results of recent deep X-ray surveys reveal that almost the entire X-ray background can be resolved into discrete sources. The ROSAT Deep Survey (Hasinger et al. 1998) resolved 70 - 80% of the 0.5 - 2 keV background at a flux level of 1 erg s-1 cm-2. Observations with Chandra and XMM-Newton are now pushing the detection limits even further. In particular, the unprecedented resolution of Chandra allows extremely deep observations that are not limited by source confusion. This has been exploited in the Chandra Deep Fields (North, Brandt et al. 2001, and South, Giacconi et al. 2002). In the Chandra Deep Field-North 2 Msec of data has been accumulated reaching a flux limit of erg s-1 cm-2 in the 0.5 - 2 keV band (Barger et al. 2003). However, the greatest advances have been at higher energies where Chandra is now beginning to resolve the 2 - 8 keV background.
The majority of sources resolved by ROSAT were found to have spectra that were too steep to account for the flat spectrum of the hard X-ray background. However towards fainter fluxes a new population emerged in the ROSAT data with intrinsically harder X-ray spectra (Hasinger et al. 1993, Almaini et al. 1996). Chandra is now uncovering a large number of hard spectrum sources, and the majority of the 2 - 8 keV background has been resolved. Over the flux range 2 to 10-13 erg s-1 cm-2 the contribution of resolved sources to the 2 - 8 keV background is 1.1 erg s-1 cm-2 deg-2 (Cowie et al. 2002). This translates to 65 - 85 per cent of the background as measured by Vecchi et al. (1999, Beppo-Sax) and Ueda et al. (1999, ASCA) respectively.
Early spectroscopic observations are finding a majority of the sources with hard X-ray spectra to be type II AGN, indicated by the presence of narrow lines (Tozzi et al. 2001, Barger et al. 2001a, Hornschemeier et al. 2001). Most of these are found at . However, a considerable fraction of the hard X-ray sources are optically faint, probably due to obscuration, and provide challenging targets for spectroscopic identification. Sources identified as type I AGN display softer X-ray spectra and are observed to have a higher median redshift.
There are still a number of unanswered questions relating to the properties of the hard X-ray populations at longer wavelengths. AGN with large X-ray absorbing columns do not always appear as type II AGN in the optical (e.g. Maiolino et al. 2001, Willott et al. 2002). The relationship between gas and dust absorption in AGN remains unclear. It is also uncertain where the absorbed radiation may be re-radiated. Approximately 7 per cent of X-ray sources in the Chandra Deep Field North are sub-millimetre sources (Barger et al. 2001b), however whether this is the result of reprocessed nuclear emission or due to a starburst component, is unknown. Almaini et al. (2003) find evidence for a strong angular cross-correlation between the X-ray and sub-millimetre populations. They suggests there may be an evolutionary sequence in these galaxies between the major episode of star-formation (sub-millimetre sources) and the onset of quasar activity (X-ray sources). To more fully understand the nature of these sources will require in-depth multi-wavelength studies of the X-ray source population.
We are conducting a deep X-ray survey with Chandra and XMM in two of the European Large Area ISO Survey (ELAIS) fields, N1 and N2. These high latitude fields were chosen for their low cirrus emission, and have a wealth of multi-wavelength data available. Both fields have been observed with ISO at 7, 15, 90, and 175 m (Oliver et al. 2000), with the VLA at 1.4 GHz (Ciliegi et al. 1999, Ivison et al. 2002), and have deep g′, r′, i′, H, and K imaging (Gonzalez-Solares et al. 2003). Region N2 has been mapped with SCUBA to 8 mJy at 850m (Fox et al. 2001, Scott et al. 2001). As well as the Chandra observations described here, XMM-Newton observations in region N1 ( ksec pointings) are awaiting scheduling.
In this paper we present the analysis of the Chandra X-ray data and the Chandra source catalogue. Paper II (Gonzalez-Solares et al. 2003) will present details of the optical identifications.
2 The X-ray data
The ELAIS Deep X-ray Survey (EDXS) is being conducted in the northern ELAIS regions N1 and N2. The Chandra data consists of approximately 75 ks exposures in each field. Region N1 was observed on 3-4 August 2000 (OBS_ID 888) and N2 on 2-3 August 2000 (OBS_ID 887). The nominal aimpoints were N1: 16:10:20.11 +54:33:22.3, and N2: 16:36:46.99 +41:01:33.7. The ACIS-I chips were used with the addition of ACIS-S2 and ACIS-S4.
Analysis was carried out on data reprocessed with version R4CU5UPD14.1 of the pipeline processing software. The data were reduced using the CIAO software package (version 2.1). Bad pixels and columns were removed and data were filtered to eliminate high background times. The latter was achieved through constructing a lightcurve for background regions and identifying periods of intense background activity due to solar flares. One obvious flaring period was identified over the course of the observations resulting in the removal of 1552 seconds from the data in region N1. More stringent conditions for the removal of high background times were not thought necessary considering the low level of the quiescent background. After filtering, exposures in fields N1 and N2 were 71.5 ks and 73.4 ks respectively.
Exposure maps were constructed to account for variations in effective exposure across an image. This incorporates the positions of bad pixels, dithering, and vignetting. The effective exposure is significantly affected by the energy of the source counts. To account for this, an assumed source spectrum is convolved with the quantum efficiency of the chip and the effective area of the mirrors. The resulting map provides an estimate of the effective exposure (cm-2 s-1) at each point on the image. For our images, we used a power-law model spectrum, with photon index .
3 Source detection
Sources were detected using a wavelet method, specifically the WAVDETECT program (Freeman et al. 2002) included with the CIAO software package. The “Mexican Hat” wavelet function is used, which consists of a positive core similar to a canonical PSF, surrounded by a negative annulus. The overall normalisation is zero. The zero-crossing point is at a radius of i, and the minimum at 2i, where i refers to the scale size in pixels. The correlation of this wavelet function with an image will reveal sources where correlation values are larger than a pre-defined threshold.
A binned image was used, giving a pixel size of 0.984′′. The threshold for source detection was set such that the probability of erroneously identifying a given pixel with a source is 9.5. This translates to a mean detection of 1.0 false sources over the region of the 4 ACIS-I chips. Wavelet scales were chosen at i = 2, 2, 4, 4, 8, 8, 16, 16, and 32 pixels. The minimum scale was chosen to enclose 90% encircled energy of an on-axis PSF. Larger scales can then match the increased size of off-axis and resolved sources. The algorithm also uses an exposure map to correct for inconsistencies across the chips.
Sources were detected in 3 bands: 0.5 - 8 keV (full band), 0.5 - 2 keV (soft band), and 2 - 8 keV (hard band). Below 0.5 keV the quantum efficiency (including the optical blocking filters) of the front illuminated chips drops off steeply. A steep rise is also observed in the background rate due to charged particles. Beyond 8 keV the effective area of the mirrors is sharply decreasing whilst the background rate is again beginning to rise.
In order to verify that no sources were missed, we also ran a source detection on the 0.3 - 10 keV band. All sources found were also detected in the 0.5 - 8 keV band, and overall, fewer sources were detected.
3.1 Sample reliability and detection efficiency
For the purposes of source detection, counts flagged as cosmic-ray afterglows were removed from the image. This procedure is known to also remove several percent of source photons. Therefore, to obtain reliable measurements of source flux and extent, a second run of the WAVDETECT algorithm was performed on an image where the flagged counts were reinstated. Only sources obtained in the original source detection were used.
WAVDETECT simulations (Freeman et al. 2002) suggest a mean of 1.0 false sources will be detected over the region of the 4 ACIS-I chips. We also impose a cut-off at a S/N of 3.0, principally, for the purpose of defining a flux limit. This has the effect of removing a handful of the least significant sources, further improving the reliability of the sample.
The detection efficiency of WAVDETECT is yet to be definitively determined. Early simulations have been done by V. Kashyap (private communication) to determine the probability of detecting sources of given strengths. In order to gain an indication of the number of sources missing from our list of detections, we have made crude extrapolations to these simulations. These indicate that we detect 98.5 – 99.5 % of the sources with intrinsic strengths above the S/N limit of our sample.
4 The Chandra Source Catalogue
A total of 233 X-ray sources have been detected in the 2 fields (Fig. 1). In N1 there are 127 sources in the full band (0.5 - 8 keV), 101 in the soft band (0.5 - 2 keV) including 2 extra sources not detected in the full band, and 72 sources in the hard band (2 - 8 keV) including 1 extra source not detected in the full band. There are 57 sources detected in both the soft and hard bands. In N2 there are 98 sources in the full band, 81 in the soft band (including 3 extra sources not in the full band), and 52 sources in the hard band (including 2 extra sources not in the full band). There are 41 sources detected in both the soft and hard bands.
The IAU name for the catalogued sources is CXOEN1 JHHMMSS.s+DDMMSS, for sources in N1 (table 1), and CXOEN2 JHHMMSS.s+DDMMSS for sources in N2 (table 2). Coordinates are truncated to the above accuracy.
Tables 1 & 2 display the full catalogue. Sources are detected to a S/N limit of 3, defined as
| (1) |
where C are the net source counts, and B the background counts within the ‘source cell’, a region defined by WAVDETECT assumed to contain effectively all of the source counts (Freeman et al. 2002). It should be noted that the source cell used here may be larger than regions used for conventional aperture photometry. The values calculated for S/N may therefore be lower than those expected from such methods. The denominator of equation 1 is an approximate expression for the error on the background counts (a small number statistic). This comes from Gehrels (1986): equation (7), which gives the upper confidence level equivalent to a Gaussian error. For sources that do not reach the S/N limit in a certain band, an upper flux limit has been calculated from equation 5 (section 5, this paper).
Source coordinates have been astrometrically corrected using calibrated r′ band images (to a depth of r′ 26). High S/N Chandra sources were matched with stellar r′ band counterparts. 16 sources were used in N1 and 11 in N2, with a good spread across the fields. The Starlink package ASTROM was used to perform a 6-parameter fit (zero points, scales in and , orientation and non-perpendicularity). The RMS residuals were all less than 1′′, randomly distributed with a mean of . The positional error quoted in the catalogue is the error on the centroid position from the source detection algorithm, with 0.4′′ added in quadrature to represent astrometric error.
Net counts are quoted as the total source counts (background subtracted) in the full energy band (0.5 - 8 keV). Where sources are only detected in the soft or hard bands, the net counts represent counts in this band only.
Flux values are calculated assuming a power-law source spectrum of the form with . The effective area will vary as a function of depending on the response of the detector. If the slope of the spectrum is known for a given source, Fig. 2 can be used to calculate the true flux from the value given in the catalogue. This figure has been calculated by passing model spectra of slope through the total response matrix of the detector. For illustrative purposes we use the response matrix at a position corresponding to the source N1_23 which lies 4.5 arcmin from the field centre.
5 Source counts
In this section we calculate the cumulative source counts, N(S), and the differential source counts, n(S), in the three bands. We first outline details of the calculation (section 5.1) which requires knowledge of the available area of the survey as a function of flux. Section 5.2 presents our results and comparisons with other surveys, while section 5.3 describes our source contribution to the hard X-ray background.
5.1 Calculating source counts
N(S) is defined as the sum of the reciprocal areas available for detecting each source that is brighter than flux S. It follows that n(S) is the sum of reciprocal areas per flux interval. The sky area over which a source of flux S may be observed depends on the flux limit at each point in the image. This, in turn, depends on the variation in PSF size and effective exposure across the image. The flux limit ( in erg cm-2 s-1) may be defined by the chosen S/N limit of our sample (from equation 1):
| (2) |
where
| (3) |
K is a constant (conversion factor from ergs to counts), while the effective exposure (in cm2s) at each point on the image can be found from the exposure map. The background counts within the source region (B), depend on the size of the PSF:
| (4) |
is the mean background counts per pixel. We are left with the following expression for the flux limit:
| (5) |
PSF sizes across the image were taken from the latest PSF library available with the CIAO software distribution. These were used in conjunction with the relevant exposure maps for each band to calculate a ‘flux limit map’ of the Chandra image. The sky area available at a given flux limit is found by summing all the pixels with values smaller than this limit. Fig. 3 displays the sky area available at the flux limit of our survey.
5.2 Results
The cumulative number counts per square degree are plotted as filled circles in Fig. 4. 1 errors are plotted as solid lines. These incorporate Poisson errors on the counts and the error on the available sky area. The limiting flux levels are erg cm-2 s-1 (0.5 - 8 keV), erg cm-2 s-1 (0.5 - 2 keV), and erg cm-2 s-1 (2 - 8 keV). Simulations show detection efficiency to be around 99% (see section 3.1), while Eddington bias may result in an over-estimation of the cumulative number counts by approximately 1% (Manners 2002). These factors work to cancel each other and can safely be neglected.
We compare the number counts with those obtained from the Chandra Deep Field North (CDFN, Brandt et al. 2001), the Chandra Deep Field South (CDFS, Rosati et al. 2002), and those of Mushotzky et al. 2000 (M2000). The number counts in the soft band are in good agreement with CDFN and M2000, differing by less than 1 at the flux limit, while CDFS counts are 25% lower (2.5). The hard band counts of all four surveys are in reasonably good agreement at our flux limit. At brighter fluxes the surveys differ by , most likely as a result of large-scale structure.
The presence of clustering on these scales is well illustrated by the difference in the number counts observed in N1 and N2 (Fig. 5). There are 30% more sources in N1 than N2 in the full band. In particular there is an overabundance of brighter sources in N1 at a flux of erg cm-2 s-1. Large-scale structure is evident in the source images (Fig. 1), most noticeably as a dearth of sources in the centre of N2. Similar structure can also be seen in images of the Chandra Deep Field South (Giacconi et al. 2001). An analysis of 9 Chandra fields by Yang et al. (2003) has shown that such clustering is common in the Chandra source population.
A striking feature of the number count relations is the difference in slope between soft and hard band counts. Fig. 6 over-plots the soft and hard band counts normalised to an equivalent full band flux. Normalisation is done in order to plot both populations on the same flux scale and does not affect the slope of the number counts. The hard band sources are assumed to have hard spectra and so are arbitrarily normalised using an alpha of 0. The soft band sources are arbitrarily normalised assuming a soft spectrum with an alpha of 1. The ratio of hard sources to soft sources is seen to increase dramatically towards fainter fluxes. This can be explained through the mechanism of obscuration, which will act to harden the spectra while reducing the flux observed from X-ray sources.
Differential number counts per square degree per unit flux are plotted in Fig. 7. Error bars display 1 errors incorporating Poisson errors on the counts and the error on the available sky area. The slope of the differential counts for each band was fitted with a power-law using a weighted least-squares fit. A single power-law was found to adequately fit the entire flux range for each of the three bands. For the 0.5 - 2 keV band over the flux range (0.57 - 26) erg cm-2 s-1 we find:
| (6) |
For the 2 - 8 keV band over the flux range (2.7 - 63) erg cm-2 s-1 we find:
| (7) |
For the 0.5 - 8 keV band over the flux range (1.4 - 70) erg cm-2 s-1 we find:
| (8) |
The hard band differential counts are compared to a maximum likelihood fit from Cowie et al. (2002) to the combined counts from four deep fields (CDFN, CDFS, SSA22, & SSA13). These are found to be in good agreement with the error limits of our survey.
5.3 Contribution to the hard X-ray background
Fig. 8 plots the integrated source flux for our survey (filled circles) for all sources with erg cm-2 s-1. At the flux limit of erg cm-2 s-1 the resolved flux amounts to 8.5 erg cm-2 s-1 deg-2. This is equivalent to between 50 and 64% of the 2 - 8 keV background measured by Vecchi et al. (1999, Beppo-Sax) and Ueda et al. (1999, ASCA) respectively. To arrive at these values for the total background (as plotted in Fig. 8) the contribution from sources with erg cm-2 s-1, as observed by ASCA (Della Ceca et al. 1999), has been subtracted. The contribution to the background at fainter fluxes has been extrapolated from the source counts of the CDFN survey (Brandt et al. 2001). By combining the results of our survey with that of CDFN the contribution to the background within the flux range - 6 erg cm-2 s-1 becomes 1.12 erg cm-2 s-1 deg-2, equivalent to 66% and 84% of the aforementioned backgrounds. To compare the contributions from other surveys, we have used the best fit to the source counts as published by Mushotzky et al. (2000), and Giacconi et al. (2001, 120ks exposure of CDFS). These have been normalised at the bright end using the number counts of ASCA sources from Della Ceca et al. (1999) to a bright limit of erg cm-2 s-1. The observed discrepancy between the different surveys may be due to the effects of clustering on scales larger than the survey regions.
6 Star/galaxy classification
Deep multicolour optical images have been obtained in both our fields, and will be discussed fully in Gonzalez-Solares et al. (2003). They have identified the optical counterparts of our X-ray sources in r′ band images with limiting magnitudes of 26. Source optical morphologies are classified according to agreement with a stellar point spread function, as quantified in the SExtractor “stellarity” parameter, CLASS STAR (Bertin & Arnouts 1996). The output of a neural network classifier, the value of this parameter ranges from 0.0 for significantly extended sources to 1.0 for those with perfectly stellar PSFs. For our Chandra sample, we divide sources with quasar-like and galaxy-like counterparts at CLASS STAR . In practice, morphological classification is increasingly ambiguous for fainter sources with lower signal to noise and cannot be considered reliable near to the image limiting magnitude. A number of X-ray sources remain unclassified where they are associated with blank fields, gaps in the data, or are near to bright contaminating sources in the optical images.
The cumulative soft-band source counts for each group have been calculated and are plotted in Fig. 9. At bright X-ray fluxes quasar-like sources are the most numerous. However their number counts flatten appreciably below a flux of erg cm-2 s-1. At fainter fluxes the fraction of galaxy-like sources dramatically increases. At the flux limit of erg cm-2 s-1 there are 35% more galaxy-like sources than quasar-like sources.
An X-ray luminosity function (XLF) from Boyle et al. (1994) invoking pure luminosity evolution, was used to obtain number count predictions for broad-line AGN. This was based on observations of 107 QSOs from a deep ROSAT survey. These QSOs reached a flux limit of erg cm-2 s-1 in the 0.5 - 2 keV band. We use their best fitting model (model S), with an exponential decline in the quasar population beyond , to construct a prediction for the soft band QSO number counts. This is over-plotted in Fig. 9 (solid line) to compare with the cumulative number counts for sources with quasar-like optical IDs. The Boyle XLF also includes relatively low luminosity AGN which may possibly be resolved into galaxies in our r′ band images. A second model has therefore been added which excludes AGN with a 0.5 - 2 keV luminosity less than erg s-1 (dotted line).
The models are well matched to the data up to the flux limit of the ROSAT survey. However, beyond this they over-predict the number of quasar-like sources. In the limiting case where all the unclassified sources are stellar, the data becomes a good fit to the first model. In the more likely outcome that most of the unclassified objects are galaxies, the data may still be a reasonable fit to the Boyle XLF as long as a luminosity cut-off is applied.
In Fig. 10 we plot full band X-ray flux vs. r′ band magnitude for our Chandra sources (compare with Fig. 3 of Barger et al. 2002, Fig. 16 of Giacconi et al. 2002, Fig. 6 of Mainieri et al. 2002). In this figure, as in those in section 7, we indicate source morphology only for sources with r′ 24, which have unambiguous classifications. Over-plotted are lines of constant X-ray to optical ratio, appropriate for the Sloan Gunn r′ filter:
| (9) |
Among point-like sources optical luminosity is seen to scale with X-ray luminosity; nearly all exhibit X-ray to optical ratios, , of 0.1 to 10. In contrast, sources with galaxy-like morphology show no tight relation between X-ray and optical fluxes, suggesting that the host galaxies and not the central AGN dominate the optical emission. Four spectroscopically confirmed Type II AGN (discussed fully in Willott et al. 2002, Peres-Fournon et al. 2002) are marked in Fig. 10, only one of which has a notably high value of . Of the six point-like sources with , three are spectroscopically confirmed stars, as noted in the figure.
7 Hardness ratios
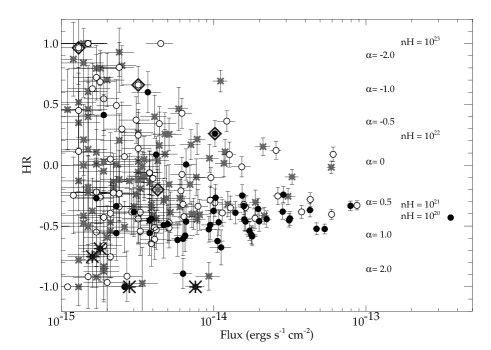
Broad band X-ray hardness ratios were calculated for each source, and were defined as , where H and S are the background-subtracted source counts in the hard (2.0 - 8.0 keV) and soft (0.5 - 2.0 keV) bands, respectively. Net source counts were extracted from the exposure corrected hard and soft band images within circular regions centred on the WAVDETECT positions. The apertures were scaled to mimic the degradation of the Chandra PSF with off-axis angle in each band, and had minimum radii of 10 pixels. Background counts were extracted from source-free images in annuli around each source, and subtracted. The net, source, and background counts thus obtained were consistent within the errors to those reported by WAVDETECT. We find that background subtraction and exposure correction of the source counts have increasingly significant effects on the derived hardness ratios toward fainter fluxes.
Hardness ratios are plotted against full band X-ray flux in Fig. 11. As noted by earlier surveys (Mushotzky et al. 2000, Giacconi et al. 2001, Hasinger et al. 2001, Hornschemeier et al. 2001), harder sources are seen at fainter fluxes, signalling the emergence of the population comprising the majority of the XRB. Assuming power-law spectra typical of AGN, the range of hardnesses observed suggests absorbing columns of up to NH at zero redshift. As apparent absorption column scales as (see e.g. Barger et al. 2002), actual columns in higher redshift sources will be significantly higher. The range of observed columns is consistent with that seen in other deep surveys (e.g. Barger et al. 2002, Mainieri et al. 2002) in which growing samples of spectroscopic identifications have so far revealed only a handful of more heavily obscured objects.
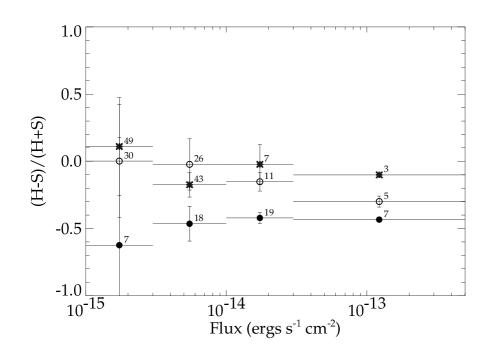
The symbols in Fig. 11 refer to the morphological classification discussed in section 5.2. We see that the point-like sources generally cluster around a HR of -0.5 at all fluxes. This value is consistent with a power law of 0.7 modified only by Galactic absorption, and is typical of Type I QSOs. Sources with galaxy-like morphology are seen in this region, but also populate increasingly hard regions of the diagram at fainter fluxes. Three of the four confirmed Type II AGN are conspicuously hard. The trend to harder X-ray spectra at fainter X-ray fluxes for optically extended sources is more clearly seen in Fig. 12, which shows error-weighted average hardness ratios for sources of different morphologies binned by flux.
8 Extended Sources
To search for X-ray sources on scales much larger than the PSF we have run the source detection algorithm WAVDETECT using wavelet scales of 16, 16, 32, 32, and 64 pixels (see section 3). Any sources found in addition to those already detected were checked by inspecting the adaptively smoothed Chandra images.
No additional sources were detected in N1 and inspection of the smoothed image reveals no hint of large extended sources. In N2 there are 2 significant extended sources. This is equivalent to 12 deg-2 over the 2 fields at a limiting soft band flux of erg s-1 cm-2. This source density is consistent with the number counts reported by Bauer et al. (2002) and references therein (their Fig. 6).

The most significant of the 2 detected sources is CXOEN2 J163637.3+410804 displayed in Fig. 13. The X-ray position (centred on the brightest component of the extended source) is at J2000 16:36:37.38 +41:08:04.9. There are 207 net source counts in the 0.5 - 2 keV band in an area corresponding to a factor 17.5 larger than the PSF. This extrapolates to a soft band flux of erg cm-2 s-1, although this includes the flux from point source N2_101 (CXOEN2 J163633.8+410730) which lies within the extended source region at a distance of 52 arcsec from the core. The r′ band image of this region reveals the presence of a galaxy cluster.
Spectra of three cluster members show absorption features consistent with a redshift of 0.4232 (Perez-Fournon et al. 2003). The ACIS-S pulse height spectrum of the cluster (Fig. 14) and appropriately weighted response matrices were extracted using standard CIAO tools, and spectral analysis was performed using XSPEC. The data is well fitted with a Raymond-Smith emission model for hot, diffuse gas with an abundance of 0.3 solar and a plasma temperature of 2.730.81 keV.
The second extended X-ray source in N2 is also associated with a galaxy cluster. This source (shown in Fig. 15) is at the very edge of the Chandra image. Its position is approximately J2000 16:37:28.5 +41:00:13, although the centroid may in fact lie outside the area of the image. For this reason, the identification and properties of this source will not be reported here.
9 Conclusions
We have presented the Chandra source catalogues for deep (75 ks) observations of the ELAIS fields N1 and N2. A total of 233 X-ray point sources are detected: 225 in the 0.5 - 8 keV band, 182 in the 0.5 - 2 keV band, and 124 in the 2 - 8 keV band. In addition, 2 extended sources are detected in N2 in the 0.5 - 2 keV band and are found to be associated with galaxy clusters.
An over-density of sources is found in N1 with 30% more sources than N2. This difference is present in both the soft and hard band number counts and may be attributed to large-scale structure. A similar variance is seen between other deep Chandra surveys.
Source count statistics reveal an increasing fraction of hard sources at fainter fluxes. The number of galaxy-like counterparts also increases dramatically towards fainter fluxes, consistent with the emergence of a large population of obscured sources. Additionally, objects with galaxy-like and faint optical counterparts exhibit harder X-ray spectra towards fainter fluxes, consistent with significant absorbing columns in this population.
The source catalogues and further information regarding the ELAIS deep X-ray survey can be found at this URL: http://www.roe.ac.uk/jcm/edxs
ACKNOWLEDGEMENTS
JM acknowledges the support of a PPARC Studentship and would like to thank the IfA, Edinburgh for providing extra funds for the completion of this paper.
References
- [] Almaini O., Shanks T., Boyle B.J., Griffiths R.E., Roche N., Stewart G.C., & Georgantopoulos I., 1996, MNRAS, 282, 295
- [] Almaini O., Scott S.E., Dunlop J.S., Manners J.C., Willott C.J., Lawrence A., Ivison R.J., Johnson O., Blain A.W., Peacock J.A., Oliver S.J., Fox M.J., Mann R.G., Perez-Fournon I., Gonzalez-Solares E., Rowan-Robinson M., Serjeant S., Cabrera-Guerra F., Hughes D.H., 2003, MNRAS, 338, 303
- [] Barger A.J., Cowie L.L., Mushotzky R.F., Richards E.A., 2001a, AJ, 121, 662
- [] Barger A.J., Cowie L.L., Steffen A.T., Hornschemeier A.E., Brandt W.N., Garmire G.P., 2001b, ApJ, 560, L23
- [] Barger A.J., Cowie L.L., Brandt W.N., Capak P., Garmire G.P., Hornschmeier A.E., Steffen A.T., Wehner E.H., 2002, AJ, 124, 1839
- [] Barger A.J., Cowie L.L., Capak P., Alexander D.M., Bauer F.E., Brandt W.N., Garmire G.P., Hornschmeier A.E., 2003, ApJ, 584, L61
- [] Bauer F.E., Alexander D.M., Brandt W.N., Hornschemeier A.E., Miyaji T., Garmire G.P., Schneider D.P., Bautz M.W., Chartas G., Griffiths R.E., Sargent W.L.W., 2002, AJ, 123, 1163
- [] Bertin E., Arnouts S., 1996, A&AS, 117, 393
- [] Boyle B.J., Griffiths R.E., Shanks T., Stewart G.C., Georgantopoulos I., 1994, MNRAS, 271,639
- [] Brandt W.N., Alexander D.M., Hornschemeier A.E., Garmire G.P., Schneider D.P., Barger A.J., Bauer F.E., Broos P.S., Cowie L.L., Townsley L.K., Burrows D.N., Chartas G., Feigelson E.D., Griffiths R.E., Nousek J.A., Sargent W.L.W., 2001, AJ, 122, 2810
- [] Ciliegi P., et al. 1999, MNRAS, 302, 222
- [] Cowie L.L., Garmire G.P., Bautz M.W., Barger A.J., Brandt W.N., Hornschemeier A.E., 2002, ApJ, 566, 5
- [] Della Ceca R., Castelli G., Braito V., Cagnoni I., & Maccacaro T., 1999, ApJ, 524, 674
- [] Fox M.J., Efstathiou A., Rowan-Robinson M., Dunlop J., Scott S.E., Ivison R., Serjeant S., Oliver S., Peacock, J., Mann R., et al. 2001, MNRAS accepted, astro-ph/0107585
- [] Freeman P.E., Kashyap V., Rosner R., Lamb D.Q., 2002, ApJS, 138, 185
- [] Gehrels N., 1986, ApJ, 303, 336
- [] Giacconi R., Rosati P., Tozzi P., Nonino M., Hasinger G., Norman C., Bergeron J., Borgani S., Gilli R., Gilmozzi R., Zheng W., 2001, ApJ, 551, 624
- [] Giacconi R., Zirm A., Wang J., Rosati P., Nonino M., Tozzi P., Gilli R., Mainieri V., Hasinger G., Kewley L., Bergeron J., Borgani S., Gilmozzi R., Grogin N., Koekemoer A., Schreier E., Zheng W., Norman C., 2002, ApJS, 139, 369
- [] Gonzalez-Solares E., et al. 2003, in preparation.
- [] Hasinger G., Burg R., Giacconi R., Hartner G., Schmidt M., Trümper J., Zamorani G., 1993, A&A, 275, 1
- [] Hasinger G., Burg R., Giacconi R., Schmidt M., Trumper J., Zamorani G., 1998, A&A, 329, 482
- [] Hasinger G., Altieri B., Arnaud M., Barcons X., Bergeron J., Brunner H., Dadina M., Dennerl K., Ferrando P., Finoguenov A., Griffiths R. E., Hashimoto Y., Jansen F.A., Lumb D.H., Mason K.O., Mateos S., McMahon R.G., Miyaji T., Paerels F., Page M.J., Ptak A.F., Sasseen T.P., Schartel N., Szokoly G.P., Trümper J., Turner M., Warwick R.S., & Watson M.G., A&A, 2001, 365, L45
- [] Hornschemeier A.E., Brandt W.N., Garmire G.P., Schneider D.P., Broos P.S., Townsley L. K., Bautz M.W., Burrows D.N., Chartas G., Feigelson E.D., Griffiths R., Lumb D., Nousek J.A. & Sargent W.L.W., 2000, ApJ, 541, 49
- [] Hornschemeier A.E., Brandt W.N., Garmire G.P., Schneider D.P., Barger A.J., Broos P.S., Cowie L.L., Townsley L.K., Bautz M.W., Burrows D.N., Chartas G., Feigelson E.D., Griffiths R.E., Lumb D., Nousek J.A., Ramsey L.W., Sargent W.L.W., 2001, ApJ, 554, 742
- [] Ivison R.J., Greve T.R., Smail I., Dunlop J.S., Roche N.D., Scott S.E., Page M.J., Stevens J.A., Almaini O., Blain A.W., Willott C.J., Fox M.J., Gilbank D.G., Serjeant S., Hughes D.H., 2002, MNRAS, 337, 11
- [] Manners J.C., 2002, Ph.D. thesis, Edinburgh Univ.
- [] Mainieri V., Bergeron J., Hasinger G., Lehmann I., Rosati P., Schmidt M., Szokoly G., Della Ceca R., 2002, A&A, 393, 425
- [] Maiolino R., Marconi A., Salvati M., Risaliti G., Severgnini P., Oliva E., La Franca F., Vanzi L., 2001, A&A, 365, 28
- [] Mushotzky R.F., Cowie L.L., Barger A.J., & Arnaud K.A., 2000, Nature, 404, 459
- [] Oliver S.J. et al., 2000, MNRAS, 316, 749
- [] Perez-Fournon et al., 2003, in preparation.
- [] Rosati P., Tozzi P., Giacconi R., Gilli R., Hasinger G., Kewley L., Mainieri V., Nonino M., Norman C., Szokoly G., Wang J.X., Zirm A., Bergeron J., Borgani S., Gilmozzi R., Grogin N., Koekemoer A., Schreier E., Zheng W., 2002, ApJ, 566, 667
- [] Scott S.E., Fox M.J., Dunlop J., Rowan-Robinson M., Ivison R., Serjeant S., Oliver S., Peacock, J., Mann R., et al. 2001, MNRAS submitted, astro-ph/0107446
- [] Tozzi P., Rosati P., Nonino M., Bergeron J., Borgani S., Gilli R., Gilmozzi R., Hasinger G., Grogin N., Kewley L., Koekemoer A., Norman C., Schreier E., Szokoly G., Wang J.X., Zheng W., Zirm A., Giacconi R., 2001, ApJ, 562, 42
- [] Ueda Y., et al. 1999, ApJ, 518, 656
- [] Vecchi A., Molendi S., Guainazzi M., Fiore F., & Parmer A.N., 1999, A&A, 349, L73
- [] Willott C.J., Simpson C., Almaini O., Manners J.C., Johnson O., Lawrence A., Dunlop J.S., Ivison R.J., Rawlings S., Gonzalez-Solares E., Perez-Fournon I., Serjeant S., Oliver S.J., Roche N.D., Mann R.G., Rowan-Robinson M., 2002, MNRAS in press, astro-ph/0210248
- [] Yang Y., Mushotzky R.F., Barger A.J., Cowie L.L., Sanders D.B., Steffen A.T., 2003, ApJ, 585, 85
| Table 1. Chandra sources in the ELAIS N1 field. | ||||||||||
| RA | Dec | Err | Net | Flux ( erg cm-2 s-1) | ||||||
| ID | CXOEN1 | (J2000) | (J2000) | (arcsec) | Cts | S/N | (0.5–8keV) | (0.5–2keV) | (2–8keV) | HR |
| N1_1 | J161121.8+543402 | 16:11:21.88 | +54:34:02.7 | 0.65 | 76.3 | 17.4 | 1.24 0.15 | 0.48 0.07 | ||
| N1_2 | J161113.1+543748 | 16:11:13.10 | +54:37:48.7 | 0.84 | 30.5 | 7.2 | 0.42 0.09 | 0.12 0.03 | ||
| N1_3 | J161104.3+543107 | 16:11:04.33 | +54:31:07.2 | 0.63 | 31.9 | 8.8 | 0.43 0.08 | 0.12 0.03 | 0.32 0.12 | |
| N1_4 | J161059.5+543332 | 16:10:59.53 | +54:33:32.4 | 0.45 | 122.5 | 31.6 | 1.62 0.15 | 0.59 0.06 | 1.13 0.20 | |
| N1_5 | J161058.1+543640 | 16:10:58.16 | +54:36:40.7 | 0.47 | 60.6 | 18.5 | 0.81 0.11 | 0.31 0.05 | 0.58 0.14 | |
| N1_6 | J161055.7+543901 | 16:10:55.74 | +54:39:01.0 | 0.47 | 195.6 | 43.7 | 2.64 0.19 | 0.89 0.08 | 2.23 0.29 | |
| N1_8 | J161055.5+543535 | 16:10:55.50 | +54:35:35.6 | 0.44 | 125.9 | 34.8 | 1.72 0.16 | 0.70 0.07 | 0.96 0.19 | |
| N1_9 | J161055.0+543222 | 16:10:55.09 | +54:32:22.3 | 0.50 | 56.6 | 16.2 | 0.74 0.10 | 0.28 0.04 | 0.52 0.14 | |
| N1_10 | J161052.3+542953 | 16:10:52.37 | +54:29:53.8 | 0.63 | 12.6 | 4.1 | 0.17 0.05 | 0.05 0.02 | ||
| N1_11 | J161051.6+543600 | 16:10:51.68 | +54:36:00.9 | 0.57 | 27.0 | 7.9 | 0.35 0.07 | 0.11 0.03 | 0.36 0.12 | |
| N1_12 | J161050.7+542953 | 16:10:50.73 | +54:29:53.9 | 0.61 | 30.8 | 8.5 | 0.41 0.08 | 0.07 0.02 | 0.61 0.15 | |
| N1_13 | J161050.8+543956 | 16:10:50.85 | +54:39:56.6 | 0.54 | 113.8 | 27.3 | 1.54 0.15 | 0.58 0.07 | 1.30 0.22 | |
| N1_14 | J161050.2+543024 | 16:10:50.21 | +54:30:24.1 | 0.44 | 119.6 | 34.4 | 1.96 0.18 | 0.73 0.08 | 1.40 0.25 | |
| N1_15 | J161048.6+543553 | 16:10:48.64 | +54:35:53.2 | 0.46 | 83.0 | 23.0 | 1.06 0.12 | 0.45 0.06 | 0.50 0.14 | |
| N1_16 | J161047.6+542813 | 16:10:47.68 | +54:28:13.0 | 0.66 | 10.4 | 3.7 | 0.15 0.05 | |||
| N1_17 | J161047.5+543401 | 16:10:47.50 | +54:34:01.9 | 0.66 | 12.4 | 4.0 | 0.16 0.05 | 0.08 0.02 | ||
| N1_18 | J161047.2+543134 | 16:10:47.25 | +54:31:34.7 | 0.63 | 18.7 | 5.8 | 0.24 0.06 | 0.07 0.02 | ||
| N1_19 | J161047.0+543700 | 16:10:47.08 | +54:37:00.8 | 0.52 | 50.9 | 14.1 | 0.66 0.10 | 0.25 0.04 | 0.40 0.12 | |
| N1_20 | J161046.5+543538 | 16:10:46.57 | +54:35:38.8 | 0.69 | 18.2 | 5.4 | 0.23 0.06 | 0.08 0.03 | ||
| N1_21 | J161046.0+542328 | 16:10:46.03 | +54:23:28.5 | 0.73 | 126.9 | 18.9 | 1.87 0.19 | 0.66 0.08 | 1.10 0.25 | |
| N1_22 | J161045.1+542952 | 16:10:45.18 | +54:29:52.6 | 0.61 | 18.6 | 5.7 | 0.24 0.06 | 0.54 0.14 | ||
| N1_23 | J161045.1+543612 | 16:10:45.15 | +54:36:12.9 | 0.40 | 2826.1 | 569.9 | 36.00 0.68 | 14.10 0.31 | 22.46 0.83 | |
| N1_24 | J161044.1+542934 | 16:10:44.18 | +54:29:34.1 | 0.70 | 18.9 | 5.5 | 0.24 0.06 | 0.07 0.02 | ||
| N1_25 | J161044.1+543601 | 16:10:44.14 | +54:36:01.9 | 0.42 | 148.2 | 41.5 | 1.88 0.16 | 0.68 0.07 | 1.45 0.22 | |
| N1_26 | J161042.8+542710 | 16:10:42.87 | +54:27:10.2 | 0.68 | 24.6 | 7.1 | 0.33 0.07 | 0.13 0.03 | ||
| N1_27 | J161041.6+542950 | 16:10:41.62 | +54:29:50.1 | 0.69 | 19.9 | 6.2 | 0.30 0.07 | 0.09 0.03 | ||
| N1_28 | J161041.3+543428 | 16:10:41.33 | +54:34:28.4 | 0.55 | 8.8 | 3.2 | 0.11 0.04 | 0.05 0.02 | ||
| N1_29 | J161040.2+543623 | 16:10:40.29 | +54:36:23.3 | 0.48 | 25.9 | 8.7 | 0.33 0.07 | 0.10 0.03 | 0.36 0.11 | |
| N1_30 | J161040.1+544000 | 16:10:40.14 | +54:40:00.9 | 0.54 | 70.9 | 18.7 | 0.95 0.12 | 0.35 0.05 | 0.77 0.17 | |
| N1_31 | J161039.1+543738 | 16:10:39.13 | +54:37:38.5 | 0.48 | 61.2 | 17.1 | 0.78 0.10 | 0.29 0.05 | 0.49 0.13 | |
| N1_32 | J161038.1+543050 | 16:10:38.14 | +54:30:50.3 | 0.49 | 15.5 | 5.5 | 0.19 0.05 | 0.08 0.02 | ||
| N1_34 | J161035.4+543250 | 16:10:35.40 | +54:32:50.7 | 0.46 | 39.8 | 13.3 | 0.50 0.08 | 0.19 0.04 | 0.32 0.10 | |
| Table 1. Chandra sources in the ELAIS N1 field (continued). | ||||||||||
| RA | Dec | Err | Net | Flux ( erg cm-2 s-1) | ||||||
| ID | CXOEN1 | (J2000) | (J2000) | (arcsec) | Cts | S/N | (0.5–8keV) | (0.5–2keV) | (2–8keV) | HR |
| N1_38 | J161033.6+543129 | 16:10:33.67 | +54:31:29.9 | 0.44 | 15.2 | 5.8 | 0.19 0.05 | 0.32 0.10 | ||
| N1_39 | J161031.9+543204 | 16:10:31.97 | +54:32:04.7 | 0.45 | 48.7 | 16.1 | 0.77 0.11 | 0.23 0.05 | 0.80 0.18 | |
| N1_40 | J161030.1+543142 | 16:10:30.12 | +54:31:42.0 | 0.42 | 129.0 | 38.0 | 1.58 0.14 | 0.57 0.06 | 1.19 0.19 | |
| N1_41 | J161027.5+543022 | 16:10:27.59 | +54:30:22.4 | 0.67 | 9.8 | 3.3 | 0.12 0.04 | 0.25 0.09 | ||
| N1_43 | J161026.7+543408 | 16:10:26.78 | +54:34:08.1 | 0.50 | 13.7 | 5.0 | 0.17 0.05 | 0.08 0.02 | ||
| N1_45 | J161023.2+543008 | 16:10:23.26 | +54:30:08.7 | 0.50 | 45.3 | 13.6 | 0.59 0.09 | 0.08 0.02 | 1.00 0.18 | |
| N1_46 | J161022.4+543149 | 16:10:22.45 | +54:31:49.2 | 0.52 | 11.6 | 4.2 | 0.15 0.05 | 0.24 0.09 | ||
| N1_47 | J161022.1+543850 | 16:10:22.13 | +54:38:50.8 | 0.46 | 80.3 | 22.7 | 1.02 0.12 | 0.36 0.05 | 0.77 0.16 | |
| N1_48 | J161021.7+543104 | 16:10:21.76 | +54:31:04.7 | 0.41 | 260.8 | 71.9 | 3.17 0.20 | 1.25 0.09 | 1.89 0.24 | |
| N1_49 | J161020.8+543900 | 16:10:20.88 | +54:39:00.9 | 0.46 | 87.0 | 25.6 | 1.11 0.12 | 0.10 0.03 | 2.21 0.27 | |
| N1_50 | J161020.3+543020 | 16:10:20.34 | +54:30:20.0 | 0.41 | 434.6 | 112.8 | 5.36 0.26 | 2.20 0.12 | 2.81 0.29 | |
| N1_51 | J161020.2+542937 | 16:10:20.25 | +54:29:37.2 | 0.64 | 13.9 | 4.7 | 0.19 0.06 | |||
| N1_52 | J161019.9+544001 | 16:10:19.96 | +54:40:01.8 | 0.68 | 23.1 | 6.8 | 0.32 0.07 | 0.13 0.03 | ||
| N1_53 | J161018.8+543229 | 16:10:18.81 | +54:32:29.5 | 0.61 | 10.7 | 3.6 | 0.13 0.04 | |||
| N1_54 | J161016.7+543136 | 16:10:16.78 | +54:31:36.9 | 0.58 | 11.0 | 3.8 | 0.13 0.05 | |||
| N1_55 | J161015.1+543546 | 16:10:15.12 | +54:35:46.4 | 0.51 | 27.6 | 9.1 | 0.33 0.07 | 0.13 0.03 | ||
| N1_56 | J161014.6+542802 | 16:10:14.64 | +54:28:02.2 | 0.63 | 25.0 | 7.4 | 0.32 0.07 | 0.09 0.03 | 0.37 0.12 | |
| N1_57 | J161014.5+543754 | 16:10:14.57 | +54:37:54.0 | 0.60 | 21.4 | 6.5 | 0.28 0.07 | 0.09 0.03 | ||
| N1_58 | J161013.0+543459 | 16:10:13.07 | +54:34:59.6 | 0.72 | 9.0 | 3.1 | 0.11 0.04 | |||
| N1_59 | J161012.8+542756 | 16:10:12.80 | +54:27:56.5 | 0.43 | 219.2 | 53.6 | 2.84 0.20 | 1.07 0.09 | 1.91 0.25 | |
| N1_60 | J161012.3+543807 | 16:10:12.33 | +54:38:07.9 | 0.60 | 21.0 | 6.6 | 0.28 0.07 | 0.14 0.03 | ||
| N1_61 | J161009.5+543245 | 16:10:09.59 | +54:32:45.6 | 0.58 | 26.3 | 7.9 | 0.32 0.07 | 0.12 0.03 | 0.23 0.09 | |
| N1_62 | J161009.0+543350 | 16:10:09.05 | +54:33:50.9 | 0.42 | 39.8 | 16.6 | 1.12 0.18 | 0.48 0.08 | 0.51 0.20 | |
| N1_64 | J161008.1+543307 | 16:10:08.12 | +54:33:07.7 | 0.44 | 51.7 | 17.2 | 0.63 0.09 | 0.29 0.04 | 0.22 0.09 | |
| N1_65 | J161007.4+543006 | 16:10:07.45 | +54:30:06.8 | 0.54 | 25.2 | 8.7 | 0.48 0.10 | 0.12 0.03 | 0.59 0.18 | |
| N1_66 | J161007.1+543722 | 16:10:07.16 | +54:37:22.8 | 0.65 | 15.2 | 4.8 | 0.19 0.05 | 0.09 0.02 | ||
| N1_67 | J161006.7+543243 | 16:10:06.77 | +54:32:43.3 | 0.41 | 182.5 | 55.5 | 2.23 0.17 | 0.88 0.08 | 1.35 0.20 | |
| N1_68 | J161004.8+543513 | 16:10:04.88 | +54:35:13.3 | 0.61 | 15.6 | 5.1 | 0.20 0.06 | 0.08 0.02 | ||
| N1_69 | J161003.1+543628 | 16:10:03.18 | +54:36:28.4 | 0.41 | 481.9 | 116.3 | 5.95 0.27 | 2.30 0.12 | 3.98 0.35 | |
| N1_71 | J161002.0+542525 | 16:10:02.03 | +54:25:25.5 | 0.61 | 107.2 | 21.2 | 1.59 0.16 | 0.61 0.07 | 0.84 0.19 | |
| N1_72 | J161001.2+543752 | 16:10:01.26 | +54:37:52.4 | 0.66 | 16.2 | 5.2 | 0.20 0.06 | 0.38 0.12 | ||
| N1_73 | J161000.8+543918 | 16:10:00.86 | +54:39:18.9 | 0.70 | 22.3 | 6.7 | 0.32 0.07 | 0.06 0.02 | 0.36 0.12 | |
| Table 1. Chandra sources in the ELAIS N1 field (continued). | ||||||||||
| RA | Dec | Err | Net | Flux ( erg cm-2 s-1) | ||||||
| ID | CXOEN1 | (J2000) | (J2000) | (arcsec) | Cts | S/N | (0.5–8keV) | (0.5–2keV) | (2–8keV) | HR |
| N1_75 | J160959.6+543315 | 16:09:59.65 | +54:33:15.2 | 0.43 | 125.4 | 35.7 | 1.62 0.15 | 0.63 0.07 | 0.96 0.18 | |
| N1_76 | J160959.0+542754 | 16:09:59.08 | +54:27:54.1 | 0.63 | 15.5 | 6.2 | 0.49 0.13 | 0.14 0.05 | 0.56 0.22 | |
| N1_77 | J160956.9+543444 | 16:09:56.92 | +54:34:44.5 | 0.62 | 14.3 | 5.6 | 0.34 0.09 | 0.13 0.04 | ||
| N1_78 | J160956.7+543510 | 16:09:56.79 | +54:35:10.3 | 0.47 | 26.6 | 8.8 | 0.38 0.08 | 0.15 0.03 | 0.26 0.10 | |
| N1_79 | J160956.0+543647 | 16:09:56.09 | +54:36:47.4 | 0.55 | 14.0 | 4.8 | 0.18 0.05 | 0.07 0.02 | ||
| N1_81 | J160952.2+543538 | 16:09:52.23 | +54:35:38.6 | 0.47 | 45.0 | 14.2 | 0.58 0.09 | 0.24 0.04 | 0.28 0.10 | |
| N1_82 | J160951.0+542801 | 16:09:51.05 | +54:28:01.9 | 0.55 | 70.4 | 18.1 | 0.95 0.12 | 0.35 0.05 | 0.59 0.15 | |
| N1_83 | J160951.0+543618 | 16:09:51.02 | +54:36:18.8 | 0.62 | 34.7 | 9.5 | 0.48 0.09 | 0.10 0.03 | 0.62 0.15 | |
| N1_84 | J160948.6+544307 | 16:09:48.68 | +54:43:07.3 | 0.59 | 304.1 | 39.6 | 4.29 0.26 | 1.57 0.11 | 2.86 0.36 | |
| N1_85 | J160947.4+543147 | 16:09:47.46 | +54:31:47.0 | 0.61 | 13.0 | 4.4 | 0.17 0.05 | |||
| N1_86 | J160943.8+543749 | 16:09:43.88 | +54:37:49.3 | 0.71 | 28.8 | 7.6 | 0.38 0.08 | 0.11 0.03 | 0.39 0.12 | |
| N1_87 | J160941.0+544013 | 16:09:41.08 | +54:40:13.1 | 0.58 | 147.1 | 26.0 | 1.99 0.18 | 0.78 0.08 | 1.18 0.22 | |
| N1_89 | J160937.2+544032 | 16:09:37.20 | +54:40:32.6 | 0.51 | 307.8 | 47.6 | 4.31 0.26 | 1.56 0.11 | 3.22 0.37 | |
| N1_90 | J160936.2+543812 | 16:09:36.24 | +54:38:12.5 | 0.58 | 80.9 | 18.2 | 1.08 0.13 | 0.45 0.06 | 0.49 0.15 | |
| N1_92 | J160933.9+543652 | 16:09:33.97 | +54:36:52.3 | 0.58 | 47.1 | 12.5 | 0.62 0.10 | 0.09 0.03 | 1.13 0.21 | |
| N1_93 | J160932.8+543210 | 16:09:32.83 | +54:32:10.4 | 0.49 | 118.5 | 28.1 | 1.58 0.15 | 0.58 0.06 | 1.18 0.21 | |
| N1_94 | J160932.3+543155 | 16:09:32.31 | +54:31:55.5 | 0.66 | 44.9 | 10.9 | 0.60 0.10 | 0.21 0.04 | ||
| N1_95 | J160916.3+543211 | 16:09:16.33 | +54:32:11.1 | 0.79 | 44.7 | 9.7 | 0.63 0.11 | 0.21 0.04 | ||
| N1_96 | J161120.3+543508 | 16:11:20.30 | +54:35:08.4 | 0.73 | 32.3 | 7.9 | 0.45 0.09 | 1.16 0.22 | ||
| N1_97 | J161108.3+543250 | 16:11:08.38 | +54:32:50.6 | 0.64 | 29.0 | 8.5 | 0.39 0.08 | 0.18 0.04 | ||
| N1_98 | J161107.0+543538 | 16:11:07.08 | +54:35:38.6 | 0.71 | 16.2 | 5.2 | 0.22 0.06 | 0.07 0.02 | ||
| N1_99 | J161102.8+542959 | 16:11:02.81 | +54:29:59.5 | 0.68 | 43.4 | 11.1 | 0.70 0.12 | 0.14 0.03 | 0.53 0.16 | |
| N1_100 | J161102.0+543826 | 16:11:02.02 | +54:38:26.7 | 0.76 | 23.3 | 6.6 | 0.32 0.07 | 0.12 0.03 | ||
| N1_101 | J161051.9+543006 | 16:10:51.99 | +54:30:06.9 | 0.66 | 12.7 | 4.2 | 0.17 0.05 | |||
| N1_102 | J161051.6+543446 | 16:10:51.62 | +54:34:46.9 | 0.69 | 14.3 | 4.6 | 0.18 0.05 | 0.34 0.11 | ||
| N1_103 | J161048.2+542547 | 16:10:48.20 | +54:25:47.9 | 0.87 | 24.8 | 6.0 | 0.35 0.08 | 0.10 0.03 | ||
| N1_104 | J161046.6+542437 | 16:10:46.63 | +54:24:37.5 | 0.72 | 74.6 | 14.5 | 1.14 0.15 | 0.48 0.06 | 0.64 0.19 | |
| N1_106 | J161017.4+543149 | 16:10:17.40 | +54:31:49.2 | 0.72 | 11.5 | 3.8 | 0.14 0.05 | |||
| N1_107 | J161011.9+543352 | 16:10:11.98 | +54:33:52.5 | 0.67 | 8.8 | 3.2 | 0.13 0.05 | |||
| N1_108 | J161004.9+542636 | 16:10:04.99 | +54:26:36.9 | 0.65 | 40.4 | 11.5 | 0.64 0.11 | 0.23 0.05 | ||
| N1_110 | J160951.7+543358 | 16:09:51.79 | +54:33:58.1 | 0.75 | 10.8 | 3.6 | 0.14 0.05 | 0.30 0.10 | ||
| Table 1. Chandra sources in the ELAIS N1 field (continued). | ||||||||||
| RA | Dec | Err | Net | Flux ( erg cm-2 s-1) | ||||||
| ID | CXOEN1 | (J2000) | (J2000) | (arcsec) | Cts | S/N | (0.5–8keV) | (0.5–2keV) | (2–8keV) | HR |
| N1_111 | J160948.7+542647 | 16:09:48.71 | +54:26:47.1 | 0.61 | 28.6 | 8.8 | 0.40 0.08 | 0.17 0.04 | ||
| N1_112 | J160948.2+543611 | 16:09:48.20 | +54:36:11.3 | 0.70 | 17.9 | 5.2 | 0.24 0.06 | 0.47 0.14 | ||
| N1_113 | J161126.3+543528 | 16:11:26.36 | +54:35:28.7 | 1.06 | 32.1 | 6.7 | 0.51 0.11 | 0.15 0.04 | 0.46 0.16 | |
| N1_114 | J161103.8+543303 | 16:11:03.83 | +54:33:03.1 | 0.81 | 15.2 | 4.5 | 0.21 0.06 | |||
| N1_115 | J161029.8+542401 | 16:10:29.86 | +54:24:01.6 | 0.88 | 23.3 | 6.0 | 0.38 0.09 | 0.16 0.04 | ||
| N1_116 | J161021.6+542608 | 16:10:21.67 | +54:26:08.0 | 0.89 | 11.4 | 3.7 | 0.17 0.06 | |||
| N1_117 | J161018.4+542733 | 16:10:18.49 | +54:27:33.4 | 0.77 | 18.5 | 5.3 | 0.24 0.06 | |||
| N1_118 | J161005.2+543909 | 16:10:05.23 | +54:39:09.7 | 0.85 | 13.6 | 4.1 | 0.17 0.05 | |||
| N1_119 | J160953.7+543755 | 16:09:53.78 | +54:37:55.6 | 0.68 | 12.8 | 4.3 | 0.17 0.05 | 0.33 0.12 | ||
| N1_121 | J160932.6+543436 | 16:09:32.63 | +54:34:36.9 | 0.78 | 13.1 | 4.2 | 0.18 0.06 | 0.56 0.15 | ||
| N1_123 | J161137.0+542541 | 16:11:37.00 | +54:25:41.6 | 0.99 | 136.6 | 12.4 | 2.11 0.24 | 0.56 0.08 | 2.81 0.49 | |
| N1_124 | J161131.4+543706 | 16:11:31.40 | +54:37:06.2 | 1.28 | 18.1 | 3.9 | 0.29 0.09 | 0.15 0.04 | ||
| N1_125 | J161123.7+542632 | 16:11:23.71 | +54:26:32.7 | 0.99 | 85.2 | 9.7 | 1.22 0.17 | 0.29 0.06 | 1.74 0.35 | |
| N1_126 | J161122.0+542217 | 16:11:22.00 | +54:22:17.0 | 1.13 | 214.9 | 12.7 | 3.27 0.33 | 1.14 0.12 | 2.66 0.53 | |
| N1_127 | J161101.6+543030 | 16:11:01.64 | +54:30:30.3 | 0.78 | 12.0 | 4.1 | 0.21 0.07 | 0.09 0.03 | ||
| N1_128 | J161043.4+543403 | 16:10:43.44 | +54:34:03.9 | 0.72 | 12.8 | 4.0 | 0.16 0.05 | 0.07 0.02 | ||
| N1_129 | J161025.7+542328 | 16:10:25.78 | +54:23:28.4 | 1.01 | 43.2 | 9.0 | 0.93 0.17 | 0.47 0.09 | ||
| N1_131 | J160943.6+543849 | 16:09:43.63 | +54:38:49.9 | 0.80 | 14.1 | 4.4 | 0.19 0.06 | 0.07 0.02 | ||
| N1_132 | J160920.4+543103 | 16:09:20.49 | +54:31:03.3 | 0.82 | 15.9 | 4.6 | 0.23 0.07 | 0.06 0.02 | 0.32 0.13 | |
| N1_133 | J160916.9+542811 | 16:09:16.98 | +54:28:11.1 | 0.99 | 33.5 | 6.5 | 0.51 0.11 | 0.11 0.03 | 0.68 0.22 | |
| N1_135 | J161132.0+542309 | 16:11:32.03 | +54:23:09.1 | 1.30 | 197.5 | 11.2 | 3.08 0.34 | 1.27 0.13 | — | |
| N1_136 | J161007.7+543834 | 16:10:07.74 | +54:38:34.4 | 0.79 | 16.1 | 4.8 | 0.22 0.06 | 0.07 0.03 | ||
| N1_137 | J161101.6+543422 | 16:11:01.64 | +54:34:22.9 | 0.80 | 11.7 | 3.6 | 0.15 0.05 | 0.31 0.11 | ||
| N1_138 | J161109.3+542035 | 16:11:09.31 | +54:20:35.4 | 1.42 | 62.6 | 5.0 | 0.96 0.22 | 0.40 0.08 | — | |
| N1_139 | J160942.5+542709 | 16:09:42.56 | +54:27:09.1 | 0.97 | 17.4 | 4.7 | 0.24 0.07 | 0.10 0.03 | ||
| N1_140 | J161058.4+543852 | 16:10:58.45 | +54:38:52.5 | 0.91 | 14.0 | 4.4 | 0.19 0.06 | 0.08 0.03 | ||
| N1_141 | J160943.1+544152 | 16:09:43.19 | +54:41:52.3 | 1.20 | 18.4 | 4.0 | 0.26 0.08 | 0.11 0.03 | ||
| N1_142 | J161113.5+543612 | 16:11:13.53 | +54:36:12.6 | 0.99 | 13.7 | 3.7 | 0.20 0.06 | 0.07 0.03 | ||
| N1_143 | J160940.1+543713 | 16:09:40.15 | +54:37:13.5 | 0.82 | 11.2 | 3.6 | 0.15 0.05 | 0.35 0.12 | ||
| N1_144 | J160941.8+543127 | 16:09:41.83 | +54:31:27.5 | 0.77 | 10.1 | 3.4 | 0.14 0.05 | 0.34 0.12 | ||
| N1_145 | J161048.8+543205 | 16:10:48.84 | +54:32:05.9 | 0.78 | 9.5 | 3.1 | 0.12 0.05 | |||
| N1_146 | J160946.1+543624 | 16:09:46.18 | +54:36:24.5 | 0.74 | 12.0 | 3.8 | 0.15 0.05 | 0.06 0.02 | ||
| N1_147 | J160909.8+542841 | 16:09:09.89 | +54:28:41.4 | 1.67 | 10.9 | 3.2 | 0.09 0.03 | |||
| N1_148 | J161037.9+543336 | 16:10:37.92 | +54:33:36.9 | 0.67 | 7.1 | 3.1 | 0.05 0.02 | |||
| N1_149 | J160923.1+542810 | 16:09:23.15 | +54:28:10.4 | 1.01 | 10.2 | 3.0 | 0.36 0.14 | |||
| Table 2. Chandra sources in the ELAIS N2 field. | ||||||||||
| RA | Dec | Err | Net | Flux ( erg cm-2 s-1) | ||||||
| ID | CXOEN2 | (J2000) | (J2000) | (arcsec) | Cts | S/N | (0.5–8keV) | (0.5–2keV) | (2–8keV) | HR |
| N2_1 | J163733.4+410309 | 16:37:33.41 | +41:03:09.3 | 0.44 | 638.9 | 101.7 | 8.73 0.35 | 3.20 0.15 | 6.32 0.48 | |
| N2_2 | J163730.2+410049 | 16:37:30.27 | +41:00:49.8 | 0.71 | 52.6 | 11.0 | 0.71 0.11 | 0.16 0.04 | 0.77 0.18 | |
| N2_4 | J163720.5+410402 | 16:37:20.50 | +41:04:02.2 | 0.59 | 11.6 | 4.2 | 0.17 0.05 | 0.06 0.02 | ||
| N2_5 | J163720.5+410626 | 16:37:20.58 | +41:06:26.6 | 0.49 | 216.6 | 45.4 | 2.87 0.20 | 0.99 0.08 | 2.33 0.29 | |
| N2_6 | J163715.2+410443 | 16:37:15.24 | +41:04:43.1 | 0.58 | 18.8 | 6.3 | 0.24 0.06 | 0.08 0.02 | ||
| N2_7 | J163712.3+410139 | 16:37:12.38 | +41:01:39.2 | 0.43 | 94.0 | 29.6 | 1.29 0.14 | 0.48 0.06 | 0.99 0.19 | |
| N2_8 | J163712.3+410131 | 16:37:12.36 | +41:01:31.7 | 0.54 | 15.6 | 5.6 | 0.21 0.06 | 0.08 0.02 | ||
| N2_9 | J163710.0+405643 | 16:37:10.04 | +40:56:43.2 | 0.43 | 338.9 | 73.8 | 4.74 0.26 | 1.97 0.12 | 2.39 0.30 | |
| N2_10 | J163709.2+410457 | 16:37:09.20 | +41:04:57.5 | 0.52 | 41.0 | 12.1 | 0.51 0.09 | 0.21 0.04 | 0.26 0.10 | |
| N2_11 | J163706.7+410501 | 16:37:06.72 | +41:05:01.7 | 0.77 | 10.1 | 3.5 | 0.13 0.05 | |||
| N2_12 | J163706.0+410054 | 16:37:06.00 | +41:00:54.6 | 0.57 | 10.4 | 3.7 | 0.13 0.04 | |||
| N2_13 | J163705.0+405749 | 16:37:05.03 | +40:57:49.2 | 0.61 | 19.7 | 6.1 | 0.25 0.06 | 0.57 0.14 | ||
| N2_14 | J163704.9+410509 | 16:37:04.94 | +41:05:09.0 | 0.44 | 95.4 | 28.8 | 1.19 0.12 | 0.29 0.04 | 1.50 0.22 | |
| N2_15 | J163704.4+405625 | 16:37:04.41 | +40:56:25.1 | 0.63 | 15.6 | 5.2 | 0.22 0.06 | 0.08 0.03 | ||
| N2_16 | J163703.2+410103 | 16:37:03.27 | +41:01:03.3 | 0.48 | 11.8 | 4.3 | 0.14 0.05 | 0.06 0.02 | ||
| N2_17 | J163703.1+405157 | 16:37:03.15 | +40:51:57.0 | 0.66 | 180.1 | 25.0 | 2.57 0.21 | 0.65 0.07 | 3.04 0.37 | |
| N2_18 | J163700.6+410555 | 16:37:00.64 | +41:05:55.7 | 0.42 | 251.7 | 69.1 | 3.13 0.20 | 1.25 0.09 | 1.85 0.24 | |
| N2_19 | J163658.8+405727 | 16:36:58.82 | +40:57:27.8 | 0.54 | 23.3 | 7.5 | 0.32 0.07 | 0.09 0.03 | 0.41 0.12 | |
| N2_20 | J163658.3+410537 | 16:36:58.31 | +41:05:37.1 | 0.49 | 31.2 | 9.9 | 0.38 0.07 | 0.12 0.03 | 0.41 0.12 | |
| N2_21 | J163658.0+405821 | 16:36:58.07 | +40:58:21.1 | 0.41 | 175.2 | 52.2 | 2.15 0.16 | 0.83 0.07 | 1.39 0.21 | |
| N2_22 | J163656.6+410449 | 16:36:56.63 | +41:04:49.7 | 0.47 | 34.4 | 11.1 | 0.42 0.08 | 0.17 0.03 | 0.24 0.09 | |
| N2_23 | J163656.0+410625 | 16:36:56.04 | +41:06:25.1 | 0.67 | 11.1 | 3.8 | 0.15 0.05 | 0.38 0.12 | ||
| N2_24 | J163655.7+405652 | 16:36:55.72 | +40:56:52.4 | 0.46 | 97.2 | 25.9 | 1.27 0.13 | 0.32 0.05 | 1.53 0.23 | |
| N2_25 | J163655.7+405910 | 16:36:55.79 | +40:59:10.5 | 0.43 | 84.7 | 24.5 | 1.02 0.11 | 0.21 0.04 | 1.47 0.21 | |
| N2_26 | J163655.5+410809 | 16:36:55.56 | +41:08:09.9 | 0.61 | 49.2 | 13.2 | 0.63 0.10 | 0.28 0.04 | ||
| N2_27 | J163655.3+410714 | 16:36:55.37 | +41:07:14.7 | 0.64 | 28.2 | 8.4 | 0.39 0.08 | 0.14 0.03 | ||
| N2_28 | J163655.2+405944 | 16:36:55.21 | +40:59:44.1 | 0.47 | 32.1 | 11.0 | 0.38 0.07 | 0.11 0.03 | 0.38 0.11 | |
| N2_29 | J163655.1+410152 | 16:36:55.16 | +41:01:52.4 | 0.55 | 14.2 | 4.9 | 0.17 0.05 | 0.06 0.02 | ||
| N2_32 | J163653.2+405917 | 16:36:53.26 | +40:59:17.3 | 0.55 | 10.7 | 3.9 | 0.13 0.04 | 0.28 0.10 | ||
| N2_33 | J163651.6+405600 | 16:36:51.69 | +40:56:00.4 | 0.69 | 24.0 | 6.7 | 0.31 0.07 | 0.52 0.14 | ||
| N2_34 | J163650.6+405840 | 16:36:50.63 | +40:58:40.6 | 0.47 | 35.9 | 11.2 | 0.43 0.08 | 0.14 0.03 | 0.39 0.11 | |
| N2_35 | J163649.1+410324 | 16:36:49.18 | +41:03:24.3 | 0.83 | 16.2 | 5.7 | 0.44 0.12 | |||
| N2_37 | J163647.3+410659 | 16:36:47.30 | +41:06:59.0 | 0.50 | 60.2 | 16.9 | 0.78 0.10 | 0.17 0.04 | 1.10 0.19 | |
| N2_38 | J163647.1+410334 | 16:36:47.15 | +41:03:34.8 | 0.42 | 142.6 | 41.1 | 1.79 0.15 | 0.76 0.07 | 0.85 0.17 | |
| Table 2. Chandra sources in the ELAIS N2 field (continued). | ||||||||||
| RA | Dec | Err | Net | Flux ( erg cm-2 s-1) | ||||||
| ID | CXOEN2 | (J2000) | (J2000) | (arcsec) | Cts | S/N | (0.5–8keV) | (0.5–2keV) | (2–8keV) | HR |
| N2_39 | J163646.5+405729 | 16:36:46.57 | +40:57:29.1 | 0.53 | 21.4 | 6.9 | 0.26 0.06 | 0.11 0.03 | ||
| N2_40 | J163645.5+410313 | 16:36:45.51 | +41:03:13.9 | 0.51 | 25.4 | 8.2 | 0.32 0.07 | 0.09 0.03 | 0.33 0.11 | |
| N2_41 | J163644.7+405540 | 16:36:44.73 | +40:55:40.6 | 0.45 | 139.9 | 35.2 | 1.79 0.16 | 0.76 0.07 | 0.69 0.16 | |
| N2_42 | J163644.6+405643 | 16:36:44.68 | +40:56:43.6 | 0.56 | 32.7 | 9.5 | 0.41 0.08 | 0.17 0.03 | ||
| N2_43 | J163642.7+405514 | 16:36:42.71 | +40:55:14.9 | 0.58 | 46.7 | 12.8 | 0.60 0.09 | 0.23 0.04 | ||
| N2_44 | J163641.3+405550 | 16:36:41.35 | +40:55:50.2 | 0.48 | 80.9 | 21.3 | 1.03 0.12 | 0.35 0.05 | 0.86 0.17 | |
| N2_46 | J163639.3+410259 | 16:36:39.34 | +41:02:59.5 | 0.55 | 13.2 | 4.6 | 0.15 0.05 | 0.05 0.02 | ||
| N2_47 | J163636.2+410509 | 16:36:36.21 | +41:05:09.5 | 0.46 | 31.5 | 10.3 | 0.38 0.07 | 0.15 0.03 | 0.27 0.10 | |
| N2_48 | J163633.6+410534 | 16:36:33.66 | +41:05:34.3 | 0.45 | 76.6 | 22.0 | 0.93 0.11 | 0.40 0.05 | 0.52 0.13 | |
| N2_51 | J163630.5+405651 | 16:36:30.54 | +40:56:51.8 | 0.44 | 291.5 | 72.1 | 6.09 0.37 | 1.58 0.14 | 7.54 0.65 | |
| N2_52 | J163629.7+410222 | 16:36:29.71 | +41:02:22.7 | 0.41 | 312.1 | 79.2 | 3.78 0.22 | 1.42 0.10 | 2.60 0.28 | |
| N2_54 | J163628.1+405527 | 16:36:28.13 | +40:55:27.5 | 0.42 | 604.8 | 121.2 | 7.92 0.33 | 2.93 0.14 | 5.78 0.44 | |
| N2_55 | J163627.4+410615 | 16:36:27.47 | +41:06:15.4 | 0.73 | 18.3 | 5.5 | 0.23 0.06 | 0.34 0.11 | ||
| N2_56 | J163625.4+405741 | 16:36:25.46 | +40:57:41.4 | 0.46 | 138.3 | 34.0 | 1.77 0.16 | 0.75 0.07 | 0.76 0.16 | |
| N2_57 | J163623.0+410015 | 16:36:23.07 | +41:00:15.0 | 0.52 | 32.8 | 10.2 | 0.41 0.08 | 0.17 0.03 | 0.25 0.09 | |
| N2_58 | J163622.5+410641 | 16:36:22.54 | +41:06:41.6 | 0.56 | 59.6 | 14.8 | 0.76 0.11 | 0.39 0.05 | ||
| N2_59 | J163622.4+410927 | 16:36:22.49 | +41:09:27.7 | 0.61 | 104.7 | 20.0 | 1.39 0.15 | 0.55 0.06 | 0.74 0.19 | |
| N2_60 | J163619.2+410436 | 16:36:19.23 | +41:04:36.9 | 0.52 | 51.0 | 14.2 | 0.65 0.10 | 0.26 0.04 | ||
| N2_61 | J163618.2+410038 | 16:36:18.23 | +41:00:38.6 | 0.57 | 38.5 | 11.0 | 0.52 0.09 | 0.18 0.04 | 0.39 0.12 | |
| N2_62 | J163616.4+405748 | 16:36:16.42 | +40:57:48.3 | 0.59 | 29.9 | 8.8 | 0.39 0.08 | 0.16 0.03 | ||
| N2_63 | J163615.6+405716 | 16:36:15.60 | +40:57:16.6 | 0.71 | 20.3 | 6.1 | 0.27 0.07 | 0.09 0.03 | ||
| N2_64 | J163614.4+410349 | 16:36:14.46 | +41:03:49.1 | 0.53 | 78.0 | 19.0 | 1.00 0.12 | 0.37 0.05 | 0.72 0.16 | |
| N2_65 | J163612.1+410242 | 16:36:12.16 | +41:02:42.7 | 0.62 | 39.5 | 10.7 | 0.51 0.09 | 0.20 0.04 | ||
| N2_66 | J163606.7+410440 | 16:36:06.79 | +41:04:40.0 | 0.71 | 79.4 | 15.0 | 1.17 0.15 | 0.34 0.05 | 1.15 0.23 | |
| N2_67 | J163555.7+410054 | 16:35:55.72 | +41:00:54.5 | 0.95 | 53.1 | 8.9 | 0.79 0.13 | 0.23 0.05 | 0.53 0.17 | |
| N2_68 | J163725.2+410021 | 16:37:25.26 | +41:00:21.1 | 0.69 | 17.5 | 5.3 | 0.23 0.06 | 0.08 0.03 | ||
| N2_71 | J163710.8+405402 | 16:37:10.81 | +40:54:02.4 | 0.77 | 30.7 | 7.1 | 0.42 0.09 | 0.13 0.03 | ||
| N2_72 | J163657.7+410021 | 16:36:57.74 | +41:00:21.5 | 0.73 | 11.9 | 3.7 | 0.15 0.05 | 0.08 0.02 | ||
| N2_73 | J163635.8+405325 | 16:36:35.86 | +40:53:25.6 | 0.78 | 46.1 | 9.8 | 0.62 0.10 | 0.19 0.04 | 0.35 0.13 | |
| N2_74 | J163632.9+411111 | 16:36:32.95 | +41:11:11.4 | 0.88 | 53.2 | 10.0 | 0.72 0.11 | 0.29 0.05 | ||
| N2_75 | J163632.7+410513 | 16:36:32.78 | +41:05:13.7 | 0.69 | 20.4 | 6.2 | 0.25 0.06 | 0.32 0.11 | ||
| Table 2. Chandra sources in the ELAIS N2 field (continued). | ||||||||||
| RA | Dec | Err | Net | Flux ( erg cm-2 s-1) | ||||||
| ID | CXOEN2 | (J2000) | (J2000) | (arcsec) | Cts | S/N | (0.5–8keV) | (0.5–2keV) | (2–8keV) | HR |
| N2_76 | J163632.6+410552 | 16:36:32.64 | +41:05:52.7 | 0.65 | 12.7 | 4.2 | 0.15 0.05 | 0.05 0.02 | ||
| N2_77 | J163625.2+410228 | 16:36:25.25 | +41:02:28.2 | 0.68 | 12.3 | 3.9 | 0.15 0.05 | 0.31 0.11 | ||
| N2_78 | J163624.1+410821 | 16:36:24.12 | +41:08:21.2 | 0.77 | 36.3 | 8.3 | 0.47 0.09 | 0.17 0.04 | ||
| N2_79 | J163620.6+405714 | 16:36:20.68 | +40:57:14.8 | 0.75 | 24.7 | 7.1 | 0.32 0.07 | 0.55 0.14 | ||
| N2_80 | J163617.9+405636 | 16:36:17.96 | +40:56:36.5 | 0.72 | 30.1 | 8.0 | 0.40 0.08 | 0.08 0.03 | 0.39 0.12 | |
| N2_81 | J163731.1+410410 | 16:37:31.15 | +41:04:10.8 | 0.87 | 21.7 | 5.4 | 0.31 0.08 | 0.09 0.03 | ||
| N2_82 | J163718.1+410600 | 16:37:18.16 | +41:06:00.1 | 0.72 | 11.0 | 3.7 | 0.14 0.05 | 0.05 0.02 | ||
| N2_83 | J163717.6+410324 | 16:37:17.66 | +41:03:24.1 | 0.83 | 11.7 | 3.9 | 0.17 0.06 | 0.09 0.03 | ||
| N2_84 | J163708.3+410526 | 16:37:08.37 | +41:05:26.0 | 0.72 | 11.2 | 3.9 | 0.15 0.05 | |||
| N2_85 | J163648.0+410354 | 16:36:48.04 | +41:03:54.9 | 0.71 | 10.8 | 3.6 | 0.14 0.05 | 0.27 0.10 | ||
| N2_86 | J163633.7+411102 | 16:36:33.71 | +41:11:02.4 | 0.83 | 42.6 | 9.0 | 0.61 0.11 | 0.19 0.04 | 0.76 0.20 | |
| N2_87 | J163627.6+405416 | 16:36:27.62 | +40:54:16.1 | 0.99 | 20.8 | 5.0 | 0.30 0.08 | 0.10 0.03 | ||
| N2_88 | J163616.0+405500 | 16:36:16.01 | +40:55:00.9 | 0.82 | 57.2 | 11.9 | 0.94 0.14 | 0.30 0.06 | 0.62 0.18 | |
| N2_89 | J163615.0+405639 | 16:36:15.03 | +40:56:39.3 | 0.81 | 18.5 | 5.3 | 0.26 0.07 | 0.07 0.02 | ||
| N2_90 | J163612.3+410731 | 16:36:12.34 | +41:07:31.3 | 0.81 | 48.7 | 9.5 | 0.66 0.11 | 0.18 0.04 | 0.38 0.13 | |
| N2_91 | J163604.3+405646 | 16:36:04.31 | +40:56:46.8 | 0.99 | 22.9 | 5.5 | 0.32 0.08 | 0.09 0.03 | ||
| N2_92 | J163559.3+410116 | 16:35:59.30 | +41:01:16.0 | 0.73 | 14.7 | 4.3 | 0.21 0.06 | 0.09 0.03 | ||
| N2_93 | J163735.5+410448 | 16:37:35.54 | +41:04:48.9 | 0.97 | 28.4 | 6.5 | 0.39 0.09 | 0.13 0.03 | ||
| N2_94 | J163734.5+405046 | 16:37:34.51 | +40:50:46.7 | 0.95 | 395.9 | 22.4 | 5.92 0.39 | 1.78 0.14 | 5.54 0.67 | |
| N2_96 | J163608.4+410404 | 16:36:08.45 | +41:04:04.1 | 0.73 | 13.3 | 4.2 | 0.19 0.06 | 0.08 0.02 | ||
| N2_97 | J163602.6+405927 | 16:36:02.66 | +40:59:27.3 | 1.03 | 26.0 | 5.7 | 0.35 0.08 | |||
| N2_98 | J163623.4+410859 | 16:36:23.47 | +41:08:59.0 | 0.88 | 27.9 | 6.3 | 0.37 0.08 | 0.06 0.02 | 0.40 0.13 | |
| N2_99 | J163734.5+405212 | 16:37:34.56 | +40:52:12.8 | 1.12 | 108.3 | 8.5 | 1.53 0.22 | 0.59 0.08 | — | |
| N2_100 | J163729.9+405349 | 16:37:29.99 | +40:53:49.3 | 1.04 | 23.9 | 4.1 | 0.34 0.10 | 0.20 0.05 | — | |
| N2_101 | J163633.8+410731 | 16:36:33.84 | +41:07:31.0 | 0.86 | 15.4 | 4.7 | 0.21 0.06 | |||
| N2_102 | J163725.6+405811 | 16:37:25.68 | +40:58:11.0 | 0.83 | 12.4 | 4.9 | 0.47 0.14 | 0.19 0.06 | ||
| N2_103 | J163639.9+405322 | 16:36:39.97 | +40:53:22.8 | 0.98 | 14.1 | 4.2 | 0.19 0.06 | |||
| N2_104 | J163640.7+410449 | 16:36:40.77 | +41:04:49.8 | 0.76 | 10.6 | 3.5 | 0.13 0.05 | |||
| N2_105 | J163640.9+410840 | 16:36:40.90 | +41:08:40.7 | 0.71 | 12.3 | 4.0 | 0.16 0.05 | |||
| N2_106 | J163642.3+410520 | 16:36:42.33 | +41:05:20.8 | 0.75 | 11.1 | 3.5 | 0.14 0.05 | 0.05 0.02 | ||
| N2_107 | J163608.4+410507 | 16:36:08.41 | +41:05:07.0 | 0.86 | 12.1 | 3.4 | 0.18 0.06 | 0.10 0.03 | ||
| N2_108 | J163613.4+405806 | 16:36:13.45 | +40:58:06.4 | 0.82 | 9.7 | 3.2 | 0.13 0.05 | |||
| N2_109 | J163730.7+405152 | 16:37:30.77 | +40:51:52.6 | 1.23 | 31.2 | 3.9 | 0.44 0.13 | — | — | |
| N2_110 | J163708.0+410840 | 16:37:08.04 | +41:08:40.1 | 1.31 | 8.3 | 3.2 | 0.08 0.03 | |||
| N2_111 | J163627.5+410228 | 16:36:27.50 | +41:02:28.6 | 0.59 | 7.1 | 3.2 | 0.05 0.02 | |||
| N2_112 | J163723.8+410133 | 16:37:23.83 | +41:01:33.3 | 0.88 | 7.6 | 3.1 | 0.06 0.02 | |||
| N2_113 | J163621.4+410049 | 16:36:21.42 | +41:00:49.9 | 0.98 | 10.0 | 3.4 | 0.30 0.11 | |||
| N2_114 | J163631.8+410432 | 16:36:31.82 | +41:04:32.7 | 0.59 | 7.6 | 3.1 | 0.24 0.09 | |||