Gravitational Settling of 22Ne in Liquid White Dwarf Interiors—Cooling and Seismological Effects
Abstract
We assess the impact of the trace element on the cooling and seismology of a liquid C/O white dwarf (WD). Due to this elements’ neutron excess, it sinks towards the interior as the liquid WD cools. The subsequent gravitational energy released slows the cooling of the WD by 0.25–1.6 Gyrs by the time it has completely crystallized, depending on the WD mass and the adopted sedimentation rate. The effects will make massive WDs or those in metal rich clusters (such as NGC 6791) appear younger than their true age. Our diffusion calculations show that the mass fraction in the crystallized core actually increases outwards. The stability of this configuration has not yet been determined. In the liquid state, the settled enhances the internal buoyancy of the interior and changes the periods of the high radial order -modes by 1%. Though a small adjustment, this level of change far exceeds the accuracy of the period measurements. A full assessment and comparison of mode frequencies for specific WDs should help constrain the still uncertain diffusion coefficient for the liquid interior.
1 Introduction
After and , the most abundant nucleus in a white dwarf (WD) interior is . The reason for this starts with the physics of the CNO cycle in the hydrogen burning phase of a star’s life. The slowest step in the CNO cycle is the proton capture onto and almost all of the CNO catalyst nuclei end up as at the completion of burning. The reaction sequence during the subsequent helium burning then processes all the into . This results in a mass fraction of for recently formed WDs of (see, for example, Umeda et al. (1999)) made from stars of initial mass .
The possibility that could play a role in the energetics of a cooling WD was first noted by Isern et al. (1991). They discussed the possibility of gravitational energy release if phase separates at core crystallization. This was followed by more detailed studies (Xu & Van Horn, 1992; Ogata et al., 1993; Segretain et al., 1994; Segretain, 1996) which differed in their conclusions about the final state once crystallization was complete; ranging from all the in the stellar center to most of it having an unchanged profile. Bildsten & Hall (2001) (hereafter BH01) examined another aspect of which had been previously overlooked (except for a brief mention in Bravo et al. 1992), namely its ability to sink through the liquid WD interior.
As discussed in BH01, there is an upward pointing electric field of magnitude in the degenerate WD interior, where is the local gravitational acceleration and is the proton mass. The net force on is therefore , biasing the diffusion of inward. It is the excess neutrons of the nucleus (relative to the predominant nuclei, being the atomic mass number and the charge) that make it special in this regard. BH01 found that the gravitational energy released by sedimenting is comparable to the thermal content of the WD at an age of a few Gyrs. This raised the question of whether could settle fast enough to significantly affect the WD’s cooling significantly.
The rate at which sinks in the liquid C/O WD depends on the diffusion coefficient, . The conditions there are very non-ideal, as the average Coulomb energy for the ions is comparable to the thermal energy, or , where . As discussed by Paquette et al. (1986), there is substantial (factors of many) uncertainty in the diffusion coefficients in these liquid regimes, as the familiar notions of mean free path lose their meaning. In the absence of a definitive calculation of for this situation, BH01 proceeded by estimating for in a C/O plasma by the self-diffusion coefficient, , of the classical one-component plasma (OCP). With this, BH01 then estimated the power released, , by sinking for a fixed profile. This calculation suggested that sedimentation might release sufficient energy to impact WD cooling.
We now take the next step in addressing this question by performing a self-consistent evolution of both the density, , and the WD core temperature, , in WDs composed of a single dominant ion species. We find that heating delays the time it takes a WD to cool to a given luminosity. The total increase in cooling age by the time the WD completely crystallizes ranges from 0.25-1.6 Gyr, depending on the value of and the WD mass.
We also investigate the seismological impact of the abundance profile at the time the WD crosses the ZZ Ceti instability strip. The gradient in abundance produces a gradient in the electron mean molecular weight, , that provides an additional buoyancy and alters the Brunt-Väisälä frequency, . This contribution alters the pulsation periods of high radial order g-modes by more than the measurement errors. Thus gradient contributions from sedimenting cannot be ignored in precision WD pulsation work such as recent contraints on the interior abundance profiles (Bradley, 2001) or reaction rate (Metcalfe et al., 2001).
An unexpected result of our calculations is the interaction between the infalling and the outward moving crystal/fluid boundary as the WD cools. We assume that sedimentation halts in the crystalline interior, forcing to accumulate at the crystal/fluid boundary and elevating the abundance there. This abundance is then frozen as the crystal front moves outward. The jump in abundance at a given location depends on both the rate of infall and the rate at which the crystal front moves outward. This leads to an abundance in the crystal regions of the star that increases outward. Whether or not this profile is subject to an elastic Rayleigh-Taylor instability remains an open question.
In 2, we cover the details of how we model the evolution of the density, , and the WD core temperature, . We also discuss the current uncertainties in the OCP self-diffusion coefficient used to calculate our flow rates. The details of the numeric evolution of are in 3. In §4 we detail the results of our self-consistent calculations. We first discuss the evolution of , highlighting the influence of , WD mass, and crystallization on the adundance profiles. We then turn to the thermal evolution of the WD and present our new cooling curves. With the abundances in hand, we estimate in §5 the impact can have on WD pulsations, focusing on high radial order g-modes. We close in §6 with a summary of our results and a discussion of unanswered questions. The appendix discusses the Brunt-Väisälä frequency in the deep interior.
2 Density Evolution in a Cooling White Dwarf
The WD interior is a plasma of very degenerate electrons whose corresponding ions may be either in a liquid or crystalline state. For our calculation, we presume that the WD is composed a one component plasma (OCP) of ions whose is between 12 and 16 and whose . We treat as a trace species throughout the entire calculation, therefore neglecting its effect on the hydrostatic structure of the WD as the models evolve. As can be seen from the initial composition profile of a realistic pre-WD model shown in Figure 1, the trace assumption is valid initially and we find that it remains valid at all times considered in our calculations. The physical state of the ions is specified by the parameter,
| (1) |
where g cm-3. For , the plasma is in a liquid state. The plasma undergoes a phase transition from the liquid to crystalline states once (Farouki & Hamaguchi, 1993).
2.1 Diffusion and Sinking
The concentration evolution is governed by mass continuity
| (2) |
where and are the local density and flux respectively. The flux has two pieces; the diffusive flux caused by density gradients and the drifting flux caused by the inward force, , on ,
| (3) |
where is the diffusion coefficient of in the background plasma and is the magnitude of the local drift velocity. We assume that is no longer able to sink once the WD has crystallized and fix the concentration of the crystal to be that of the fluid just prior to crystallization. Thus we do not consider concentration changes due to fractionation upon freezing (see, for example, Mochkovitch (1983); Isern et al. (1991)).
As mentioned in BH01, the microphysical calculation of the diffusion coefficient of through a plasma that is representative of WD interior conditions has not yet been performed. A proper treatment involves the calculation of a trace species diffusing through a multi-component plasma in both the classical and quantum liquid regimes. The latter will be important in the higher mass WDS, where the core becomes a quantum liquid long before crystallization starts (i.e. while the core is still liquid, ; Chabrier, Ashcroft, & DeWitt (1992)). In light of these uncertainties, BH01 estimated in two ways. The first was using the Stokes-Einstein relation for a particle of radius (taken to be the radius of the charge neutral sphere around ) undergoing Brownian motion in a fluid of viscosity , which gives when the fluid is allowed to “slip” at the particle/fluid interface. This estimate works well in liquids, where it is accurate at atomic dimensions (Hansen & McDonald, 1986). The second was to use the self-diffusion coefficient
| (4) |
calculated by Hansen, McDonald, & Pollock (1975) for the OCP, where is the ion plasma frequency. These two estimates differ by 20-40 %.
In addition, there is still uncertainty in the OCP self-diffusion coefficient in the regime of interest. To highlight these uncertainties in , we consider calculations of the OCP shear viscosity, , which are related to the OCP self-diffusion coefficient via the Stokes-Einstein relation. A summary of shear viscosity calculations for the OCP are presented in Figure 2, where we show the reduced viscosity, as a function of . The results represent a range in calculation techniques—Monte Carlo (Viellefosse & Hansen, 1975), kinetic theory (Tanaka & Ichimaru, 1987), and molecular dynamics (Donkó & Nyíri, 2000). Tanaka & Ichimaru (1987) considered a glassy state above the normal crystal transition point, thus their data extends to . Error bars are displayed when there was sufficient information in the literature to determine them. Between these results, there is disagreement on the 10-30% level. The solid line displays the analytic result of the OCP (no-screening) limit of the Yukawa system as calculated by Murillo (2000). The dotted line shows our fit to the data that reproduces the reduced viscosity implied from of equation (4) and the Stokes-Einstein relation in the regime while approximately fitting the data in the of Tanaka & Ichimaru for . This fit is given by
| (5) |
The first term in equation (5) is the relation between and inferred from equation (4). We utilize this fit to explore the consequences of WD interiors not crystallizing but instead undergoing a transition to a glassy state.
With all of these uncertainties in mind, we follow BH01 and take as our fiducial best guess for the diffusion coefficient. But, as we consider the actual value of to be uncertain even in the case of diffusing in a single component plasma, we carry out calculations with , , and to determine to what extent a reasonable variation in the diffusion rate may alter the impact of sedimentation. Although the actual may be less than , we only consider here since for , the impact of on WD evolution is irrelevant. The variation of up to 10 times is probably large for the more typical low mass WDs, but for the more massive WDs, where the interior plasma can be a quantum liquid over a substantial portion of the WD before it crystallizes, the use of the classical OCP formula may be seriously in error.
Once is specified, the downward drift velocity, , of the ions under a macroscopic force is
| (6) |
where the latter equality holds for . This is the approximation we use to determine in our calculations. As over most of the stellar radius, the motion of is dominated by falling at the local drift velocity set by equation (6) (BH01). Equation (6) also allows a rough estimate of the sedimentation timescale. The time it takes a ion to sink from the surface to the center of a constant density star when it falls at the rate given by equation (6) is
| (7) |
(BH01). Using the central densities as an estimate, a pure oxygen(carbon) WD at has , so that complete sedimentation is unlikely for the most common WDs. However, the strong density dependence means that this time decreases for massive WDs. For example, a pure oxygen WD at has .
One caveat of our specification of the relation between and should be mentioned. Our WD model is constructed using a fully degenerate EOS everywhere (with no inclusion of ion contributions in the structure calculation) and we take initially the mass fraction to be =0.02 everywhere. This choice of model and profile confines us to the WD interior where the electron Fermi energy . Modeling the outer non-degenerate parts of the star requires a more accurate background model and electric field calculation. Since we are most interested here in the overall energetics, we can safely neglect the role of the thin outer layers.
2.2 White Dwarf Thermal Evolution
Our WD model consists of a plasma of a single predominant ion species plus a trace amount of at a local number density of . The energetics included are the heat provided by sedimentation, latent heat released upon crystallization of the major species, and the WD’s radiative losses. Since we are modeling the late ( Myr) evolution, we neglect the slight gravitational energy release as the WD contracts to its final radius. Also, other potential heat sources such as the potential H burning in the inner envelope and fractionation effects are not included for the sake of simplicity as our goal here is to demonstrate the potential impact of sedimentation separated from other sources of uncertainty in WD cooling.
The net power generated per ion by the sedimentation process is , where is the bulk velocity of the flow. This quantity is different from the drift velocity since we must take into account both diffusive and drifting currents. Thus and the net gravitational energy release is given by
| (8) |
where . The latent heat released upon crystallization is per nuclei (Salaris et al., 2000). For the energy lost to radiation, we use the relations of Althaus & Benvenuto (1998). For the heat capacity of the liquid state, , we use equation (17) of Potekhin & Chabrier (2000) which takes into account the ideal ion and ion-ion interactions. We neglect the small electron contributions to the heat capacity. Quantum liquid effects are not taken into account. In the solid state we utilize equation (5) of Chabrier (1993).
Since the thermal conduction time across the WD core is much less than the evolution time, we treat all energy sources and sinks as global quantities. The thermal evolution of the instantaneously isothermal WD at temperature is then
| (9) |
where is the mass of the WD that has crystallized.
3 Numerical Calculation of Diffusion
For a spherically symmetric flow, equation (2) reads
| (10) |
We discretize equation (10) according to the prescription
| (11) |
(Press et al., 1992). Here the superscripts refer to the time index and subscripts the spatial index and the factors of two come about from the averaging of between adjacent cells. The first two terms give the diffusive fluxes through the top and bottom of the mass shell at radius . The second two terms give the same for the drifting fluxes. The boundary conditions are at , where is the WD radius. We use instead of concentration as our dependent variable since this simplifies the form of the continuity equation.
The rate at which flows through the interior is completely determined by . In the liquid regions of the star, we set (equation (4)). The dependence of means that as the WD cools, , and hence , decrease and flow slows. We expect diffusion to halt in regions of the WD that have crystallized. There is thus an abrupt transition in the flow rate at the crystal/liquid interface. Combined with the fact that the neon concentration is fixed behind the crystal/liquid boundary, the crystallizing of the WD leaves a significant imprint on the concentration profile in the star, as we discuss in §4.1.
In order to avoid numerical difficulties, we handle the transition in the value of to zero in crystallizing regions by smoothing the transition with the formula
| (12) |
Here sets the factor by which is reduced from in the crystalline state and sets the width in over which the transition from liquid to crystal occur in the shell.
By smoothing out the transition from liquid to crystal states, we effectively resolve the propagation of the crystal/liquid boundary within a single shell of our grid in the sense that it now takes a finite time for the shell to go from fully liquid to fully crystalline. This is important because the width of the transition region affects the profile near the crystal/liquid boundary. We choose so that the time it takes for each shell to transition from liquid to crystal (the transition regime being defined by ) equals the amount of time it takes the crystal front to move across the shell. An easy way of approximating is to consider the at which the adjacent cells in our grid crystallize. These two temperatures set the lower and upper bounds of the range in in the between which the cell undergoes crystallization. From this is determined by the simple relation
| (13) |
where . For our models, the right hand side of equation (13) is and . We presume that the latent head is released instantaneously when in the shell.
As mentioned prior, we also utilize the diffusion coefficient implied by the Stokes-Einstein relation and equation (5) to calculate the effects of diffusion in WDs if the interior plasma undergoes a glassy transition instead of crystallizing. In the glassy state, we expect diffusion to continue. Thus sedimentation will continue to generate energy long past the time when sedimentation would have stopped in a crystallized WD. Obviously, such a process has the potential to maintain a WD at a higher luminosity than it otherwise would have at very late times. We explore this possibility in section 4.3.
Before including the thermal evolution of the WD, we performed checks on the accuracy of our algorithm at constant in a mass WD. The motion of over most of the WD is dominated by falling at the local drift speed, , allowing an analytical calculation of the concentration as a function of time by considering only the drift contributions to the flux. We consider the in a thin shell (at radius and thickness ). From we calculate the position at later times of ions starting at the inner and outer boundaries of this shell. Then, the new in the shell can be calculated from the old , , and and the new and . The resulting at Gyr is displayed in Figure 3 along with the full numerical results at the same WD age. The lower panel of the plot displays the relative difference between the two calculations, which show a good agreement in the inner regions of the WD.
We also compared the numeric and analytic results for the diffusive equilibrium of . With and specified, the profiles in diffusive equilibrium () is given by
| (14) |
which gives
| (15) |
with normalized by total mass. A comparison between this expression and the equilibrium reached in the numeric integration shows very good agreement.
4 Self-Consistent Diffusion and WD Cooling
We utilize equation (11) and the discretization of equation (9)
| (16) |
to perform the mutual evolution of and numerically. Here , , , and are the luminosity, central temperature, total heat capacity of the WD, and latent heat released during the timestep. In what follows we consider a WD composed of a single ion species as the background. Figure 1 is typical of the C/O ratio in WD interiors predicted by stellar evolution models. We can approximate this composition profile by performing calculations taking the entire star to have a mean molecular weight throughout. Therefore we consider in greatest detail the results for models with this composition.
4.1 Density Evolution in Cooling WDs
In Figure 4 we show the profile evolution in the C/O WD when for 5 different epochs. The initial profile is a horizontal line at . The major qualitative result of the evolution is a significant depletion in the concentration in the outer layers of the WD, where the rate of sinking is largest. Elsewhere through the star, other than a gradual increase with time, the concentration is not much affected, at least as long as the WD remains in the liquid state. This is to be expected since the sedimentation time for a low mass WD is much longer than the cooling time.
The sedimentation rate is affected by both and . We show in Figure 5 a comparison of the profiles in our 0.6 C/O WD at 1 Gyr for various values of . As expected, the larger values of lead to more rapid sedimentation and a faster depletion of in the outer layers of the WD and a stronger gradient in the concentration as compared to . Since the sedimentation time decreases with density, settles out at a faster rate in more massive WDs. Figure 6 shows the concentrations at several ages for a 1.0 C/O WD. Two effects compared to the lower mass WD are apparent. First, as expected, the rate of sedimentation is greater leading to much faster depletion in the outer regions and accumulation in the central ones. But, second, the WD begins crystallizing much sooner (since the Coulomb interactions are greater) and the star finishes crystallizing at a much younger age. This limits the extent to which is able to settle inward before being frozen in place.
The depletion of in the outer layers of the WD may play a role in setting the inter-diffusion properties of /and at the core-envelope boundary. All three of these species have and the macroscopic forces acting them are approximately equal, at least in the degenerate regions of the WD. In these regions, significant mixing of and the /in the core should occur, at least on timescales much longer than typical diffusion times. However, with present, the of the core is slightly larger than that of the envelope and may be excluded from penetrating into rich regions. But, as is evacuated from the outer layers of the core, the buoyant barrier created by gradients between the core and envelope is removed. Thus sedimentation might set a natural limit on the depth to which can inter-mix with the core plasma, but further work needs to be done to verify if this is truly the case.
The time, , it takes for the to evacuate the outer layers of the WD can be approximated by integrating equation (4) of BH01
| (17) |
over the outer regions of the WD, where we can take constant and the pressure to be dominated by non-relativistic, degenerate electrons. If we make the further assumption that the layer is isothermal over the time it takes a ion to fall between the limits of the integral, we find that
| (18) |
where is the value of at the mass coordinate , is the mass outside of the depth of the ion, and is the WD mass. Equation (18) is equivalent to equation (6) from BH01, but expressed in terms of mass coordinates. Of interest is the approximate time that it takes the to be depleted from the outer of the WD—that is from a region of roughly the same mass as the layer on the WD. Taking a 50/50 mixture of /in the outer core of the WD, equation (18) gives , where at these times in the outer WD . Thus within several Gyrs, any barrier to significant penetration into the core should be removed.
4.2 Profile at the Crystal/Liquid Boundary
Crystallization leaves an imprint on the profile. The location of the outward moving crystal/fluid boundary can be seen in Figure 4 where the jump in concentration in the 3 and 4 Gyr profiles occurs. This jump is a result of the halting of sedimentation in crystallized regions of the star. At the crystal/fluid interface, ions falling through the liquid portion of the star encounter the impenetrable crystal boundary and accumulate. As the star cools, the location of the crystal/fluid boundary moves outward, freezing the concentration at the level to which it has accumulated.
The question then arises as to what determines the magnitude of the jump in concentration at the crystal/fluid boundary, and therefore fixes the profile in the crystal portions of the WD. Consider a thin region of thickness in front of the crystal/fluid boundary, located at a radius . At this location, the boundary position is moving outward at a rate , the falls towards the interface at a velocity and has a density of . In the time it takes the crystal boundary to cross the region , the total mass of that flows into this region is
| (19) |
The density in the shell between and after freezing is then
| (20) |
or defining
| (21) |
since .
This analysis is valid as long as both and are constant over the time it takes to crystallize the shell. Both conditions are satisfied when , i.e. when . Equation (6) gives as a function of , the velocity,, is calculated by considering the density, , at which for a given . Then is given by
where is the inter-ion spacing defined in section 1. This evaluates to
| (22) |
where represents the net rate of energy loss in the WD due to all sources and sinks and is calculated from the WD’s .
The ratio determines the density jump across the liquid/crystal boundary. How this ratio changes over the WD interior determines the gradient in the concentration profile in the crystalline state. A plot of for the models under consideration is shown in Figure 7. The increase in this ratio outward is due to an increasing near the surface where decreases. This leads to an inverted concentration profile in the crystalline portion of the WD seen in Figure 4. This abundance profile could well be destabilizing, as is increasing outwards. However the linear stability is complicated by the elastic shear of the crystalline state, which might stabilize a profile that would otherwise be Rayleigh-Taylor unstable. Further calculations are needed to resolve this question.
One may also ask the question of how the increase in at the crystal/fluid boundary affects the role that fractionation plays in WD cooling. Current thought is that under conditions typical of WDs, a C/O/plasma has liquid and solid phases of equal concentration (Segretain, 1996). When the WD starts to crystallize, the resulting phases are an O rich solid and C rich liquid. The solid is the denser phase and an O rich solid core forms. It is not until the temperature of the plasma is reduced to 1.12 times the freezing temperature of the pure carbon plasma that fractionation begins to occur. According to Segretain (1996), by this time 70% (by mass) of the WD has already crystallized and the additional effects of Ne distillation (see Segretain et al. (1994)) on the cooling process is small. If the results of Segretain (1996) (i.e. his Figure 1) are correct, the small increase in concentration at the crystal/fluid boundary will not change this scenario. To do so would require concentrations of order , far above the additional increase in at the crystal/fluid boundary exhibited here. Thus, we do not expect sedimentation to alter the picture developed to date of the role of fractionation in WD cooling.
We have only considered WD models of a single ion species. More realistic models with varying composition may have interesting effects on the profile in the star. For example, we expect that the viscosity of the interior plasma to increase with increasing mass fraction which produces a corresponding change in . In regions where the composition is rapidly changing, for example near 0.5 in Figure 1, sharp spikes in the composition may occur when the region crystallizes. The rapid variation in composition may effect the flow rates sufficiently in the liquid state to cause local increases in concentrations at this stage also. Another way in which the profile could be altered is through fractionation of the C/O/plasma when crystallization occurs, an effect that we have ignored in this paper. A full calculation including sedimentation and full consideration of the 3 component plasma phase transition is needed to answer the question of how much this may change the final profile in the WD.
4.3 Effects of Sedimentation on WD Cooling
The effects of sedimentation on WD cooling are summarized in Figures 8 and 9. Figure 8 shows the instantaneous power generated by sedimentation, , in comparison with the luminosity of the WD (dash-dot line) as a function of core temperature. Shown are the produced for pure and pure (solid and dashed lines respectively) stars as well as a comparison between calculations performed with and (lower and upper sets of curves). The results for a C/O WD are between the and WD curves. The effect of crystallization in halting the sedimentation is seen in the sharp change in slope for the curve near K. Since , it is seen that this WD always cools. Thus, in the case of low mass WDs, the possibility for sedimentation to provide a WD’s luminosity seems unlikely, at least if WDs crystallize as they cool.
In addition, the results for a C/O WD that has a phase change to a glassy state at high values is shown for both masses by the dash-dot line. As mentioned before, in this case was calculated from equation (5) and the Stokes-Einstein relation. That sedimentation continues to generate energy at late time is quite obvious, and in the case of a WD can dramatically affect the WD’s late evolution.
Concentrating on the 0.6 , curves for a moment, is substantially less than over most of the evolution of the WD and the effects of sedimentation on WD cooling take some time to become apparent. This is seen in Figure 9 where a comparison between the cooling with and without settling is shown. Not until after about 4 Gyr is there a substantial difference in the cooling age of this model. The fact that the low mass WDs crystallize slowly combined with slow sedimentation cause the delays from sedimentation to increase until the WD is completely crystalline (which occurs at about in this model). The total delay in cooling that occurs for this model is about 0.25 Gyr by 10 Gyr. We also indicate the approximate location of the ZZ Ceti instability strip in this figure by the horizontal dashed line. The profile at the time at which the WD crosses this location is needed to determine the potential effects that sedimentation may have on the seismological properties of the star (see §5).
As found by BH01, the competition between the heating due to and the energy output of the WD is much closer in the more massive WDs, as exemplified by the 1.0 model in the lower panel of Figure 8. However, in all cases we examined (including calculations with in the 1.0 model), the power generated by sedimentation never exceeded the luminosity of the WD. Thus it appears improbable in all but maybe the most massive WDs that sedimentation would be able to power the WD. However, the early competition between the heating and radiative losses does show up in the cooling curves as will be seen in a moment.
The overall impact of on the cooling of the more massive WDs due to this rapid sedimentation is mitigated by the equally rapid crystallization in these stars, as exhibited by the earlier turnover in the curves in these models. We can also see a qualitative differences in the effect of sedimentation on differing mass models from this plot. In the lower mass WDs, sedimentation is a slower, enduring process which takes substantial time to compete with cooling at a significant level. But, in this case stays competitive with for a longer period of time. For the higher mass stars, sedimentation is fast and is large initially but drops off quickly.
In the 1.0 model, the exhibits the effects of rapid depletion in the outer layers of the WD. The extremely rapid sedimentation in this model leads to a large delay in the cooling time early on as compared to the other models which include sedimentation effects. But, as the is depleted from the outer layers in this model, energy generation due to sedimentation decreases compared to the models with smaller diffusion coefficients and the relative delays between them decrease at late times.
The effects of these differences are seen in the cooling curves shown in Figure 9. For clarity, data is only shown for WDs with ; results for pure and WDs bracket these results. Both plots show the effects of varying over the range of along with a model that neglects (the bottom curve in each) and a model that undergoes a transition to a glassy state instead of crystallizing (dotted curve).
As could be expected from Figure 8, the delays introduced in the model only grow significant at late times, whereas those of the model are apparent early. These delays continue until the WDs have almost fully crystallized, which occurs by the time for the models. A summary of the increase in cooling ages, , for these models is in Figure 10. Each panel shows the difference between the age of our models with (solid lines, bottom to top, respectively) and one without diffusion included. In the 1.0 model, the early termination of increases in in the and models as compared to the model is the results of rapid depletion of in the outer layers of the WD. So, there is little left to sediment out in the remaining liquid regions of the WD before the WD completely crystallizes.
The dash-dot line in Figure 10 shows the difference in age between the reference model and a WD that undergoes a glassy transition. For a period while the reference model is undergoing crystallization, the glassy WD model is actually younger than the reference model. The explanation for this is that the glassy WD does not liberate latent heat, which is a much more significant quantity of energy while the reference star is crystallizing. Once the crystallization process is finished, the continued release of energy from sedimentation in the glassy WD produces the age increases seen (at least in combination with the rapid cooling that the crystallized WD undergoes once it enters the Debye cooling regime). In the glassy WD models, the increase in WD age for a given luminosity continue to increase indefinitely and would lead to an abundance of faint WDs greater than would otherwise be expected.
4.4 Cooling WDs in Metal Rich Clusters
From equation (8), the power generated by sedimentation is proportional to number density. The delays in cooling time produced by sedimentation will thus vary with the metallicity of the WD progenitor. A particular example where this may be observationally relevant is the open cluster NGC 6791. NGC 6791 is interesting both because is it old ( Gyr) and metal rich, (Chaboyer, Green, & Liebert, 1999). Figure 11 shows a comparison in the generated in the 0.6 WD models whose progenitor’s metallicity were solar (as in the prior calculations) or , as is appropriate for WDs within NGC6791. Shown in Figure 12 is the comparison of cooling curves between these WDs. As is readily seen, WDs whose progenitors were metal rich will be more affected by the effects of sedimentation. This will be especially true if is significantly larger than our fiducial best guess of .
Can this seen? Most likely, yes, if a massive () is found, as these should be equal in age to the cluster since their massive progenitors had such short lives. Figure 13 shows the location of a WD in the cluster CMD for different values of but all at a fixed age of 8 Gyr. The deceleration of the aging process is evident, as the model is mags brighter than the model without diffusion included. For comparison the effects on the more typical lower mass WDs are also shown.
The fact that sedimentation’s effects on the WD cooling sequence is metallicity dependent also provides the most straightforward means of separating it from other uncertainties in WD cooling. To our knowledge, no other uncertainty has as significant dependence on the metal content of the WD as sedimentation. The only other effect that might is the fractionation of during crystallization. But, according to Segretain (1996), the extent to which this effect matters is much smaller than that due to C/O fractionation and in any case occurs only after the larger portion of the WD has crystallized.
Separating the delays in WD cooling due to from other contributions is difficult in the absence of observational comparisons between metal rich and metal poor WDs. In the low mass WDs, at the point where ’s effects become apparent, the star has already begun crystallizing and the uncertain energy releases from fractionation can occur. In the high mass stars, especially for large diffusion rates, there is a window between 1-4 Gyrs in which sedimentation can have an extremely significant impact on the cooling age of the WD. To be fair, here again, crystallization has already started in these stars, but the potential magnitude of contributions may allow separation of and fractionation effects.
Although not yet feasible, potentially the clearest test of sedimentation’s impact on WD cooling in particular, and WD cooling theory in general, would be the construction of empirical cooling curves for WDs of specified masses. As the overall morphology of the cooling curves can depend on which effects are included and their magnitudes, this may provide at least a qualitative means of determining empirically which phenomenon are operative in WDs. Such a comparison would require a large sample of confirmed WDs homogeneous in mass and metallicity and whose cooling ages are determined independently of their luminosity.
5 Enhanced Internal Buoyancy from the Abundance Profile
Typical abundance profiles at the time our WD models reach the ZZ Ceti instability strip are shown in Figure 14. The abundance gradient in creates a gradient in the mean molecular weight per electron, , that provides an extra restoring force for the g-modes. We now show that this modifies the pulsation periods at levels comparable to the uncertainties of the measurements. To see this, we start with the Brunt-Väisälä frequency
| (23) |
(Unno et al., 1989) where is one of the adiabatic indices. For an isothermal background of degenerate, relativistic electrons, and an ideal ion gas (the Coulomb corrections to are small; Bildsten & Cutler (1995)) and a gradient that depends only on the gradients of the trace , we find (see Appendix)
| (24) |
where and is the ion mean molecular weight. The first piece is the thermal contribution to (previously known to be small in the deep interior; Brassard et al. (1991)) while the second is the contribution.
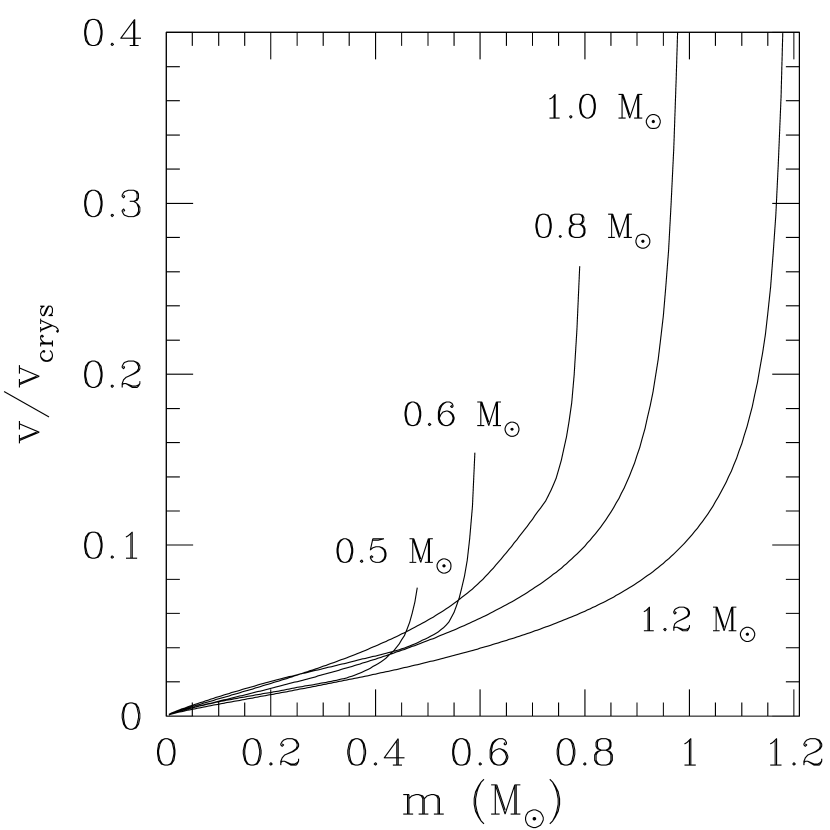
Figure 15 shows for a 1 WD with for and at the point its K (The ages of the two models are 1.2 and 1.5 Gyr respectively). For this plot, we improved upon equation (24) by explicitly calculating using the fully degenerate equation of state instead of using either limiting approximations (see Appendix). The high pressure limit is set by the location of the crystal/fluid boundary, which effectively acts as a hard-sphere boundary (Bildsten & Cutler, 1995; Montgomery & Winget, 1999). The solid horizontal lines show selected mode periods of the only solar mass ZZ Ceti known, BPM 37093 (Nitta et. al, 2000). It is clear that these observed modes probe the region of the WD interior in which gradients make their largest contribution to .
The contribution from the abundance profile affects over the interior and thus the periods of the longer period modes that penetrate deeply. We estimate the extent to which sedimentation affects the mode frequencies by performing the integral through the liquid WD interior (the envelope’s contribution to the integral is ). Using only the thermal contribution to gives through the WD core. The same core integral evaluated taking into account the gradient gives for and for , or a total change in the interior integral of 8-30%. Adding the envelope contribution tells us that sedimentation can affect pulsation periods by greater than 1% , or over 100 times larger than the measurement error. The effects of sedimentation in a WD are about 0.6%, or 4 seconds for 700 second modes, at the levels where work is already in progress (e.g. Metcalfe et al. (2001); Bradley (2001)). The question of whether or not the seismological effects of gradients can be separated from those due to the uncertainties in the C/O profile and envelope layer thicknesses will have to wait until detailed models are made that include the contributions. It seems probable that once this is done, it will be seen that distinguishing between theoretical mode spectra calculated with or without gradient contributions is possible based on the fact that the gradients introduce a new spike in the Brunt-Väisälä frequency in the WD interior. Whether or not pulsation studies will be able to confirm the presence of such gradients in real WDs remains to be answered.
6 Summary and Conclusions
With two extra neutrons (over and above the ratio of the background ions), the diffusion of is biased inward in the liquid interior of WDs. The impact of this sedimentation on WD cooling was first estimated by BH01. We have extended their work by calculating the mutual evolution of the density, , and core temperature, , for WD models composed of a single background ion species. The heating produced by increases the cooling age of our models on order of 0.2-1.5 Gyr (see Figure 10) depending on the value of . We have also performed initial estimates of the effects that abundance gradient can have on the pulsation modes of WDs. Although more precise work needs to be done, these initial calculations indicate that the corrections to mode periods due to gradients impact the results at the current level of observational precision.
The uncertainty in the actual value of the diffusion coefficient produces a large uncertainty in the possible impact may have on WD evolution. The significant impact that sedimentation may have on ages of recently formed WDs provides clear astrophysical motivation for authoritative calculations for the of through a multicomponent plasma. Hopefully further theoretical work in this direction will eliminate this source of uncertainty.
Observations can constrain the diffusion rate of in WD interiors. For example, say the age of a WD is known because of its membership in a cluster. Its luminosity will then depend on the rate at which sinks and on the overall amount of present in the WD (see equation (8)). Also the amount by which the brightness of the WD will be affected is very dependent on the WDs mass, as can be seen by the differences between the 0.6 and 1.0 cooling curves in Figure 9. Having an independent measure of these four quantities (, , WD age, and ) can allow meaningful tests of our theory. The main uncertainty in WD cooling, namely fractionation effects, do not come into play until a large portion of the WD has crystallized and do not seem to be a function of concentration (at least for ; see Segretain (1996)). Increases in WD luminosity over that expected from the canonical cooling theory for times prior to crystallization or which show a strong metallicity dependence are most readily interpreted as the effects of sedimentation. The question is whether or not can affect the WD luminosity to a measurable degree in the regimes where fractionation is unimportant.
One place we might look are massive young WDs. For ages between 1–4 Gyrs, the of such objects is strongly dependent on . But, on the other hand, these WDs begin to crystallize in this time frame. For , C/O fractionation effects may dominate over sedimentation, at least if (Salaris et al. (2000) and see also Figure 10). For larger values of though, these WDs will be maintained at a high enough temperature that fractionation becomes significantly less important at these times. The other place we might look for the effects of are in WDs born from metal rich progenitors. In this case, the effects on sedimentation even in the lower mass WDs are more readily apparent and may be observable.
The data required for either of the above two observational programs can be obtained for WDs that are members of open clusters. In this case, the age of the WD can be inferred from the difference between the cluster’s turn-off age and the main sequence lifetime of it progenitor, if the WD mass is known. The cluster’s metallicity constrains the content of the WDs. To date, though, the actual quantity of data for confirmed WD cluster members is rather scarce. A compilation of such objects was performed by von Hippel in 1998 (von Hippel, 1998). In this sample (which is still seemingly complete), there is only one WD (G152 in NGC 2682) with a mass or determination in a cluster older than 1 Gyr (Landsman et al., 1998). The other 27 objects all reside in clusters younger than this. Of these, there are about 5-6 WDs with masses greater than 0.9 and several (most notably the two WD members of NGC 2168) whose mass determination are highly suspect (Koester & Reimers, 1988). Obviously, it would be ideal to increase the number of known WDs in clusters with a wider range of ages than we have currently. Such a program should be a priority if for no other reason than the need for a direct observational test of WD cooling theory in general.
In the past seven years or so, the number of WD candidates in open clusters have grown substantially due to the series of deep (limiting magnitudes of 24-26 in the band) photometric studies of open clusters that several groups have undertaken (von Hippel et al., 1995; Richer et al., 1998; Kalirai et al., 2001b, c; von Hippel & Gilmore, 2000; von Hippel & Sarajedini, 1998; Andreuzzi et al., 2002). The goal of these studies is to provide a determination of cluster ages using the age of the oldest WD candidates found in each cluster. Identification of an object as a WD is based on the object’s location in the cluster’s color-magnitude diagram and on it having a spatial morphology that is stellar in nature (as opposed to one that is galactic—contamination of the WD sequence with faint blue galaxies in these studies is one of the difficulties encountered)(von Hippel & Gilmore, 2000; Kalirai et al., 2001b). To date, no follow up spectroscopy to confirm these objects aras WDs and to make mass determinations if they are has been done, although the CFHT group has future plans to do so (Kalirai et al., 2001c). Overall the number of new WD candidates added by these studies is around 300 objects. The clusters studied so far range in age from 0.5-7 Gyrs. It is worth noting that only one of the 19 clusters in the CFHT survey has an age greater than 1 Gyr (Kalirai et al., 2001a). Follow up spectroscopy on clusters outside of the CFHT sample is thus highly desirable. As mentioned earlier, the cluster NGC 6791 is an extremely interesting target due to its high metal content. To our knowledge, there have been no WD candidates identified in this cluster and discovery of a WD sequence in NGC 6791 could provide a ready test of our theory since the effects of on WD cooling will be greatly amplified there.
We would like to thank Peter Höeflich for providing the pre-WD evolutionary models from which we based our discussion of WD composition, Leandro Althaus for providing the relations used in our calculations, and James Liebert for a critical reading of our manuscript. This work was supported by the NSF under Grants PHY99-07949, AST01-96422, and AST02-05956. L. B. is a Cottrell Scholar of the Research Corporation.
Appendix A Approximation of the Brunt-Väisälä Frequency
The Brunt-Väisälä frequency is given by the expression
| (A1) |
which can be expressed in the form
| (A2) |
where
| (A3) |
and is the electron mean molecular weight.
As can be written
| (A4) |
and putting along with using hydrostatic balance, , equation (A2) can be expressed in the form
| (A5) |
showing the explicit relation between our expression and the more common form of equation (13) from Brassard et al. (1991).
In extremely degenerate matter, and if not careful the important term is missed. We thus rewrite the expression for the adiabatic exponent in terms of plus a small correction term
| (A6) |
After an expansion in the small quantities and presuming , we find
| (A7) |
Now for electron degenerate matter and ideal ions
| (A8) |
Also, as we take the ions to be ideal we have
| (A9) |
In degenerate matter, is between 4/3 and 5/3 depending on the relativity parameter. Finally
| (A10) |
where the last step is valid only if is a trace. With this expression we have
| (A11) |
so that, for relativistic matter,
| (A12) |
References
- Althaus & Benvenuto (1998) Althaus, L. & Benvenuto, O., 1989 MNRAS 296, 206
- Andreuzzi et al. (2002) Andreuzzi, G., Richer, H. B., Limongi, M., & Bolte, M., 2002, A&A (in press)
- Bildsten & Cutler (1995) Bildsten, L. & Cutler, C., 1995, ApJ, 449, 800
- Bildsten & Hall (2001) Bildsten, L. & Hall, D., 2001, ApJ, 549, L219
- Bradley (2001) Bradley, P. A. 2001, ApJ, 552, 326
- Brassard et al. (1991) Brassard, P., Fontaine, G., Wesemael, F., Kawaler, S.D., & Tassoul, M., 1991, ApJ, 367, 601
- Bravo et al. (1992) Bravo, E., Isern, J., Canal, R., & Labay, J., 1992, A&A, 257, 534
- Chaboyer, Green, & Liebert (1999) Chaboyer, B., Green, E., & Liebert, J., 1999, AJ, 117, 1360
- Chabrier (1993) Chabrier, G., 1993 ApJ, 414, 695
- Chabrier, Ashcroft, & DeWitt (1992) Chabrier, G., Ashcroft, N., & DeWitt, H., 1992, Nature, 360, 49
- DeWitt & Slattery (1999) Dewitt, H. & Slattery, W., 1999, Plasma Phys 39, 97
- Donkó & Nyíri (2000) Donkó, Z., & Nyíri, B., 2000, Physics of Plasmas, 7, 45
- Farouki & Hamaguchi (1993) Farouki, R. T. & Hamaguchi, S. 1993, Phys. Rev. E 47, 4330
- Hansen & McDonald (1986) Hansen, J.-P. & McDonald, I. R., 1986, Theory of Simple Liquds, London, Academic Press
- Hansen, McDonald, & Pollock (1975) Hansen, J.-P., McDonald, I. R., & Pollack, E. L. 1975, Phys. Rev. A, 11, 1025
- Isern et al. (1991) Isern, J., Mochkovitch, R., Garcia-Berro, E., & Hernanz, M., 1991, A&A, 241, L29
- Kanaan et al. (1998) Kanaan, A., Kepler, S. O., Giovannini, O., Winget, D.E., Montgomery, M., & Nitta, A., 1998, Balt. Ast., 7, 183
- Kalirai et al. (2001a) Kalirai et al., 2001a, AJ 122, 257
- Kalirai et al. (2001b) — 2001b, AJ 122, 266
- Kalirai et al. (2001c) — 2001c, AJ 122, 3239
- Koester & Reimers (1988) Koester, D. & Reimers, D., 1988, A&A, 202, 77
- Landsman et al. (1998) Landsman, W., et al., 1998, AJ, 116, 789
- Metcalfe et al. (2001) Metcalfe, T. S., Winget, D. E. & Charbonneau, P. 2001, ApJ, 557, 1021
- Mochkovitch (1983) Mochkovitch, R., 1983, A&A, 233, 456
- Montgomery et al. (1999) Montgomery, M. H., Klumpe, E. W., Winget, D. E., & Wood, M. A., 1999, ApJ, 525, 482
- Montgomery & Winget (1999) Montgomerey, M. H. & Winget, D. E., 1999, ApJ, 526, 976
- Murillo (2000) Murillo, M. S., 2000, Phys. Rev. E, 62, 4115
- Nitta et. al (2000) Nitta, A., Kanaan, A., Kepler, S. O., Koester, D., Montgomery, M. H., & Winget, D. E., 2000, Balt. Ast., 9, 97
- Ogata et al. (1993) Ogata, S., Iyetomi, H., Ichimaru, S., & Van Horn, H., 1993 Phys. Rev. E, 48, 1344
- Paquette et al. (1986) Paquette, C., Pelletier, C., Fontaine, G., & Michaud, G., 1986, ApJ, 61, 177
- Potekhin & Chabrier (2000) Potekhin, A. & Chabrier, G., 2000, Phys Rev E, 62, 8554
- Press et al. (1992) Press, W. H., Teukolsky, S. A., Vetterling, W. T., & Flannery, B. P., 1992, Numerical Recipies in C, The Art of Scientific Computing, Cambridge University Press
- Richer et al. (1998) Richer, H. B., Fahlman, G. G., Rosvick, J., & Ibara, R., 1998, ApJ, 116, L91
- Salaris et al. (2000) Salaris, M., García-Berro, E., Hernanz, M., Isern, J., & Saumon, D., 2000, ApJ 544, 1036
- Segretain et al. (1994) Segretain, L., Chabrier, G., Hernanz, M., García-Berro, E., Isern, J., & Mochkovitch, R., 1994, ApJ, 434, 641
- Segretain (1996) Segretain, L., 1996, A&A, 310, 485
- Tanaka & Ichimaru (1987) Tanaka, S. & Ichimaru, S., 1987 Phys Rev A 35, 4743.
- Umeda et al. (1999) Umeda, H., Nomoto, K., Yamaoka, H., & Wanajo, S., 1999, ApJ, 513, 861
- Unno et al. (1989) Unno, W., Yoji, O., Ando, H., Saio, H., & Shibahashi, H., 1989, Nonradial Oscillations of Stars, 2nd Ed., Univ. of Tokyo Press
- Viellefosse & Hansen (1975) Viellefosse, P., & Hansen, J.P., 1975 Phys Rev A 12, 1106
- von Hippel et al. (1995) von Hippel, T., Gilmore, G., & Jones, D.H.P., 1995, MNRAS, 273, L39
- von Hippel (1998) von Hippel, T., 1998, AJ, 115,1536
- von Hippel & Gilmore (2000) von Hippel, T. & Gilmore, G., 2000, AJ, 120,1384
- von Hippel & Sarajedini (1998) von Hippel, T. & Sarajedini, A., 1998, AJ, 116,1789
- Wallenborn & Baus (1978) Wallenborn, J. & Baus, M., 1978, Phys. Rev. A, 18, 1737
- Xu & Van Horn (1992) Xu, Z .W. & Van Horn, H. M., 1992 ApJ, 387, 662