11institutetext: Instituut voor Sterrenkunde, KULeuven, Celestijnenlaan 200B, B-3001
Leuven, Belgium
22institutetext: Institute for Astronomy and Space Physics, Box 515, S-75120 Uppsala, Sweden
33institutetext: GRAAL - CC72, Université de Montpellier II, F-34095 Montpellier Cedex 5,
France
44institutetext: Observatoire Royal de Belgique, Avenue Circulaire 3, B-1180 Bruxelles,
Belgium
ISO-SWS calibration and the accurate modelling of cool-star
atmospheres ††thanks: Based on observations with ISO, an ESA project with
instruments funded by ESA Member States (especially the PI countries France,
Germany, the Netherlands and the United Kingdom) and with the participation of
ISAS and NASA.
II. General results: APPENDIX
L. Decin
Postdoctoral Fellow of the Fund for
Scientific Research, Flanders11B. Vandenbussche
11C. Waelkens
K. Eriksson
1122B. Gustafsson
22B. Plez
33A.J. Sauval
44
(Received data; accepted date)
The fine calibration of the ISO-SWS detectors (Infrared Space
Observatory - Short Wavelength Spectrometer) has proven to be a
delicate problem. We therefore present a
detailed spectroscopic study in the 2.38 – 12 m wavelength range
of a sample of 16 A0 – M2 stars used for the calibration of
ISO-SWS. By investigating the discrepancies between the ISO-SWS data
of these sources, the theoretical predictions of their spectra, the
high-resolution FTS-KP (Kitt Peak) spectrum of Boo and the
solar FTS-ATMOS
(Atmospheric Trace Molecule Spectroscopy) spectrum, both calibration problems and problems in computing the theoretical models and the synthetic spectra are
revealed. The underlying reasons for these problems are sought for and
the impact on the further calibration of ISO-SWS and on the
theoretical modelling is discussed extensively.
Key Words.:
Instrumentation: spectrographs – Methods: data analysis –
Infrared: stars – Stars: atmospheres – Stars: late-type – Stars:
fundamental parameters
††offprints: L. Decin, e-mail: Leen.Decin@ster.kuleuven.ac.be
Appendix A Comparison between different observational and synthetic data
(coloured plots)
In this section, Fig. LABEL:acenarrow –
Fig. LABEL:gamdra, Fig. LABEL:band2 – Fig. LABEL:FTSOH of the
accompanying article are plotted in colour in order to better
distinguish the different observational or synthetic spectra.
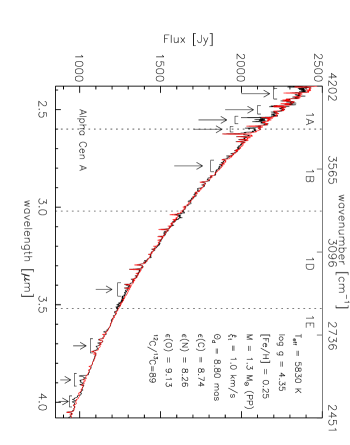
Figure 1: Comparison between the ISO-SWS data of
Cen A (black) and the synthetic spectrum (red) with
stellar parameters Teff = 5830 K, g = 4.35, M = 1.3 M⊙,
[Fe/H] = 0.25,
= 1.0 km s-1, = 89, (C) =
8.74, (N) = 8.26, (O) = 9.13 and =
8.80 mas. Some of the most prominent discrepancies between these
two spectra are indicated by an arrow.
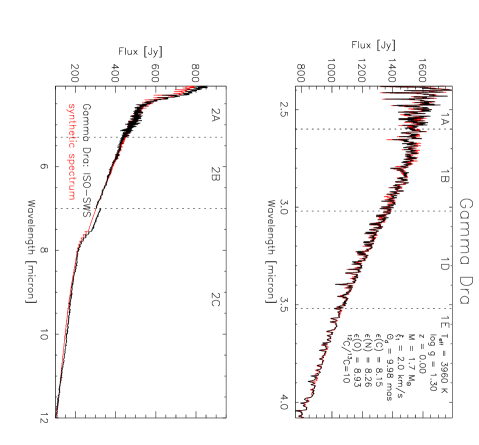
Figure 2: Comparison between band 1 and band 2 of
the ISO-SWS data of Dra (black) and the synthetic
spectrum (red) with stellar parameters Teff = 3960 K, g =
1.30, M = 1.7 M⊙, [Fe/H] = 0.00, = 2.0 km s-1, = 10,
(C) = 8.15, (N) = 8.26, (O)
= 8.93 and = 9.98 mas.
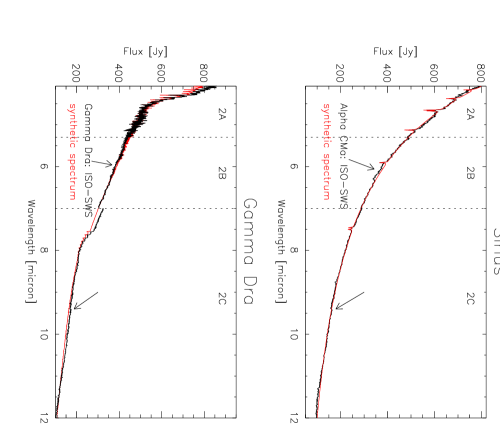
Figure 3: Band 2 for Sirius (A1 V) and Dra (K5 III) are
displayed. The ISO-SWS spectrum is plotted in black, the
synthetic spectrum in red. Problems with the RSRF are indicated by
an arrow.
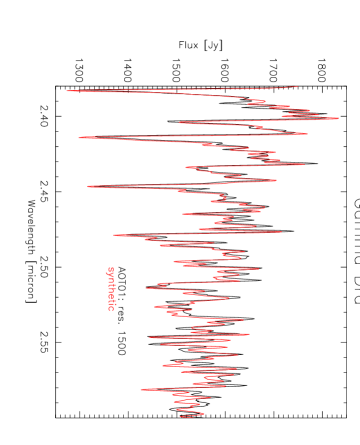
Figure 4: Comparison between the ISO-SWS observation and the
synthetic spectrum of Dra at a resolving power of 1500 (being
the most conservative theoretical resolution for band 1A Leech et al. 2002).
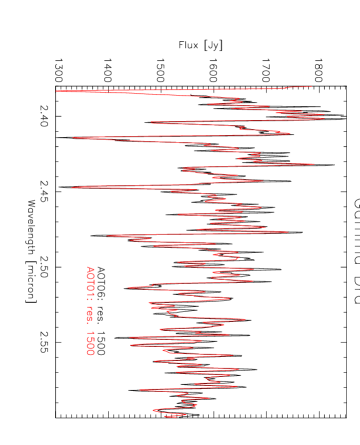
Figure 5: Comparison between the AOT06 observation
(revolution 538, black) and the AOT01 speed-4 observation (red) of
Dra. Both are rebinned to a resolving power of 1500.
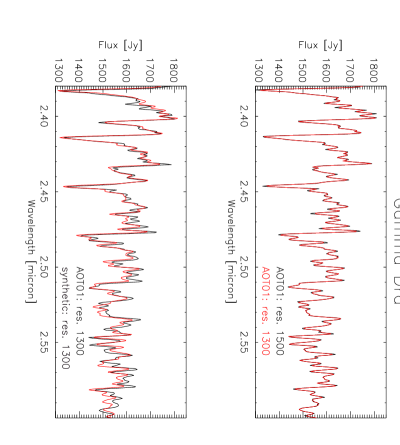
Figure 6: Top: Comparison between the
AOT01 speed-4 observation of Dra rebinned at 1) a
resolving power of 1500 (black) and 2) a resolving power of 1300 (red).
Bottom: Comparison between the ISO-SWS AOT01 observation
in band 1A (black) and its synthetic spectrum (red) at a resolving
power of 1300.
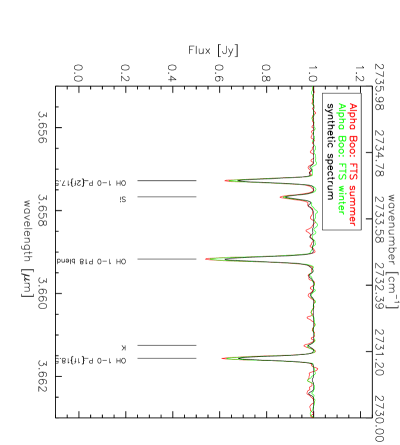
Figure 7: Summer (red) and winter (green) FTS-KP
spectra of Boo at a resolving power of 60000. They are compared with the synthetic spectrum
(black) for Boo with stellar parameters Teff = 4350 K,
g = 1.50, M = 0.75 M⊙, [Fe/H] = , = 1.7 km s-1, =
7, (C) = 7.96, (N) = 7.61,
(O) = 8.68, (Mg) = 7.33 and =
3 km s-1. The OH 1-0 lines are predicted as too weak.
References
Leech et al. (2002)
Leech, K., Kester, D., Shipman, R., et al. 2002, in The ISO Handbook.
Volume V. SWS - The Short Wavelength Spectrometer, ed. K. Leech