A New X-Ray Flare from the Galactic Nucleus Detected with the XMM-Newton Photon Imaging Cameras
Abstract
Sgr A∗, the compact radio source, believed to be the counterpart of the massive black hole at the galactic nucleus, was observed to undergo rapid and intense flaring activity in X-rays with Chandra in October 2000. We report here the detection with XMM-Newton EPIC cameras of the early phase of a similar X-ray flare from this source, which occurred on September 4, 2001. The source 2-10 keV luminosity increased by a factor 20 to reach a level of 4 1034 erg s-1 in a time interval of about 900 s, just before the end of the observation. The data indicate that the source spectrum was hard during the flare. This XMM-Newton observation confirms the results obtained by Chandra and suggests that, in Sgr A∗, rapid and intense X-ray flaring is not a rare event. This can constrain the emission mechanism models proposed for this source, and also implies that the crucial multiwavelength observation programs planned to explore the behaviour of the radio/sub-mm and hard X-ray/gamma-ray emissions during the X-ray flares, have a good chance of success.
1 Introduction
The bright, compact and variable radio source Sgr A∗ is believed to be the radiative counterpart of the 2.6 106 M⊙ black hole which governs the dynamics of the central pc of our Galaxy Melia Falcke (2001). The compelling evidence for the presence of a dark mass concentration at the Galactic Center Genzel et al. (1997); Ghez et al. (2000), which implies the presence of a massive black hole, contrasts remarkably with the weak high-energy activity of such an extreme object. In spite of the fact that some amount of material, either provided by stellar winds from a close stellar cluster or by the hot surrounding medium, is probably feeding a moderate/low level of accretion, the total bolometric luminosity of the source amounts to less than 10-6 of the estimated accretion power Melia Falcke (2001); Goldwurm (2001).
This has motivated the development of several black hole accretion flow models with low radiative efficiency, some of which have also been applied to binary systems, low luminosity nuclei of external galaxies and low luminosity active galactic nuclei. These models include spherical Bondi accretion in conditions of magnetic field sub-equipartition with a very small Keplerian disk located within the inner 50 Schwarzschild radii (RS), large hot two-temperature accretion disks dominated by advection (ADAF) or non-thermal emission from the base of a jet of relativistic electrons and pairs, and some other variants or combination of the above (see the review by Melia Falcke (2001)). However any such model still predicts some level of X-ray emission from Sgr A∗ and determining the properties of such emission would constrain the theories of accretion and outflows in the massive black holes and in general in compact objects.
The search for high energy emission from Sgr A∗ with focussing X-ray telescopes dates back to the end of the ’70s Predehl Truemper (1994); Baganoff et al. 2001a ; Goldwurm (2001), but has recently come to a turning point with the remarkable observations made with the Chandra X-ray Observatory in 1999 and in 2000. Baganoff et al. (2001a) first reported the detailed 0.5′′ resolution images obtained with Chandra in the range 0.5-7 keV, which allowed, finally, the detection of weak X-ray emission from the radio source. The derived luminosity in the 2-10 keV band was 2 1033 erg s-1, for a distance of 8 kpc, and the measured spectrum was steep, with power law photon index of 2.7. Marginal evidence that the source is extended on a 1′′ scale was also reported, but at low significance level. Then, in October 2000, the same source was seen to flare up by a factor of 45 in a few hours Baganoff et al. 2001b . The luminosity increased from a quiescent level similar to the one measured in 1999 to a value of 1035 erg s-1. The flare lasted a total of 10 ks but the shortest variation took place in about 600 s, implying activity on length scales of 20 RS, for the above quoted mass of the galactic center black hole. Evidence of spectral hardening during the flare was also reported by the authors who determined a source power law photon index during the event of 1.3 ( 0.55), significantly flatter than observed during the quiescent state. These results constrain models of the accretion flow and radiation mechanism for Sgr A∗. A confirmation of the Chandra results and in particular a better determination of the flaring properties of the source are therefore crucial for the modeling of the physics of the Galactic Center and in general for the theories of accretion in black hole systems.
XMM-Newton, the other large X-ray observatory presently in operation, features three large area X-ray telescopes coupled to three CCD photon imaging cameras (EPIC) operating in the 0.1-15 keV range and to two reflection grating spectrometers (RGS) working in the 0.1-2.5 keV band Jansen et al. (2001). Although its angular resolution (6′′ FWHM) is insufficient for properly resolving Sgr A∗ in quiescence, the high sensitivity and wide spectral range of XMM-Newton allow deep studies of the X-ray emission of such a complex and crowded region like the Galactic Center. Indeed an intense flare such as the one seen by Chandra can be easily detected with XMM-Newton thanks to its large effective area, and its timing and spectral properties can be studied.
The Galactic Center region is one of the priority targets of the XMM-Newton mission and was included in the guaranteed time program. Visibility constraints and solar flare events have however delayed the monitoring of the very center of our Galaxy. A complete pointed observation was finally performed in fall 2001 and in this letter we report the detection with XMM-Newton of another X-ray flare from Sgr A∗ which occurred at this time.
2 Observations and Results
XMM-Newton was pointed towards the galactic nucleus for about 26 ks on 4th September 2001. This observation was part of a large survey program of about 10 overlapping XMM-Newton pointings planned to map the Galactic Plane within 1∘ from the Center. Preliminary mosaiced images of the region have been presented by Warwick (2002) who showed that the region is complex and dominated by diffuse emission and some point-like and extended bright sources. We report here results obtained with the EPIC cameras of XMM-Newton during the observation of the survey which was directly pointed towards Sgr A∗ (observation GC6). The purpose of our analysis was to search for X-ray variability from this source of the type observed during fall 2000 with the Chandra telescope.
The observation with the EPIC MOS cameras Turner et al. (2001) started at 01:27:08 (UT) and lasted 26127 s while the PN Strueder et al. (2001) was activated 4109 s after the MOS for a total exposure of 21748 s. The EPIC cameras were used in standard Full Frame imaging mode with the medium filter while the RGS was used in spectral+Q mode and the OM was blocked. Data reduction was performed using the XMM-Newton Science Analysis Software (SAS) package (version 5.3), using standard choices to select events for both MOS and PN cameras, namely the 0 to 12 patterns for the MOS and both the single and double events for the PN. Inspection of the integrated count rate of the CCDs versus time revealed that the observation was slightly perturbed by weak soft proton flares. The CCD light curves show several peaks all along the observation and in particular at the beginning and at the end of it. The average combined count rate in the central CCD of the two MOS cameras was about 4.50 cts s-1, while peaks due to the proton flares reached maximum values of 21 cts s-1 for short time intervals. The counts arising from the flares are distributed fairly uniformly across the CCDs (i.e. with only a modest vignetting effect) and indeed derived images did not show particular features due to these background events. The image recorded in the central CCD (11′ 11′ for the MOS) is dominated by the diffuse emission of the Sgr A East region which is thermal in origin and rich in emission lines. Proper analysis of this component involves modelling of the variable background and composition of different images of the survey. The work is in progress and results will be reported elsewhere. Here we rather concentrate on the analysis of the central point-source, Sgr A∗, and in particular on the search for variability of its X-ray emission.
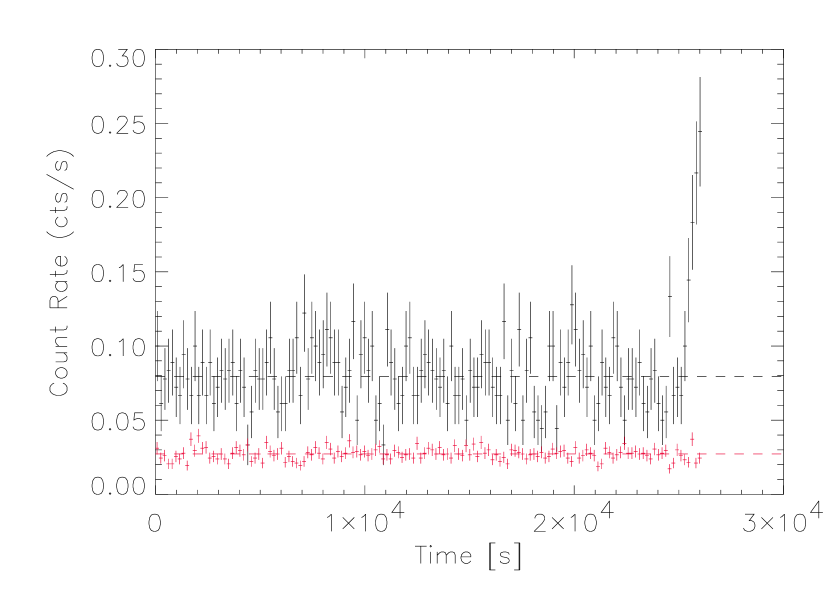
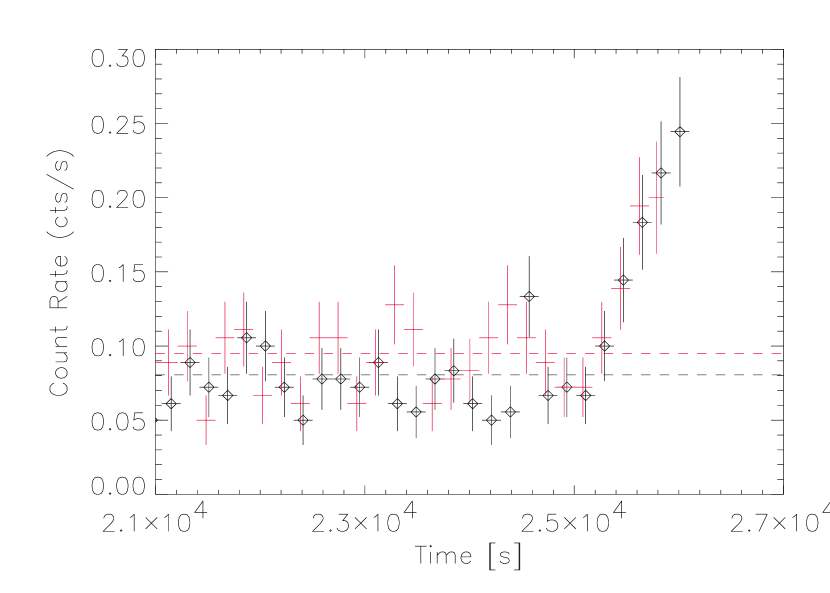
In order to optimize the signal to noise of the central source in the presence of the strong diffuse emission and considering the typical width of the XMM-Newton point spread function (15′′ half power diameter), we extracted and analyzed light curves of events collected within a 10′′ radius region centered on Sgr A∗. As shown in Fig. 1, the 2-10 keV count rate from the combined MOS 1 and MOS 2 events selected in this way, is quite stable around an average value of 0.08 cts s-1 till the last 900 s of the observation. Then the count rate gradually increases to reach a value of about a factor 3 higher in the last bin. The integrated count rate in the last 900 s reaches 7 over the average value measured before the flare and the detected variation has a very low probability to be a statistical fluctuation.
A similar light curve, from a 9 times larger region of the central CCD, far from the source but including a bright part of the diffuse emission, is also reported for comparison in Fig. 1 (scaled for clarity), and does not show any evidence of such an increase in the counting rate. The same trend is observed in the counts extracted from the PN (see Fig. 1 right). Since the PN camera stopped observing about 250 s before the MOS, the last part of the flare is not visible. However the increase in the last (PN) 600 s is also highly significant (4.3 ) and again it is not detected in counts extracted from a region away from the source. Some proton flares occurred in the last part of the observation, and they increase the total CCD 2-10 keV count rate of about a factor 1.4 in the last 1000 s. However a detailed light curve of these events show that they occur with a different time behavior than the source flare and, because of their uniform spatial distribution, they give rise to only a 1.5 increase in the measured count rate within the 10′′ radius region during the last 900 s of the observation.
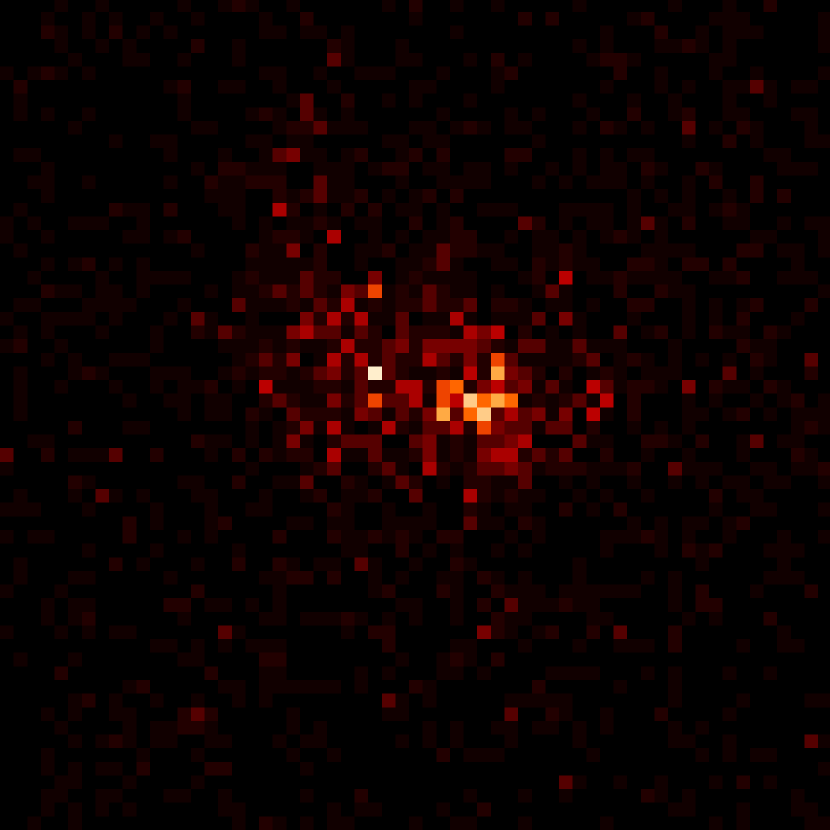
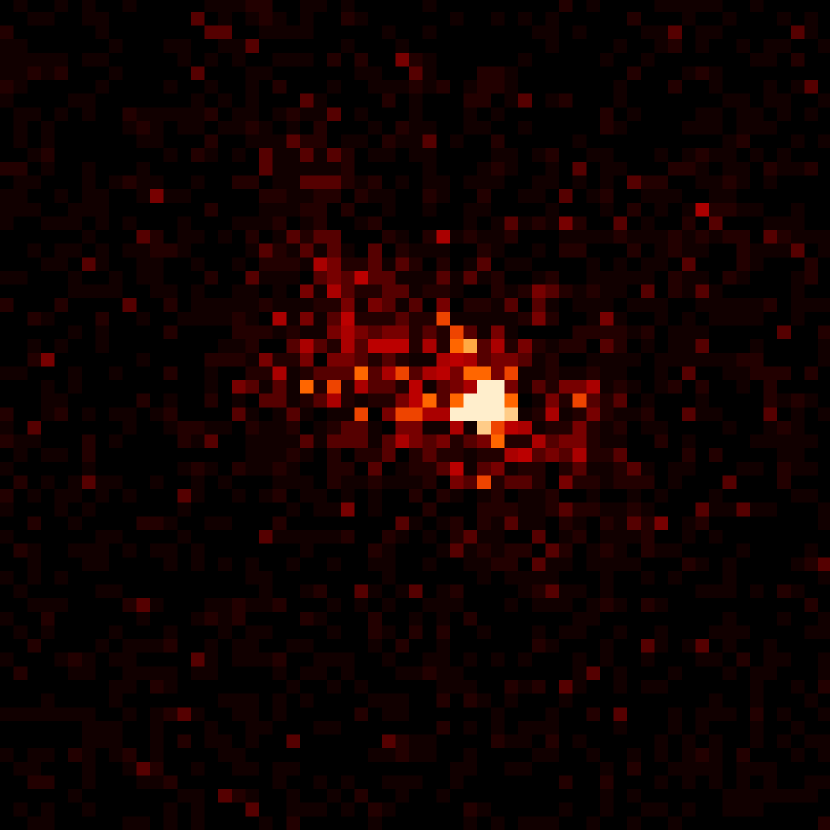
In order to check that the flare actually originated in Sgr A∗, we constructed images using MOS events selected in different periods of the observation. In Fig. 2 we report an image of the region around the nucleus integrated during the 1000 s before the flare and a similar image integrated during the last 1000 s and fully including the source flare. The basic image pixels were rebinned by a factor 5, giving image pixels sizes of 5.5′′ width. The brightening we detected in the light curves is clearly due to the brightening of a central source with the counts in the central pixel of the image which increase from 10 before the flare to 40 during the event. The general level of the image during the flare is a factor 1.4 times higher than before the flare (for pixels 20′′ from Sgr A∗) due to the proton flaring events. This difference corresponds to the uniform increase in counts due to the presence of the proton flares in the last part of the observation.
We also used the SAS procedure (eboxdetect) for source detection to determine the location of the excess. On the 2-10 keV MOS 1 and MOS 2 image of the last 1000 s, rebinned to have pixel size of 4′′, we obtained the centroid of the source at R.A. (2000) = 17h 45m 39.99s Dec (2000) = -29∘ 00′ 26.7′′, with a pure statistical error of 0.4′′ (90 confidence level in one parameter) in each direction. To check that the attitude reconstruction does not suffer from large systematic errors, we checked the full low energy (0.5 - 4 keV) MOS images for X-ray sources with stellar counterparts. In the full field of view of MOS 1 we identified 6 point-like sources with stars of known position, we determined the offsets between our derived positions and optical positions, and computed the average and rms values. We obtained an average offset of -0.03′′ in right ascension and 0.20′′ in declination, with rms of 0.29′′ (R.A.) and 1.50′′ (in Dec.). This implies that the absolute accuracy of location for the central CCD is not worse than the residual systematic uncertainties in the XMM-Newton focal plane, estimated to be 1.5′′ Kirsch (2002). The derived flare position is therefore compatible with Sgr A∗ radio location Yusef-Zadeh et al. (1999), since it is offset from the latter by only 1.5′′ (of which 1.4′′ in Dec.), i.e. within uncertainties.
The detailed study of Chandra data carried out by Baganoff et al. (2001a) showed that a number of other X-ray point sources are present in the vicinity of the galactic nucleus, the nearest of which is associated with the infrared and radio object called IRS 13 at an angular distance of 4′′. The error box we derived with XMM-Newton excludes the possibility that the observed flare is due to IRS 13 (offset 4′′) and also is not consistent with another region of excess counts in the Chandra images (offset 3′′), not fully recognized as a source but tentatively identified with IRS 16SW by Baganoff et al. (2001a). Of course this does not completely rule out the possibility that another X-ray source in this crowded region of the sky may be the origin of the event. However due to the close resemblance of the event with the Chandra flare, which was more precisely located on Sgr A∗, and considering that generally X-ray binaries do not show such large variations on such short timescales, it seems unlikely that another X-ray source in the central star cluster is responsible for this flare. We conclude that the flare detected by XMM-Newton is associated with Sgr A∗.
A first spectral analysis of the flaring event was performed by computing a simple hardness ratio (H/S), defined as the ratio between the measured counts (including background) in the hard band 4.5-10 keV, and those in the soft band 2-4.5 keV. Using events collected by both MOS and PN cameras within 10′′ from Sgr A∗ we computed the variation of the hardness ratio during the flare compared to the average value measured before the flare. The measure was performed separately for MOS (flare during last 900 s) and PN (last 650 s) events and then we computed the weighted average. The hardness ratio increased by 0.32 0.127 during the event with respect to the value before the flare. Though the count rate hardening has a modest statistical significance of 2.5 , it is fairly consistent with the trend observed with Chandra for the Sgr A∗ flare. Unlike Baganoff et al. (2001b) who observed the flare at low energy to follow of few hundred seconds the flare at high energy, we have not revealed any significant lag between the light curve of the soft energy band and the one of the high energy band.
To derive a spectrum of the source during the flare state we have to model the emission which is not due to Sgr A∗. Detailed analysis of Chandra data showed that only 10 of the 2-10 keV emission measured within 10′′ from the galactic nucleus is due to Sgr A∗ in quiescence, the rest is mainly due to the local diffuse component (60), to the contribution of the six other point sources seen by Chandra (20) and to more diffuse Galactic emission together with the instrumental background (10). To model the thermal component Baganoff et al. (2001a) used the Raymond Smith hot gas spectral model with twice solar abundance Raymond Smith (1977). The contribution from six point sources in this region was modeled with a power law of photon index 2.5, while the contribution from Sgr A∗ was best fitted by a power law of index 2.7 and NH = 9.8 1022 cm-2. The Chandra derived best fit parameters (see Table 3 of Baganoff et al. 2001a) were used to evaluate, by convolving the model with XMM-Newton responses, the expected count rates in the 2-10 keV band before the flare. We obtained values very close to the measured ones (demonstrating that the contribution of the instrumental background is not a major influence for this region of high X-ray surface brightness) and therefore we adopted a similar model to fit XMM-Newton data.
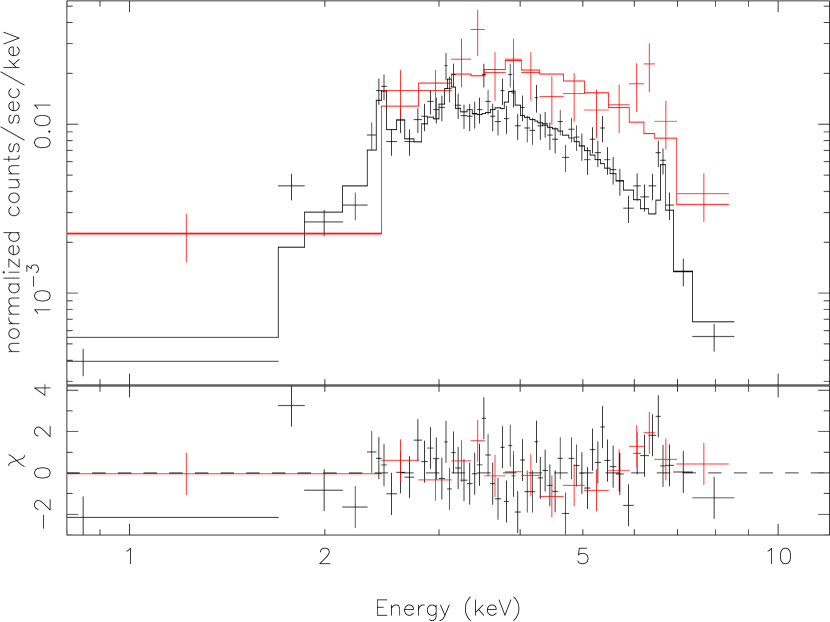
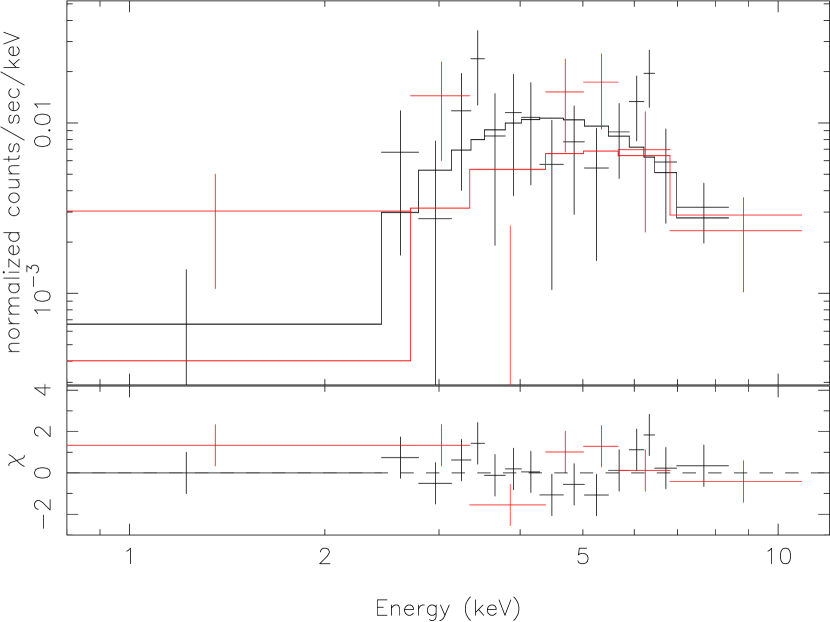
We extracted MOS and PN count spectra from the 10′′ radius circular region centered on Sgr A∗ before the flare and during the flare (last 900 s for MOS and last 700 s for PN). For the spectra before the flare, rebinned to have 30 counts per bin, we used the above model for which we fitted all parameters simultaneously (tied) on MOS and PN data, apart from the Sgr A∗ parameters which were kept frozen to Chandra best fit values (with the norm reduced by factor 0.6 to account for the encircled energy loss). Normalizations were left to vary untied between MOS and PN data to allow adjustment to different instrument background and residual normalization differences not accounted for by the responses, and we obtained the best fit parameters reported in Table 1 (left column). The MOS spectrum, compared to the best fit model, is reported in Fig. 3. Allowing the normalization of the Sgr A∗ power-law to vary freely in the fitting (with fixed slope at 2.7 and fixed NH at 9.8 1022 cm-2) we obtained a very low normalization value, indicating that this component, if present, cannot be disentangled from the first power-law supposed to describe point sources and other residual background components. With a reduced of 1.35 for 121 dof, the fit is acceptable. The best fit parameters match well the values obtained by Chandra, in particular the gas temperature kT of 1.3 keV and its column density are fully compatible with Chandra results, while the power law spectrum for the point sources is slightly flatter and needs a rather higher NH. In the procedure we adopted, this power-law describes also the background and we do not expect it to fully represent the point sources contribution.
We then fixed these parameters, let free the Sgr A∗ power-law slope and normalization and fit the spectrum extracted during the flare. The fit was performed simultaneously on MOS and PN data of the flare, rebinned to have 10 counts per bin, and fixing the column density to the value measured by Chandra. The power-law normalizations for MOS and PN data were left untied since a different portion of the flare was seen by MOS and PN cameras and we expect different average intensity. We obtained the parameters reported in Table 1 (right column). The MOS count spectrum during the flare, and its best fit model, is shown in Fig. 3, compared to the MOS spectrum before the flare. The power-law photon index of the flaring source is 0.9 0.5 (error at 1 for one interesting parameter) which is significantly harder than the spectrum measured with Chandra during the quiescent state (2.7 1.0), and rather compatible, within uncertainties, to the index measured during the 2000 October flare. By allowing the column density to vary freely during the fit we obtained a lower value for Sgr A∗ (NH = 6.4 1022 cm-2) and an even harder slope. This value is consistent with the value determined by Chandra and which we use to fix the column density in the fits.
Similar parameters were obtained by simply using the spectra extracted before the flare as background components for the flare spectra. After subtraction of the non-flaring count spectrum, the flaring spectrum was fitted with a simple absorbed power law with NH fixed to the Chandra measured value and leaving untied the MOS and PN normalizations. Results are reported in Table 2, left column. We obtained a photon index of 0.68 compatible with the estimate reported in Table 1. This procedure subtracts from the flare spectrum the non flaring component of Sgr A∗ and therefore assumes that the quiescent emission from Sgr A∗ is negligible. This is an acceptable approximation since, if the emission level of Sgr A∗ is comparable to the one observed by Chandra in 1999, it is expected to contribute by only 5 to the counts of the flare spectrum. On the other hand this procedure allows to subtract the diffuse emission present in the region of the spectral extraction and the instrumental background in a model-independent way. In any case the above results and derived fluxes, are equivalent, within errors, to those obtained adding a power-law component to the non-variable emission model. To directly compare our results with the spectra of the Sgr A∗ flare observed with Chandra, we also fitted the above spectra with an absorbed power law model modified by the effect of dust scattering Predehl Schmitt (1995). We fixed the parameter of the dust scattering model, the visual extinction AV, to the Galactic Center canonical value of 30 magnitudes and the column density for absorption to NH = 5.3 1022 cm-2 as found by Baganoff et al. (2001b). We then fitted the model on the MOS and PN spectra during the flare using the spectra before the flare as background component. The best fit is found for an even harder power law slope of 0.31 (see Table 2, right column). Letting the NH to vary freely, again we find a best fit value for the column density around 5 – 6 1022 cm-2.
To compute the observed flux and luminosity we used the normalization value derived from the MOS data, since the MOS observed a bigger fraction of the flare, and we corrected for the fraction of encircled energy at a distance of 10′′ (60). We note that we did not corrected for the energy dependence of the encircled energy, which will tend to slightly harden the spectrum, however the statistical errors is by far larger than the systematic bias induced by this procedure. The measured absorbed source flux in the 2-10 keV band is then of (3.3 0.6) 10-12 ph cm-2 s-1, equivalent to a 2-10 keV luminosity at 8 kpc of (3.8 0.7) 1034 erg s-1 (1 errors computed by fixing all other parameters but the Sgr A∗ power-law normalization at the best fit values listed in the right column of Table 1). This is the average value in the last 900 s but the last light curve 180 s bin was about a factor 1.4 higher, thus the luminosity reached a value of 5.4 1034 erg s-1.
These numbers are subject to large errors due to the low statistics available. But the general result which emerges is that the flare we detected presents a harder spectrum than the one measured with Chandra for Sgr A∗ during the quiescent period. The measured slope is even harder than typically found in X-ray spectra of AGN, however, considering the large uncertainties, this result is not compelling.
3 Discussion
The XMM-Newton discovery of a new X-ray flare of Sgr A∗ in September 2001 confirms the results obtained in the earlier Chandra observations. XMM-Newton observed only the first part of the flare, but the recorded event is fully compatible in intensity and time scale with the early phase of the flare seen by Chandra.
The count rate within 10′′ from Sgr A∗ increased in 900 s by a factor 3, but if attributed to Sgr A∗ it implies that this source brightened by a factor about 20-30, which is compatible with the increase in the first 1000 s of the flare observed by Chandra. We have not detected the maximum in the flare rise. Therefore we cannot strictly apply the travel light argument to estimate the size of the emitting region. If we assume that the flare duration (900 s) we observed is the shortest time scale of variation of the present event, it corresponds to a size of about 30 RS. This limit is a factor 1.5 larger than the shortest scale estimated with the Chandra data and does not constrain further the geometry of the region.
On the other hand the detection of another such a flare indicates that the event is not rare. The total reported observation time with Chandra amounts to 75 ks. Considering the XMM-Newton 26 ks exposure, the duty cycle of such event is 0.11 (= 11 ks / 101 ks), but it would increase to 0.18 (= 20 ks / 110 ks) if we assume that the flare we detected for only 1000 s would last for 10 ks. Though not much different than the value determined with Chandra, this estimate of the active time fraction of the source is now based on 2 events and it is therefore more significant.
The radio source on the other hand has been observed many times and the detected flux variability has never exceeded a factor 2 Zhao et al. (2001). This implies that it is unlikely that radio or sub-mm emission present a comparable increase in flux. If this is confirmed the flare may not be due to a change in the accretion rate, since this variation would lead, at least in models which attribute the bulk of X-ray emission to self synchrotron Compton emission, to a comparable increase of radio and sub-mm radiation Markoff et al. (2001).
The X-ray flare from Sgr A∗ cannot be explained by pure ADAF models (Narayan et al. 1998) as in these models the emission is due to thermal bremsstrahlung from the whole accretion flow and arises from an extended region (between 103 - 105 RS) which cannot account for such rapid variability. Models which predict emission from the innermost regions near the black hole involve a mechanism acting either at the base of a jet of relativistic particles Markoff et al. (2001) or in the hot Keplerian flow present within the circularization radius of a spherical flow Melia et al. (2001); Liu Melia (2002). In both cases a magnetic field is present in the flow and the sub-mm radiation is attributed to optically thin synchrotron emission from the inner region, while the X-rays are produced by the synchrotron self-Compton (SSC) mechanism whereby radio to mm photons are boosted to X-ray energies by the same relativistic or subrelativistic electrons that are producing the synchrotron radiation. Large flux variations can be produced by a change in accretion rate or, in the jet model, by additional heating of the electrons caused for example by magnetic reconnection. The second mechanism would increase (and harden) the X-ray flux without significantly increasing the radio and sub-mm part of the spectrum and therefore it could be more compatible with the lower amplitude of radio changes compared to X-rays Markoff et al. (2001).
However even emission from a circularized flow can provide low or anti correlation of the radio emission with the X-rays if the radiation mechanism for the X-rays is bremsstrahlung rather than SSC Liu Melia (2002). The sub-mm and far IR domain on the other hand would in this case show a large correlated increase, but at these frequencies the measurements have not been frequent enough to settle the issue. Though the exact modelling of radiation process depends on viscosity behavior and other uncertain details, the observed hardening of the spectrum during the flare indeed favours the bremsstrahlung emission mechanism in this model rather than the SSC one Liu Melia (2002). More compelling constraints on the models will be set when simultaneous observations in radio/sub-mm and X-ray wavelengths of such a flare are obtained.
Correlated radio and X-ray observations are indeed crucial because, althought the amplitude of the radio variability is low compared to the event recorded in X-rays, an intriguing correlation seems to be present between the X-ray flares and the rise of the radio emission. Indeed Zhao et al. (2001), using Very Large Array (VLA) data collected over two decades, detected a periodicity in the Sgr A∗ radio variability, with a 106 days cycle and a characteristic timescale of 25 days. Baganoff et al. (2001b) already remarked that the October 2000 X-ray flare occured at a radio-cycle phase corresponding to the beginning of the radio peak. We have computed the 106 days radio cycle phase of the X-ray flare that we detected with XMM-Newton and found that it differs by only 6 days from the phase of the flare detected with Chandra. The flare occurred at the day 64 in the light curve of Fig. 3 of Zhao et al. (2001), while the Chandra flare took place at phase 70 day and the 1.3 cm radio peak rise extends roughly from day 55 to day 75. Even though the light curve radio peak is wide and several other structures are present, both X-ray flares detected till now are very close in phase and take place during the rising part of the main radio flare. We have also compared the time of the flare to a recent radio light curve of Sgr A∗ obtained at 1.3 cm and 2 cm with the VLA between March and November 2001 Yuan Zhao (2002). The X-Ray flare occurred 1-2 days after a local maximum of the curve, but no radio data points are reported for the day when our XMM-Newton observation took place.
It will be also important to study the shape of the flare spectrum at energies higher than 10 keV to fully understand the radiation mechanism producing the high energy tail. In particular by measuring the high energy cut-off of the spectrum one could determine the electron temperature for a thermal emission or the Lorentz factor for non-thermal processes. We estimated that such a flare should be marginally visible in the range 10-60 keV with the low energy instruments onboard the new gamma-ray mission INTEGRAL, to be launched in October 2002, if the spectrum extends to these energies with the slope observed with Chandra and XMM-Newton.
Our more secure estimation of the duty cycle of the flares shows that multiwavelength observations of Sgr A∗ which involve XMM-Newton or Chandra will have good chance of observing an X-ray flare provided the simultaneous coverage is of the order of 100 ks.
Acknowledgments
Based on observations with XMM-Newton, an ESA science mission with instruments and contributions funded by ESA member states and the USA (NASA). This observation was performed as part of the XMM-Newton guaranteed time program of the XMM-EPIC team. We wish to thank all XMM-Newton staff involved in the realization and operation of the mission. F.D. acknowledges financial support from a postdoctoral fellowship from the French Spatial Agency (CNES). We thank the referee Frederick Baganoff for his stimulating comments and suggestions. We also thank Ruby Krishnaswamy for help with installation of data analysis software.
References
- (1) Baganoff, F., et al., 2001a, ApJ, submitted (astro-ph/0102151)
- (2) Baganoff, F., et al., 2001b, Nature, 413, 45
- Ghez et al. (2000) Ghez, A. M., Morris, M., Becklin, E. E., Tanner, A., Kremenek, T., 2000, Nature, 407, 349
- Genzel et al. (1997) Genzel, R., Eckart, A., Ott, T., Eisenhauer, F., 1997, MNRAS, 291, 219
- Goldwurm (2001) Goldwurm, A., 2001, Proc. of the 4th INTEGRAL Workshop, ESA-SP 459, 455
- Jansen et al. (2001) Jansen, F., et al., 2001, AA, 365, L1
- Kirsch (2002) Kirsch, M., 2002, XMM-EPIC Status of Calibrations and Data Analysis, XMM-SOC Documentation, ESA-SOC, Vilspa, Spain
- Liu Melia (2002) Liu, S., Melia, F., 2002, ApJ, 566, L77
- Markoff et al. (2001) Markoff, S., Falcke, H., Yuan, F., Biermann, L., 2001, A&A, 379, L13
- Melia Falcke (2001) Melia, F. Falcke, H., 2001, ARAA, 39, 309
- Melia et al. (2001) Melia, F., Liu, S., Coker, R. F., 2001, ApJ, 553, 146
- Narayan et al. (1998) Narayan, R., Mahadevan, R., Grindlay, J. E., Popham, R. G., Gammie, C., 1998, ApJ, 492, 554
- Predehl Truemper (1994) Predehl, P., Truemper, J., 1994, A&A, 290, L29
- Predehl Schmitt (1995) Predehl, P., Schmitt, J.H.M.M., 1995, A&A, 293, 889
- Raymond Smith (1977) Raymond, J. C., Smith, B. W., 1977, ApJSS, 35, 419
- Strueder et al. (2001) Strueder, L., et al., 2001, AA, 365, L18
- Turner et al. (2001) Turner, M. J. L., et al., 2001, AA, 365, L27
- Warwick (2002) Warwick, R. S., 2002, Proc. of New Visions of the X-ray Universe in the XMM-Newton and Chandra Era, 26-30 November 2001, ESTEC, The Netherlands, ESA-SP, in press (astro-ph/0203333)
- Yuan Zhao (2002) Yuan, F. Zhao, J., 2002, Chin. J. Astron. Astrophys., in press (astro-ph/0203050)
- Yusef-Zadeh et al. (1999) Yusef-Zadeh, F., Choate, D., Cotton, W., 1999, ApJ, 518, L33
- Zhao et al. (2001) Zhao, J., Bower, G. C., Goss, W. M., 2001, ApJ, 547, L29
| Spectrum | Spectrum | ||
|---|---|---|---|
| Before the FlareaaSpectrum from within 10″ of Sgr A∗ integrated in the period before the flare. | During the FlarebbSpectrum from within 10″ of Sgr A∗ integrated in the period during the flare. | ||
| Optically Thin Thermal PlasmaccRaymond Smith (1977) model with twice solar elemental abundances. | |||
| [ cm-2] | 11.1 | 11.1 | |
| kT [keV] | 1.31 | 1.31 | |
| Norm MOS [ cm-5]ddNormalization in units of , where and are the electron and ion densities (cm-3) and is the distance to the source (cm). | 4.6 | 4.6 | |
| Norm PN [ cm-5]ddNormalization in units of , where and are the electron and ion densities (cm-3) and is the distance to the source (cm). | 3.6 | 3.6 | |
| Power-law for Point Sources | |||
| [ cm-2] | 21.2 | 21.2 | |
| Photon Index | 2.1 | 2.1 | |
| Norm MOS [ ph cm-2 s-1 keV-1]eeFlux density at 1 keV. | 6.8 | 6.8 | |
| Norm PN [ ph cm-2 s-1 keV-1]eeFlux density at 1 keV. | 6.3 | 6.3 | |
| Power-law for Sgr A∗ | |||
| [ cm-2] | 9.8 | 9.8 | |
| Photon Index | 2.7 | 0.9 | |
| Norm MOS [ ph cm-2 s-1 keV-1]eeFlux density at 1 keV. | 2.1 | 2.0 | |
| Norm PN [ ph cm-2 s-1 keV-1]eeFlux density at 1 keV. | 2.1 | 0.6 | |
| Goodness of fit | |||
| 1.35 (121) | 0.90 (27) | ||
Note. — Parameters without errors are fixed. Errors are at 68.3 confidence interval for one interesting parameter.
| Power-law Model | ||
|---|---|---|
| No Dust Scattering | Dust ScatteringaaScattering computed for fixed value of AV = 30. | |
| [ cm-2] | 9.8 | 5.3 |
| Photon Index | 0.7 | 0.3 |
| Norm MOS [ ph cm-2 s-1 keV-1]bbFlux density at 1 keV. | 1.3 | 0.7 |
| Norm PN [ ph cm-2 s-1 keV-1]bbFlux density at 1 keV. | 0.3 | 0.2 |
| 0.98 (20) | 0.95 (20) |
Note. — Parameters without errors are fixed. Errors are at 68.3 confidence interval for one interesting parameter.