Abstract
There are three important aspects concerning the study of the red giant and in particular of the asymptotic giant branch (AGB) stars in the Magellanic Clouds. These are: the surface distribution, the luminosity function and the variability. The spatial distribution of AGB stars is an efficient tool to study the structure of the galaxies and their metalicity by analysing the ratio between carbon– and oxygen–rich AGB stars. The shape of the luminosity function carries informations about the star formation rate in the Clouds and it can be mathematically related to their history. Most AGB stars vary their magnitude in a few to several hundred years time; the one epoch DENIS magnitudes for both Large and Small Magellanic Cloud AGB stars outline the same relations as a function of period.
keywords:
Magellanic Clouds, red variables, massive photometry.Three aspects of red giant studies in the Magellanic Clouds
Red giants in the Magellanic Clouds
1 Introduction
Studying the stellar content of the Magellanic Clouds has some advantages: these are nearby galaxies that can be fully resolved in stars, they are relatively un–obscured and all their stars are at about the same distance. Before the publication of the catalogues and follow–up studies from large scale surveys what was known about red giants in the Clouds were spatially and magnitude limited informations, often focalised on particular objects (i.e. Mira variables). The past few years have seen the release of the DENIS catalogue towards the Magellanic Clouds (DCMC – Cioni et al. [2000]) which provides photometry in the broad , and bands. These filters are particularly suitable for the study of the red giant population (Cioni et al. [2000a], [2000b], [2001]). The release of the 2MASS catalogue (Nikolaev & Weinberg [2000]) provides photometry in the , and broad bands and reaches slightly fainter magnitudes than the DENIS measurements. The three micro-lensing surveys OGLE, MACHO & EROS provide light–curves over several years in two very broad blue and red filters that allow to characterise the complex variability of the red giants, as discussed also in the contribution by Wood (this proceeding). The OGLE and MACHO datasets are at present publically available. The combination of the near–infrared observations and light–curves is a key to understand the evolution and properties of long–period variables. In addition Zaritsky ([2002]) published his survey of the SMC providing also an extinction map of the Cloud. Finally, Massey ([2002]) presented less sensitive measurements in both Clouds to characterise the more massive and brighter stellar populations.
In the following sections the discussion is concentrated on the DENIS measurements described in my Ph.D. thesis ([2001a]), I am also using EROS and MACHO light–curves, and ISO (LW2, LW10) measurements covering small fields in the Clouds (Loup et al. in preparation).
2 The spatial distribution of AGB stars
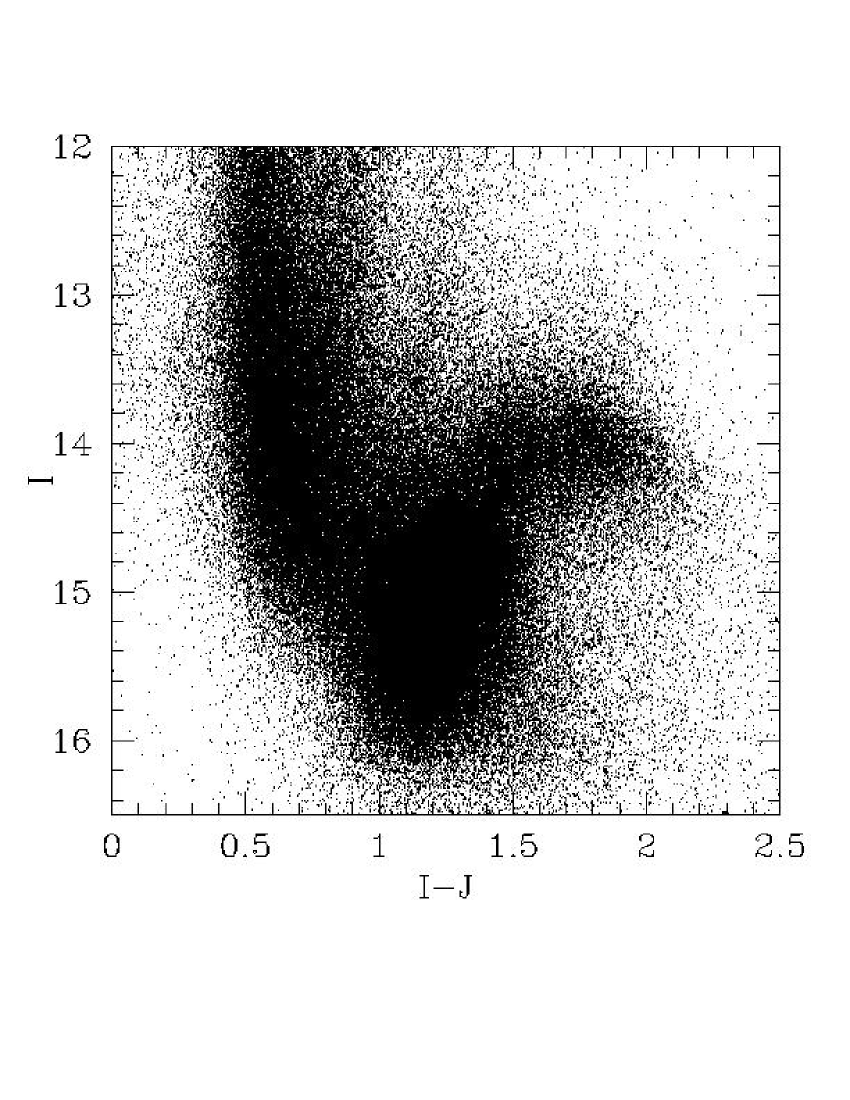
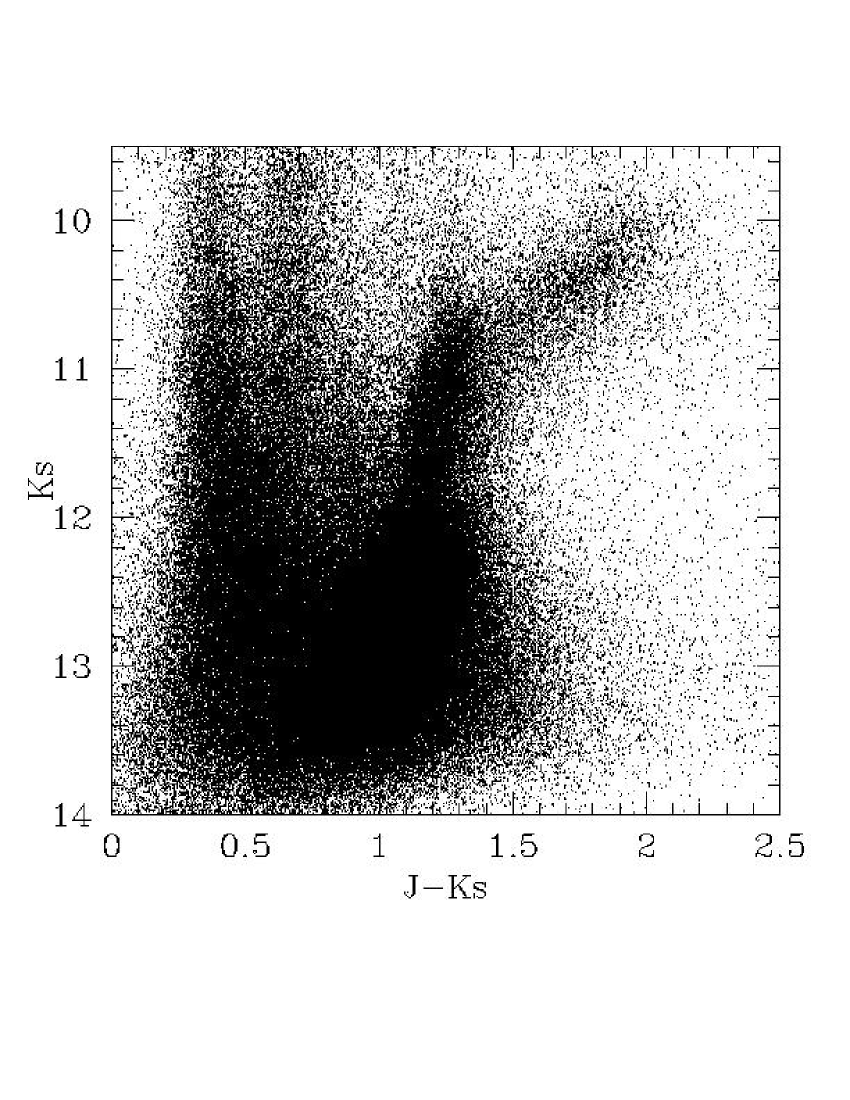
The colour–magnitude diagrams (CMDs – Fig. 1) made using the DENIS bands allow us to distinguish different groups of stars. In the (, ) diagram the densest region is the populous red giant branch of the Large Magellanic Cloud (LMC). It contains stars less massive then about solar masses and older than about Gyr. These stars reach their maximum luminosity at the tip of the red giant branch (TRGB), a well defined feature that depends theoretically only on the mass of the stellar core. The plume of objects brighter than the TRGB are AGB stars, which are statistically separated into carbon (C–) and oxygen rich (O–rich) in the diagram (, ) because of the absorption effect of the different molecular bands in their atmosphere (see figure caption for the distinction). Cepheids and other younger stars in the Clouds overlap the vertical sequences of our own Galaxy. These CMDs made of sources detected in the direction of the LMC by DENIS simultaneously in all three wave bands show how easily the different stellar groups can be characterised from broad band measurements.
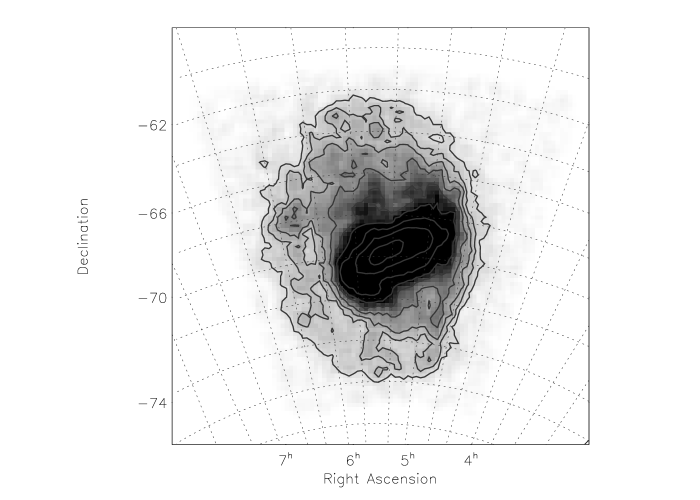
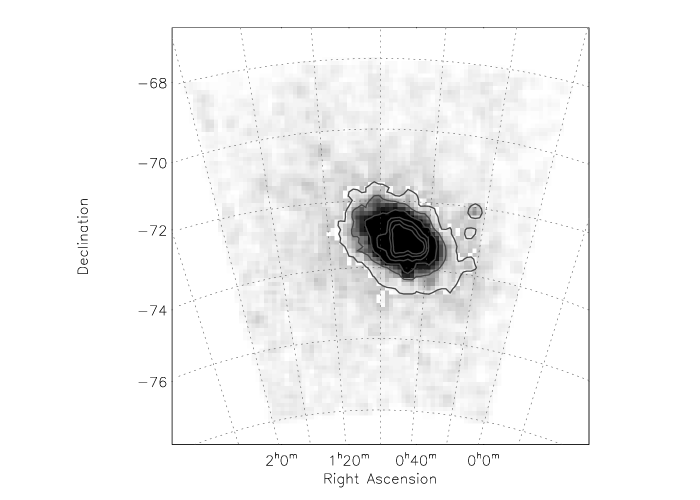
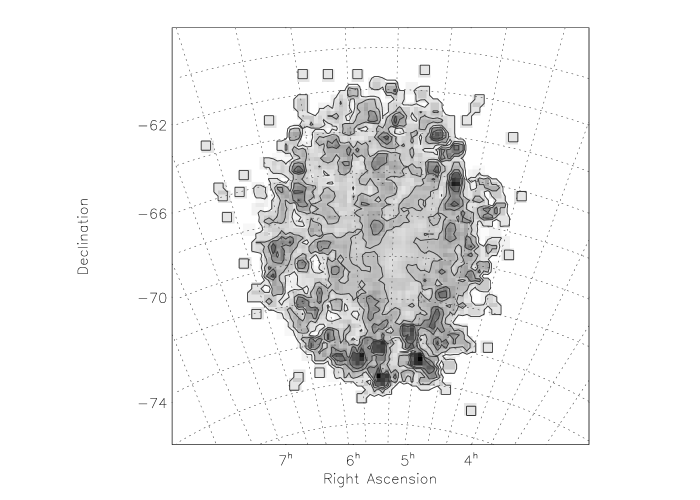
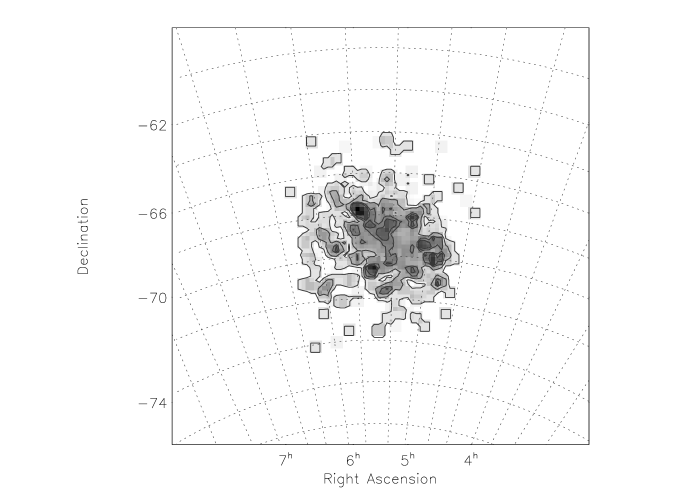
If we select AGB stars from the (, ) CMD, where the galactic foreground contamination is negligible, and plot them in the sky we obtain an extended smooth structure (Fig. 2). Note that the DCMC is complete for optically thin AGB stars; only the most obscured AGBs are not detected within the DENIS limits. In the LMC we clearly distinguish the bar and an almost circular disk structure of about in diameter. A clearly elliptical structure is seen in the SMC with a semi–major axis of about and a semi–minor axis of about . Bins are of 0.04 square degrees. See Cioni et al. ([2000b]) for more details.

If we consider the shape of the LMC and imagine to divide the outermost part (ring that excludes the bar) in four sectors, then the modal magnitude of a selected sample of stars which span a small interval in magnitude will outline the projected morphology. In figure 3 as a function of position angle it is shown the variation of the magnitude of, from the top: AGB stars selected from the (, ) diagram having , C–rich AGB stars selected from the (, ) diagram having , the TRGB obtained from the magnitude distribution in the band, and the C–rich AGB stars selected form the (, ) diagram within the same colour range as before but using this time 2MASS data. There is one point per sector and per band. Results are in very good agreement. The dashed curve represents the best fit model for an inclination angle of and a position angle of . The sinusoidal behaviour shows the effect of differences in distance coupled with the inclination of the Cloud. The conclusion of this work, described in detail in Van der Marel & Cioni ([2001]) is that the intrinsic shape of the LMC disk is elliptical and it shows that AGB stars are useful indicator of the extended structure of a galaxy.
The fact that there are AGB stars both C– and O–rich (M–type) is believed to be primarily a consequence of the third dredge–up that enriches the stellar atmosphere with carbon products. This dredge up seems to be more efficient in metal–poor environments and that is why we find more C–rich AGB stars in the SMC than in the LMC and in the Galaxy. The C/M ratio can thus be used as a metalicity indicator. Figure 4 shows the distribution of the C/M ratio in both Clouds. The separation between C– and O–rich AGB stars has been done using the () colour. The darkest regions correspond to a higher C/M ratio. In the LMC there are more C–rich AGB stars in the external parts, thus indicating a decreasing metalicity with increasing radius. In the SMC the situation is more complicated and irregular (Cioni & Habing, in preparation).
Using the VLT telescope when the FLAMES instrument will be available, the metalicity of red giants could be measured more precisely in order to study the chemical history enrichment of the Magellanic Clouds and the presence of a radial gradient. FLAMES is a multi–fibre spectrograph which will allow to observe optical spectra with a resolution of and up to for the eight fibres connected to the existing UVES instrument.
3 The luminosity function ()

Fig. 5 shows the histogram of the magnitude of AGB stars. The continuous line indicates the whole distribution, the dashed line indicates only the O–rich AGB stars and the dotted line only the C–rich AGB stars selected on the basis of their () colours. In the case of the SMC there is another thicker continuous line that indicates the C–rich AGB stars spectroscopically confirmed by Rebeirot ([1983]); this shows that the selection based on the colour is good enough for statistical studies. At the faintest mag the sharp increase of star counts marks the position of the TRGB. The global shape of the AGB histogram differs between the Clouds in the sense that it is rather monotonically decreasing for increasing mag in the SMC and it resembles a bump, thus with a flatter top, in the LMC. This difference in shape can be attributed to a different star formation history between the Clouds. Habing derives the following relation:
| (1) |
where the slope of the luminosity function is proportional to the star formation rate at a time ago. By considering two different star formation rates, assuming the Salpeter initial mass function and that the stars decrease in at the same rate, we can reproduce the shape of the luminosity functions in the Clouds. We conclude that for the first Gyr of our Universe there has been little formation of stars in the LMC with mass higher than about solar mass. However, the SMC has older AGB stars. This is in agreement with the prediction by Marigo et al. ([1999]) based on the study of the carbon star luminosity functions. Our undergoing study aims at deriving the SFH as a function of position in the Clouds (Habing & Cioni, in preparation).
4 AGB period–luminosity relation

Figure 6 shows the period–magnitude diagram for sources in the LMC and in the SMC. The LMC sources are in the bar close to the optical center and are part of a study of cross–identification between DCMC sources and EROS2 light–curves (Cioni et al. [2001]). The sources in the SMC were selected from the ISO mini–survey catalogue of Loup et al. (2002, soon to be released) to have a confident cross–identification with DCMC or 2MASS. Their light–curves were obtained from the MACHO database. The first conclusion we can deduce from this figure is that there seem to be no clear differences between the two Clouds. Both sources occupy the four slanted relations, of which relation C is where Mira variables are also located. Note that all the sources have been placed at the distance of the SMC and that the magnitude is from DCMC. The small horizontal line indicates the position of the TRGB. Sources occupying relation D are multi-periodic and the second period, also plotted, usually belong to relation A or B. In the SMC there are sources with longer periods, this is because the MACHO light–curves cover a longer time range with respect to the EROS2 data. In addition there is a lack of SMC sources around the TRGB, this is probably a selection effect because these sources do have an emission at and micron. ISO data exist also for sources in the LMC and they are going to be used also to check for variables at the TRGB magnitude.
5 Summary
We have seen that different groups of red giants can be distinguished in the near–infrared colour–magnitude–diagrams, we have also seen that the AGB stars are very good indicators of the extended structure of a galaxy and that from their luminosity function we can obtain indications on the stars formation history and the metalicity, the latter from the ratio of C– over O–rich AGB stars. Finally, these long period variables follow the same period–luminosity relations in both Clouds.
6 Asked questions
P. Wood. Do you take into account the variation of mass loss rate between the SMC and the LMC when you estimate the SFR from the AGB luminosity function?
Cioni No, it is not taken into account. On the other hand these AGB
stars are optically thin and do not loose mass at a very high rate, thus
we do not expect a strong effect due to varying mass loss rate.
M. Jura. For the LMC, is there any relationship in terms of ellipticity and/or positional angle of the “elliptical” disk and the inner bar?
Cioni The inner bar requires a separate study which van der Marel is currently undertaking, thus I cannot at present answer your question which is indeed very interesting.
S. Deguchi. How is the P–K relation of MSX sources?
Cioni Among the sources discussed here there are very few MSX sources. The contribution by Wood discusses them in more detail.
Acknowledgements.
I would like to kindly thank Cecile Loup for making available the ISO data prior publication and Harm Habing for a fruitful discussion and collaboration on the newest results. I am also grateful to M. Zoccali for comments on the text.1
References
- [2000] Cioni, M.-R.L., Loup, C., Habing, H.J., et al., (2000). The DENIs Point Source Catalogue towards the Magellanic Clouds, A&AS 144, 235
- [2000a] Cioni, M.-R.L., van der Marel, R.P., Loup, C., Habing, H.J., (2000a). The tip of the Red Giant Branch and Distance of the Magellanic Clouds, A&A 359, 601
- [2000b] Cioni, M.-R.L., Habing, H.J., Israel, f.P., (2000b). The morphology of the Magellanic Clouds revealed by stars of different age: results from the DENIS survey, A&A 358, L9
- [2001] Cioni, M.-R.L., Marquette, J.-B., Loup, C., et al., (2001). Variability and spectral classification of LMC giants: results from the DENIS survey, A&A 377, 945
- [2001a] Cioni, M.-R.L., (2001a). AGB stars and other red giants in the Magellanic Clouds, Ph.D. Leiden Observatory
- [1999] Marigo, P., Girardi, L., Bressan, A., (1999). The third dredge-up and the carbon star luminosity functions in the Magellanic Clouds, A&A 344, 123
- [2002] Massey, P., (2002). A UBVR CCD Survey of the Magellanic Clouds, ApJS 141, 81
- [2000] Nikolaev, S., Weinberg, M.D., (2000). Stellar Populations in the Large Magellanic Cloud from 2MASS, ApJ 542, 804
- [2001] van der Marel, R.P., Cioni, M.-R.L., (2001). Magellanic Cloud Structure from Near-Infrared Survey. I. The Viewing Angles of the Large Magellanic Cloud, AJ 122, 1807
- [1983] Rebeirot, E., Martin, N., Mianes, P., et al., (1983). Detection and BVR photometry of late type stars in the Large Magellanic Cloud, A&AS 51, 277
- [2002] Zaritsky, D., Harris, J., Thompson, I.B., et al., (2002). The Magellanic Clouds Photometric Survey: The Small Magellanic Cloud Stellar Catalog and Extinction Map, AJ 123, 855