Detection of the BL Lac object 1ES 1426+428 in the Very High Energy gamma-ray band by the CAT Telescope from 1998-2000
The BL Lac Object 1ES 1426+428, at a red-shift of , has been monitored by the Cat telescope from February 1998 to June 2000. The accumulation of 26 hours of observations shows a -ray signal of 321 events above at 5.2 standard deviations, determined using data analysis cuts adapted to a weak, steep-spectrum source. The source emission has an average flux of , and a very steep spectrum, with a differential spectral index of which can be refined to using a higher flux data subset. If, as expected from its broad-band properties, the Very High Energy emission is hard at the source, these observations support a strong absorption effect of -rays by the Intergalactic Infrared field.
Key Words.:
Galaxies: active – Galaxies: nuclei – BL Lacertæ objects: individual: 1ES 1426+428 – Gamma-rays: observations1 Introduction
BL Lac objects, together with Flat Spectrum Radio Quasars (FSRQs), constitute the extreme class of Active Galactic Nuclei known as blazars. They exhibit a highly variable non-thermal spectral energy distribution (SED) which is interpreted as the Doppler boosted emission of a jet pointing towards the Earth.
While at least 66 blazars are reported in the third Egret catalogue (Hartman et al. (1999)), in the TeV range only two nearby BL Lac objects, Mkn 421 () and Mkn 501 (), have been firmly established so far. This can be explained partially by the small field of view of ground-based telescopes (a few degrees), although, as compared to satellite-borne instruments, they benefit from a much larger sensitivity. The attenuation of -rays through pair-production with Intergalactic Infrared field (IIR) is another limiting factor for viewing distant sources in the Very High Energy (VHE) domain. However, the detection of absorption features in blazar spectra can provide interesting constraints on the poorly-measured IR band.
In this context, a survey of nearby BL Lacs has been carried out with the Cat telescope since 1997. Among them, 1ES 1426+428 (, ) at a red-shift of , occupies a peculiar position: the characteristics of its radio-to-X-ray SED are very similar to those of the two TeV BL Lacs, especially its hard X-ray emission which flags the presence of ultra-relativistic electrons. On the other hand, the relatively high red-shift of 1ES 1426+428 can imply significant absorption by the IIR photons.
VHE -ray detections of 1ES 1426+428 have recently been reported by Whipple and Hegra during 1999-2001 (Horan et al. (2002), Aharonian et al. (2002)). In this letter, we report on its detection based on observations made by the Cat telescope from February 1998 to June 2000. In Sect. 5 we will also give a first estimation of its spectrum.
2 The CAT telescope and its standard data analysis
The Cat imaging Čerenkov telescope, equipped with a high resolution camera ( full field of view) and a mirror, is located in the French Pyrénées at an altitude of 1650 m a.s.l. (Barrau et al. (1998)). The instrument records Čerenkov light from the particles in cosmic-ray showers. The analysis is based on the comparison of individual events and theoretical average images of -rays as a function of impact parameter and energy (Le Bohec et al. (1998)). To separate -ray initiated shower images from those due to hadronic showers the -like goodness-of-fit parameter, , given by the above procedure is used, together with a cut on the pointing angle, — which is the angle at the image barycentre between the actual source position and the reconstructed image axis of the -ray candidate — while requiring a minimum total charge, in photo-electrons (p.e.). The standard cuts are dedicated to strong and fairly hard sources (“SH” hereafter). They are , and (Piron et al. (2001)), yielding a sensitivity of 4.5 standard deviations () per for a Crab-like source at transit (∘ from Zenith) and a rate of 1.8 after cuts.
3 Weak point source data analysis
Given the relatively high red-shift () of 1ES 1426+428 as compared to the two confirmed BL Lacs, Mkn 421 and Mkn 501, one expects a rather weak flux and a soft spectrum due mainly to source distance and the IIR attenuation effect. The standard cuts have therefore been modified, trading-off -ray efficiency against background rejection. A study was made to get an indication of the IIR softening effect. Many estimates and models have been proposed for the IIR density (see Hauser & Dwek (2001) for a review). Conservative assumptions yield roughly a change of of the spectral index for the red-shift considered here. On the other hand, given its hard X-ray emission, a rather hard VHE spectrum is expected at the source, i.e. . Consequently a weak simulated signal (1 before cuts) with a spectral index was tested against real background data taken from off observations of other sources (with roughly the same elevation as 1ES 1426+428). For such a steep spectrum, a tighter cut on and a higher value of were found to improve the background rejection, while a looser cut on improves the efficiency because of the low-energy nature of the signal (for low energy -rays the estimation of the direction is less precise).
| Cuts | |||||||
|---|---|---|---|---|---|---|---|
| min | max | min | Crab | ||||
| SH | 0.35 | 6∘ | 30 | 32% | 180 | 1.8 | |
| WS | 0.50 | 8∘ | 45 | 25% | 480 | 1.15 |
The final values of the cuts (“WS” for Weak and Soft) were chosen by requiring a minimum efficiency of 25 % such as to keep a sufficient number of -ray events for spectral measurements and to avoid systematic effects due to a too small efficiency : , ∘ and p.e. The resulting quality factor, , and -ray rate on the Crab nebula, as compared to SH cuts, are given in Table 1. It has been verified that using the WS cuts for spectral analysis of Crab data yield, as expected, the same results as obtained by the standard cuts.
4 Data sample and detected signal
| Year | on (h) | off (h) | Excess | ||
|---|---|---|---|---|---|
| 1998 | 8.9 | 24.7 | 91 | 0.17 | 3.1 |
| 1999 | 13.4 | 30.5 | 186 | 0.25 | 3.9 |
| 2000 | 3.7 | 17.2 | 44 | 0.20 | 1.8 |
| Total | 26.0 | 72.4 | 321 | 0.21 | 5.2 |
The observations reported in this paper were made with the Cat telescope from February 1998 to June 2000, in the on-off mode, where control regions with the same trajectory on the sky are used as off-source data (i.e., with the same declination and shifted right ascension).
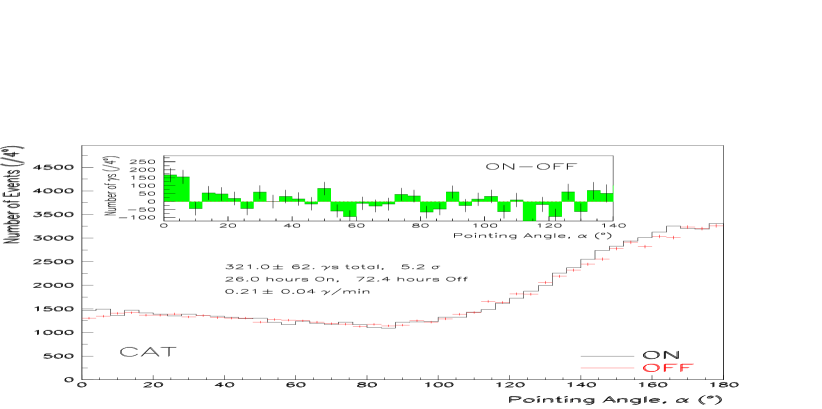
A set of 26 hours on and 12.5 hours off was selected according to criteria for good weather and smooth telescope operation (Piron (2000)). Using the Cat data-base, the off sample was expanded by adding 59.9 hours of observations of control regions (off) made during the same observing periods and with the same zenith angle range (i.e. 0–32∘). The compatibility of the two off sample sets was checked over the tracking ratio distributions (i.e., the ratio of events within the cut to the 20–100∘ control region) for all energy and zenith angle bins. This is the only relevant distribution to compare for signal and spectrum calculations. Figure 1 shows the accumulated on-off pointing angle plot. An excess of 321 -ray events, corresponding to a mean rate of 0.21 , is observed with a significance level of 5.2 . The measured -ray rate is 18% of that of the Crab nebula within the same cuts (see Table 1). There is a significant sensitivity improvement with the WS set as compared to SH cuts: the latter yield an excess of 367 events at 3.8 .
The detected signal in each observing season is summarized in Table 2. In 1998, an excess of was seen in 8.9 hours (February–May) with no flaring period evident.
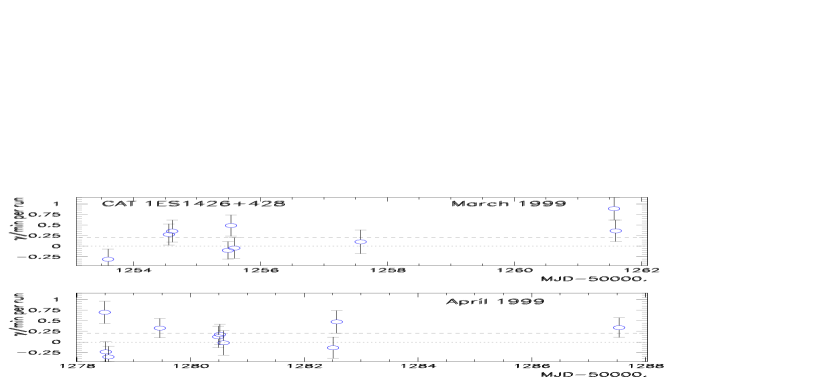
From February to June 1999, a signal was detected in 13.4 hours. This period was consecutive to the campaign by BeppoSax in February 1999 where the X-ray flux was very low as compared to archive data, but showed an extremely hard X-ray spectrum with a differential index of (Costamante et al. (2001)). The source flux was the highest during two nights in March and April with some indication of rapid variability (see Fig. 2): a rate of 0.8 Crab () followed by 0.3 Crab () was detected in two runs (each of 30 min) at MJD 51261.5 (23-24/03/99). During MJD 51278.5 (9-10/04/99) a rate of 0.6 Crab () was followed immediately by two runs showing no signal.
Weather conditions in the Pyrénées limited the observations in the on - off mode to only 3.7 hours during spring 2000 (some other data are available in 2000, but with a different observation mode which is not analysed here). The measured -ray rate is nevertheless compatible with that of the preceding periods.
5 Spectral measurements
Cat’s spectrum analysis method has been applied to the data. The method (Djannati-Ataï et al. (1999); Piron et al. (2001)) relies on a maximum-likelihood estimation of the parameters taking into account the Poissonian probability distributions of the -ray and background events, as well as the instrument response functions (effective area and resolution) derived by Monte-Carlo simulations and validated by comparison against nearly pure -ray samples (Piron (1999)). Data are classified within zenith angle and energy bins. The high energy bins show no excess: when requiring the energy per event to be less than the significance level rises to 6.1 while almost no variation in the total number of excess events is seen. Consequently, a power-law is adjusted in the limited range of to , yielding a differential flux in units, and a very steep differential index . With no cut on the maximum energy (i.e., from to ) the fitted value of the index increases: . The corresponding integral flux has been computed above the energy for which the errors on the two parameters and de-correlate: .
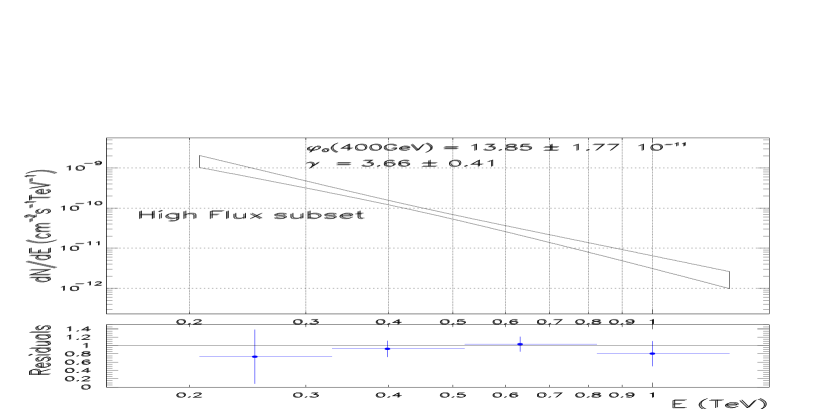
To get a better determination of the spectral index, one can improve the signal-to-background ratio by selecting the data, requiring a minimum -ray rate (High Flux subset). We make here the reasonable assumption that the background spectrum variations as a function of the statistical fluctuations of the tracking ratio are negligible. On the other hand, if the intensity-hardness correlations seen on other BL Lac sources (Djannati-Ataï et al. (1999); Aharonian et al. (2001)) hold for 1ES 1426+428, the selection could in principle bias the time-averaged spectrum. However, given the weakness of the signal and the magnitude of a possible spectral variability () as compared to that of the statistical error, the bias should be negligible here. In consequence, a subset of 10.7 hours of on data with a minimal -ray rate of 0.2 was selected (corresponding to an average rate of 0.5 ), and a differential spectral index was derived. Figure 3 shows the % confidence-level contour given by the likelihood estimator as well as the residuals to the fit for this subset.
Systematic errors could arise from the uncertainty on the absolute energy scale (variations of the atmosphere transparency and light-collection efficiencies during the observation periods) and, to a lesser extent, from limited Monte-Carlo statistics in the determination of the response functions of the instrument. They have been estimated from detailed simulations (Piron (2000)): % and . Here, the systematic error in the index remains negligible compared to the statistical error, while for the flux these errors are comparable in magnitude.
6 Discussion
Observations of 1ES 1426+428 from 1998 to 2000 by Cat show a signal at with an average event rate of order of Crab. This is the most distant detected BL Lac in the VHE range.
For the three observing seasons studied here the source average emission seems stable, within the measurements’ accuracy, while there is some evidence for time variability with transient emission rates Crab.
Given its broad-band properties, 1ES 1426+428 was one of the most promising VHE candidates, despite its red-shift of (Costamante et al. (2000)). Its detection supports the unifying scheme by Ghisellini et al. (1998), where the lower luminosity blazars with high frequency peaked synchrotron emission (HBLs) are efficient accelerators to very high energies. It is remarkable that X-ray measurements (Costamante et al. (2001)), contemporaneous to Cat observations in February 1999 reported a peak emission energy of , comparable to that of Mkn 501 during its strong activity in 1997.
If, as suggested by these data, the same acceleration/cooling mechanisms are at play within the two sources under similar conditions, one would expect a hard VHE differential spectrum with at the source (see Djannati-Ataï et al. (1999)). The very steep spectrum observed here, , supports a strong absorption of -rays by the diffuse Intergalactic Infrared field, even though the effect is compatible with several — among many — estimates and models of its density in the band. Any definite conclusion on this subject and any measurement of the IIR density will require the detection of more sources at different red-shifts.
Acknowledgements.
The authors wish to thank Electricité de France for making available to them equipment at the former solar plant “Thémis”. L.R. thanks for the financial support granted by IPNP Project MSMT (LN00A006).References
- Aharonian et al. (2001) Aharonian, F. A., Akhperjanian, A. G., Barrio, J. A., et al. 2001, ApJ, 546, 898
- Aharonian et al. (2002) Aharonian, F. A., Akhperjanian, A. G., Barrio, J. A., et al. 2002, [astro-ph/0202072]
- Barrau et al. (1998) Barrau, A., Bazer-Bachi, R., Beyer, E., et al. 1998, NIM, A416, 278
- Costamante et al. (2001) Costamante, L., Ghisellini, G., Giommi, P., et al. 2001, A&A, 371, 512
- Costamante et al. (2000) Costamante, L., Ghisellini, G., Giommi, P., et al. 2000, Proceedings of X-ray Astronomy ’99 (Bologna, Italy), [astro-ph/0001410]
- Djannati-Ataï et al. (1999) Djannati-Ataï, A., Piron, F., Barrau, A., et al. 1999, A&A, 350, 17
- Ghisellini et al. (1998) Ghisellini, G., et al. 1998, MNRAS, 301, 451
- Hartman et al. (1999) Hartman, R. C., Bertsch, D. L., Bloom, S. D., et al. 1999, ApJSS, 123, 79
- Hauser & Dwek (2001) Hauser, M. & Dwek, E. 2001, ARA&A, 39, 249
- Horan et al. (2002) Horan, D., Bardan H. M., Bond, I. H., et al. 2002, [astro-ph/0202185]
- Le Bohec et al. (1998) Le Bohec, S., Degrange, B., Punch M., et al. 1998, NIM, A416, 425
- Li & Ma (1983) Li, T. P., Ma, Y. Q., 1983, ApJ, 272, 317L
- Perlman et al. (1996) Perlman E. S., Stocke, J. T., Schachter, J. F., et al. 1996, ApJS, 104, 251
- Pian et al. (1998) Pian, E., Vacanti, G., Tagliaferri, G., et al. 1998, ApJ, 492, L17
- Piron (1999) Piron, F. 1999, GeV-TeV Gamma-Ray Astrophysics Workshop (Snowbird), AIP Conf. Proc. 515, ed. B. L. Dingus et al., 308
- Piron (2000) Piron, F. 2000, Ph.D. Thesis, University of Orsay-Paris XI
- Piron et al. (2001) Piron, F., Djannati-Ataï, A., Punch, M., et al. 2001, A&A, 374, 895