Magnetic fields in barred galaxies
The total and polarized radio continuum emission of 20 barred galaxies was observed with the Very Large Array (VLA) at 3, 6, 18 and 22 cm and with the Australia Telescope Compact Array (ATCA) at 6 cm and 13 cm. Maps at 30″ angular resolution are presented here. Polarized emission (and therefore a large-scale regular magnetic field) was detected in 17 galaxies. Most galaxies of our sample are similar to non-barred galaxies with respect to the radio/far-infrared flux correlation and equipartition strength of the total magnetic field. Galaxies with highly elongated bars are not always radio-bright. We discuss the correlation of radio properties with the aspect ratio of the bar and other measures of the bar strength. We introduce a new measure of the bar strength, , related to the quadrupole moment of the bar’s gravitational potential. The radio surface brightness I of the barred galaxies in our sample is correlated with , , and thus is highest in galaxies with a long bar where the velocity field is distorted by the bar over a large fraction of the disc. In these galaxies, the pattern of the regular field is significantly different from that in non-barred galaxies. In particular, field enhancements occur upstream of the dust lanes where the field lines are oriented at large angles to the bar’s major axis. Polarized radio emission seems to be a good indicator of large-scale non-axisymmetric motions.
Key Words.:
Galaxies: magnetic fields – Galaxies: individual: NGC986, NGC1097, NGC1300, NGC1313, NGC1365, NGC1433, NGC1493, NGC1559, NGC1672, NGC2336, NGC2442, NGC3059, NGC3359, NGC3953, NGC3992, NGC4535, NGC5068, NGC5643, NGC7479, NGC7552 – Galaxies: spiral – Galaxies: structure – ISM: magnetic fields1 Introduction
Polarization observations in radio continuum have revealed basic properties of interstellar magnetic fields in a few dozen spiral galaxies (Beck et al. beck+96 (1996), Beck beck00 (2000)). Large-scale regular fields form spiral patterns with pitch angles similar to those of the optical spiral arms. The strongest regular fields usually occur between the optical arms, sometimes concentrated in ‘magnetic arms’ (Beck & Hoernes beck+hoernes96 (1996)). The total (= polarized + unpolarized) nonthermal (synchrotron) radio emission is a tracer of the total field which comprises both regular and random field components. It generally peaks on the optical arms because the random field is strongest there. This distinction implies that the regular and random magnetic fields are maintained and affected by different physical processes.
Spiral patterns of the regular magnetic field are believed to be generated by dynamo action in a differentially rotating disc (Beck et al. beck+96 (1996)). The dynamo reacts or interacts with non-axisymmetric disturbances like density waves (Mestel & Subramanian mestel+91 (1991), Rohde et al. rohde+99 (1999)), but little is known about the effects of bar-like distortions. Chiba & Lesch (chiba+lesch94 (1994)) suggested that a bar may excite higher dynamo modes, while Moss et al. (moss+98 (1998)) found from their models a mixture of modes with rapidly changing appearance.
Radio observations of barred galaxies are rare. The angular resolution of the maps in Condon’s (condon87 (1987)) atlas was insufficient to distinguish emission from the bar, the spiral arms and the halo. Another survey of barred galaxies in radio continuum by García-Barreto et al. (garcia+93 (1993)) had even lower angular resolution; neither survey included polarization. The first high-resolution radio map of a barred galaxy, NGC 1097 (Ondrechen & van der Hulst ondrechen+83 (1983)), showed narrow ridges in total intensity coinciding with the dust lanes, which are tracers of compression regions along the leading (with respect to the sense of rotation) edge of the bar. A similar result was obtained for M83 (Ondrechen ondrechen85 (1985)) which hosts a bar of smaller size than NGC 1097. No polarization could be detected in NGC 1097 by Ondrechen & van der Hulst (ondrechen+83 (1983)). Radio observations of NGC 1365 at and , restricted to a central region, have revealed similar features (Jörsäter & van Moorsel joersaeter+moorsel95 (1995)). The first detection of polarized radio emission from the bar region was reported by Ondrechen (ondrechen85 (1985)) for M83, with a mean fractional polarization at cm of 25%. Neininger et al. (neininger+91 (1991)) mapped the polarized emission from M83 at cm. They showed that the regular magnetic field in the bar region is aligned with the bar’s major axis. Observed with higher resolution, the regular field is strongest at the leading edges of the bar of M83 (Beck beck00 (2000)).
Another barred galaxy which has been studied in detail in radio polarization is NGC 3627 (Soida et al. soida+01 (2001)). The regular field in the bar region is again aligned parallel to the bar’s major axis, being strongest at the leading edges of the bar. However, east of the bar the field behaves anomalously, forming a ‘magnetic arm’ crossing the gaseous arm.
The first high-resolution polarization observations of a galaxy with a massive bar, NGC 1097, were presented by Beck et al. (beck+99 (1999)). The magnetic field lines in and around the bar appear to follow the velocity field of the gas expected from a generic gas dynamic model (Athanassoula atha92 (1992)). The regular magnetic field outside the bar region has a spiral pattern similar to that seen optically. A narrow ridge of greatly reduced polarized intensity indicates the deflection of the field lines in a shear shock (the dust lane), but the magnetic field lines turn more smoothly than the gas streamlines (Moss et al. moss+01 (2001), hereafter Paper II). Velocity fields are available from HI observations only for the outer parts of NGC 1097 (Ondrechen et al. ondrechen+89 (1989)) and from CO observations only for the circumnuclear ring (Gerin et al. gerin+88 (1988)).
NGC 1097 is one of the objects in our sample of barred galaxies observed with the VLA and the ATCA. In this paper we present the full set of radio maps of our survey, smoothed to a common resolution of 30″, and give an overview of their salient properties. Higher-resolution maps of NGC 1097, 1365 and 7479 will be presented and discussed in subsequent papers. New dynamo models for barred galaxies are discussed in Paper II. Further details on the magnetic fields in NGC1672, 2442 and 7552 will be given by Harnett et al. (harnett+02 (2002), hereafter Paper III).
| NGC | Hubble | Lum. | RC3 | R.A. | Dec. | PA | |||||||||
|---|---|---|---|---|---|---|---|---|---|---|---|---|---|---|---|
| type | class | class | (2000) | (2000) | [′] | [km/s] | [M | [°] | [°] | [Jy] | [mJy] | ||||
| (1) | (1) | (2) | [h m s] | [° ′ ″] | (2) | (2) | (2) | pc] | (3) | (4) | |||||
| 1097 | SBbc(rs) | I-II | SBS3 | 02 46 19.0 | 30 16 21 | 9.3 | 1.48 | 1193 | 16 | 45 | 135 | [0.4] | 0.37 | 45.9 | 415 |
| 1300 | SBb(s) | I.2 | SBT4 | 03 19 40.9 | 19 24 41 | 6.2 | 1.51 | 1496 | 20 | 35 | 86 | [0.3] | 0.41 | 2.4 | 35 |
| 1365 | SBb(s) | I | SBS3 | 03 33 36.7 | 36 08 17 | 11.2 | 1.82 | 1541 | 19 | 40 | 40 | 0.51 | 0.47 | 78.2 | 530 |
| 2336 | SBbc(r) | I | SXR4 | 07 27 04.4 | 80 10 41 | 7.1 | 1.82 | 2345 | 31 | 59 | 178 | 0.41 | 0.17 | 1.0 | 18 |
| 3359 | SBc(s) | I.8 | SBT5 | 10 46 37.8 | 63 13 22 | 7.2 | 1.66 | 1104 | 15 | 55 | 170 | 0.32 | 0.25 | 4.1 | 50 |
| 3953 | SBbc(r) | I-II | SBR4 | 11 53 49.6 | 52 19 39 | 6.9 | 2.00 | 1122 | 15 | 61 | 13 | 0.89 | 0.17 | 2.9 | 41 |
| 3992 | SBb(rs) | I | SBT4 | 11 57 36.3 | 53 22 31 | 7.6 | 1.62 | 1121 | 15 | 59 | 67 | 0.58 | 0.27 | 3 | 21 |
| 4535 | SBc(s) | I.3 | SXS5 | 12 34 20.4 | 08 11 53 | 7.1 | 1.41 | 1892 | 16 | 26 | 28 | [0.6] | [0.1] | 6.5 | 65 |
| 5068 | SBc(s) | II-III | SXT6 | 13 18 55.4 | 21 02 21 | 7.2 | 1.15 | 550 | 7 | 29 | 110 | 0.44 | 0.16 | 2.3 | 39 |
| 7479 | SBbc(s) | I-II | SBS5 | 23 04 57.2 | 12 19 18 | 4.1 | 1.32 | 2544 | 34 | 45 | 25 | 0.41 | 0.46 | 12.1 | 109 |
| NGC | Hubble | Lum. | RC3 | R.A. | Dec. | PA | |||||||||
|---|---|---|---|---|---|---|---|---|---|---|---|---|---|---|---|
| type | class | class | (2000) | (2000) | [′] | [km/s] | [M | [°] | [°] | [Jy] | [mJy] | ||||
| (1) | (1) | (2) | [h m s] | [° ′ ″] | (2) | (2) | (2) | pc] | (3) | (4) | |||||
| 986 | SBb(rs) | I–II | SBT2 | 02 33 34.3 | 39 02 43 | 3.9 | 1.32 | 1907 | 25 | ? | ? | [0.5] | 0.46 | 23.1 | 40 |
| 1313 | SBc(s) | III-IV | SBS7 | 03 18 15.5 | 66 29 51 | 9.1 | 1.32 | 292 | 4 | 38 | 170 | 0.63 | 0.31 | 10.4 | 59 |
| 1433 | SBb(s) | I-II | PSBR2 | 03 42 01.4 | 47 13 17 | 6.5 | 1.10 | 920 | 12 | 27 | 17 | 0.33 | 0.36 | 3.3 | – |
| 1493 | SBc(rs) | III | SBR6 | 03 57 27.9 | 46 12 38 | 3.5 | 1.07 | 900 | 12 | 30 | ? | 0.32 | 0.18 | 2.2 | – |
| 1559 | SBc(s) | II.8 | SBS6 | 04 17 37.4 | 62 47 04 | 3.5 | 1.74 | 1115 | 15 | 55 | 65 | [0.3] | [0.2] | 23.8 | 120 |
| 1672 | SBb(rs) | II | SBS3 | 04 45 42.2 | 59 14 57 | 6.6 | 1.20 | 1155 | 15 | 39 | 170 | 0.41 | 0.68 | 34.8 | 100 |
| 2442 | SBbc(rs) | II | SXS4P | 07 36 23.9 | 69 31 50 | 5.5 | 1.12 | 1236 | 16 | 24 | 40 | [0.5] | 0.42 | 22 | 70 |
| 3059 | SBc(s) | III | SBT4 | 09 50 08.1 | 73 55 17 | 3.6 | 1.12 | 1056 | 14 | ? | ? | [0.3] | [0.2] | 9.6 | – |
| 5643 | SBc(s) | II-III | SXT5 | 14 32 41.5 | 44 10 24 | 4.6 | 1.15 | 1066 | 14 | ? | ? | [0.4] | [0.35] | 18.7 | 64 |
| 7552 | SBbc(s) | I-II | PSBS2 | 23 16 11.0 | 42 35 01 | 3.4 | 1.26 | 1568 | 21 | 31 | 1 | 0.29 | 0.59 | 72.9 | 140 |
References: (1)–(3) see Table 1; (4) Whiteoak (whiteoak70 (1970)).
2 The sample
Table 1 lists the barred galaxies that have been observed with the VLA (declinations north of ). These have an optical extent , to obtain reasonable spatial resolution, a mean total intensity in radio continuum of , and were selected from Condon’s (condon87 (1987)) survey. Our sample of galaxies observed with the ATCA (declinations south of ) is shown in Table 2. The criteria are the same, except for the size limit of 3′. The isophotal major-axis diameter in arcmin is denoted by , and is the ratio of the major-to-minor isophotal diameters; the subscript 25 refers to the isophotal level of 25 mag/. The systemic velocity has been transformed into distance using =75 km s-1 Mpc-1, except for NGC 1365 and NGC 4535, for which Cepheid distances are available (Madore et al. madore+98 (1998), Macri et al. macri+99 (1999)). The inclination and position angle of each projected galaxy disc are denoted and PA (Martin martin95 (1995); Martin & Friedli martin+friedli97 (1997); Ma et al. ma+97 (1997), ma+98 (1998); Wilke et al. wilke+00 (2000); Möllenhoff & Heidt moellenhoff+01 (2001)); means face-on and is the north-south direction. For several southern galaxies, no values of and PA are available, as indicated by ‘?’. The deprojected ratio of the bar’s minor and major axes is denoted , and is its relative length according to Elmegreen & Elmegreen (elmegreen+elmegreen85 (1985)) or Martin (martin95 (1995)), derived from deprojected images according to the galaxy’s inclination and position angle, assuming that the bars are flat. Values in brackets are our estimates from optical images.
The far-infrared flux densities at m, denoted , are from Fullmer & Lonsdale (fullmer+lonsdale89 (1989)). Their values for NGC 2442 and NGC 3992 are obviously underestimated and were recalculated from the flux density at 100 m using with for the luminous galaxy NGC 2442 and for the faint galaxy NGC 3992 (see Fig. 5b in Young et al. young+89 (1989)). The integrated radio continuum flux densities at and , in Table 1 and in Table 2, were taken from Condon (condon87 (1987)) and Whiteoak (whiteoak70 (1970)), respectively.
| 22 cm and 18 cm | 6.2 cm | 3.5 cm | ||||||||||
|---|---|---|---|---|---|---|---|---|---|---|---|---|
| NGC | Date | Conf. | Date | Conf. | Date | Conf. | ||||||
| 1097 | 96 Feb3 | CnB | 0.7 | 60/40 | 96 May20 | DnC | 0.5 | 96 May20 | ||||
| +97 Oct7+9 | DnC | 5.6 | ||||||||||
| +98Nov13+15 | CnB | 9.3 | 40/20 | +98Nov11+14 | CnB | 9.3 | 30/15 | |||||
| 1300 | –”– | CnB | 1.0 | 50/40 | 96 May20 | DnC | 1.8 | 25/25 | 96 May20 | DnC | 2.0 | 25/20 |
| 1365 | –”– | CnB | 1.0 | 80/60 | 96 May20 | 96 May20 | ||||||
| +99 Feb19 | DnC | 6.0 | 15/15 | +97 Oct7+9 | DnC | 5.6 | 20/15 | |||||
| 2336 | 96Mar10+22 | C | 1.1 | 25/25 | 96 Jul22 | D | 2.0 | 15/20 | 96 Jul22 | D | 2.2 | 20/– |
| 3359 | 96 Mar10 | C | 0.4 | 30/25 | –”– | D | 0.7 | 30/25 | –”– | D | 0.9 | 30/35 |
| 3953 | –”– | C | 0.4 | 30/20 | –”– | D | 0.7 | 25/30 | –”– | D | 0.9 | 30/– |
| 3992 | –”– | C | 0.7 | 30/25 | 96 Jul22 | 96 Jul22 | ||||||
| +96 Aug17 | D | 0.7 | 20/20 | +96 Aug17 | D | 0.9 | 40/25 | |||||
| 4535 | –”– | C | 0.4 | 20/20 | 96 Aug17 | D | 0.5 | 20/20 | 96 Aug17 | |||
| +99 Apr2 | D | 6.6 | 25/15 | |||||||||
| 5068 | 97 Jun12 | CnB | 2.0 | 30/35 | 96 Jun1 | DnC | 0.8 | 96 Aug17 | D | 1.2 | 20/25 | |
| +96 Aug17 | D | 1.1 | 20/15 | |||||||||
| 7479 | 96 Mar22 | 96 Jul22 | D | 0.5 | 25/30 | 96 Jul22 | ||||||
| +97 Jul2 | C | 2.1 | 40/25 | +98 Jan9+10 | D | 5.0 | 20/15 | |||||
| 13 cm | 5.8 cm | |||||||
| NGC | Date | Conf. | Date | Conf. | ||||
| 986 | 96 Jan20 | 750C | 2 | |||||
| +96 Feb10+11 | 750B | 3 | 40/25 | |||||
| 1313 | 96 Jan20 | 750C | 2 | |||||
| +96 Feb10+11 | 750B | 2 | 70/25 | |||||
| 1433 | 96 Jan20 | 750C | 2 | |||||
| +96 Feb10+11 | 750B | 2 | 40/25 | |||||
| 1493 | 96 Jan20 | 750C | 2 | |||||
| +96 Feb10+11 | 750B | 2 | 50/25 | |||||
| 1559 | 96 Oct29 | 1.5A | 5 | 100/40 | 96 Jan20 | 750C | 2 | |
| +96 Feb10+11 | 750B | 3 | ||||||
| +96 Nov1 | 750A | 11 | 30/15 | |||||
| 1672 | 93 May19 | 1.5B | 10 | 60/– | 92 Mar15 | 375 | 11 | |
| +93 Jul26 | 750D | 10 | ||||||
| +93 Sep9 | 750C | 12 | 50/25 | |||||
| 2442 | 96 Oct29 | 1.5A | 5 | 70/60 | 96 Jan19 | 750C | 3 | |
| +96 Feb9+11 | 750B | 4 | ||||||
| +96 Nov2 | 750A | 10 | ||||||
| +98 Mar25 | 375 | 9 | ||||||
| +00 Dec31 | 750C | 11 | 25/25 | |||||
| 3059 | 98 Jan9 | 1.5A | 7 | 60/60 | 96 Jan19 | 750C | 3 | |
| +96 Feb9+11 | 750B | 4 | ||||||
| +97 Jan7 | 750D | 6 | ||||||
| +98 Apr9 | 750A | 10 | 25/25 | |||||
| 5643 | 96 Jan19 | 750C | 3 | |||||
| +96 Feb9+11 | 750B | 3 | 40/25 | |||||
| 7552 | 96 Jan19 | 750C | 3 | |||||
| +96 Feb9+11 | 750B | 3 | ||||||
| +99 Jan3 | 375 | 8 | ||||||
| +00 Dec30 | 750C | 7 | 100/25 | |||||
| Simultaneous observations at 22 cm (1380 MHz) | ||||||||
| Simultaneous observations at 3.5 cm (8640 MHz) | ||||||||
3 Observations and results
The observations were performed with the VLA operated by the NRAO111The National Radio Astronomy Observatory is a facility of the National Science Foundation operated under cooperative agreement by Associated Universities, Inc. and with the ATCA222The Australia Telescope Compact Array is part of the Australia Telescope which is funded by the Commonwealth of Australia for operation as a National Facility managed by CSIRO. operated by the ATNF. Details of the observations are given in Tables 3 and 4. The antenna configurations were chosen to obtain half-power widths of the synthesized beams of about 20″.
In the L band, VLA observations were performed at 1365 MHz (22 cm) and 1665 MHz (18 cm) simultaneously. In each of the VLA C and X bands, the data from two channels were combined (4835 MHz + 4885 MHz and 8435 MHz + 8485 MHz). The four southern galaxies from the VLA sample were observed with hybrid configurations (CnB and DnC) which allow to synthesize a more circular beam. For NGC 1097, the CnB and DnC data at the same wavelength were combined.
Several ATCA 750 m configurations were combined at 5.8 cm (4800 MHz + 5568 MHz) to achieve higher sensitivity and better coverage of the plane. For three large galaxies, additional observations with the ATCA 375 m configuration were added. In two observation sessions (1993 May 19 and 1998 January 9), data at 1380 MHz (22 cm) and at 2368 MHz (13 cm) were recorded simultaneously. No significant polarization was detected at 22 cm. In the session of 1996 October 29, frequencies were set to 2240 MHz (13.4 cm) and 2368 MHz (12.7 cm). In the sessions of 1993 July 26 and September 9, data at 4800 MHz (6.2 cm) and at 8640 MHz (3.5 cm) were recorded simultaneously.
The largest visible structure for full synthesis observations (that requires an observing time in excess of 8 h with the VLA or 12 h with the ATCA) is 15′ at 18 cm and 22 cm (VLA C or CnB arrays), 5′ at 6 cm (VLA D or DnC arrays), 3′ at 3 cm (VLA D or DnC arrays), 3′ at 13 cm (ATCA 1.5 km arrays), 4′ at 6 cm (ATCA 750 m arrays) and 8′ at 6 cm (ATCA 375 m array).
The data were reduced with the standard AIPS and MIRIAD software packages. The maps in Stokes parameters I, Q and U were smoothed to a common resolution of 30″ to achieve a higher signal-to-noise ratio. These were combined to maps of total and polarized surface brightness333In the following we will also use the usual expression ‘intensity’., measured in Jansky per solid angle of the telescope beam (‘beam area’), and polarization angle. The positive bias in PI due to noise was corrected by subtraction of a constant value, which is equal to 1.0-1.4(rms noise) in the maps of Q and U.
The rms noise in the final maps in I (total intensity) and PI (polarized intensity) is given in Tables 3 and 4. Since the noise in the PI maps has a non-Gaussian distribution (even if Q and U have Gaussian noise) the standard deviation underestimates the noise. Therefore we assume the noise in PI to be the same as that in Q and U. The rms noise in the ATCA maps is typically larger by a factor two in comparison to the VLA maps.
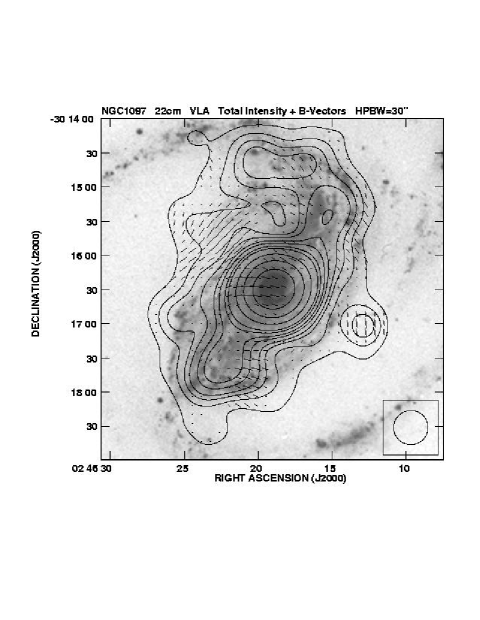
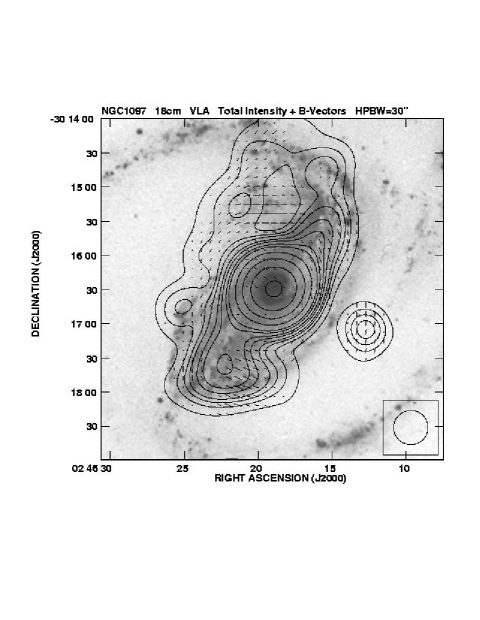
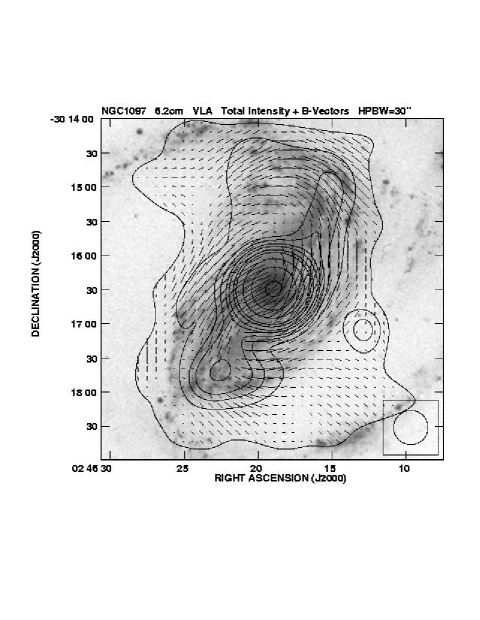
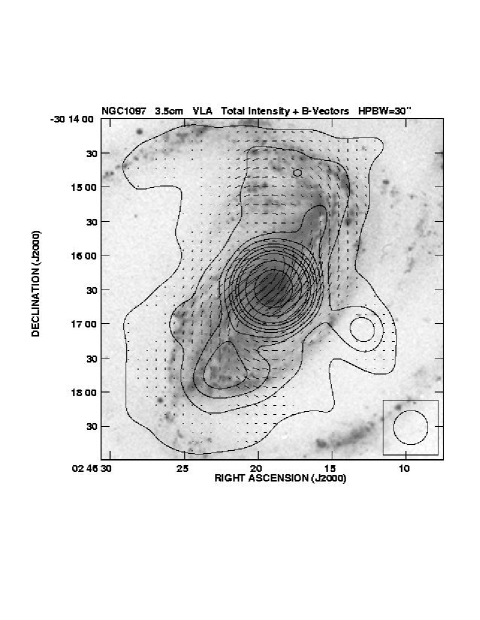
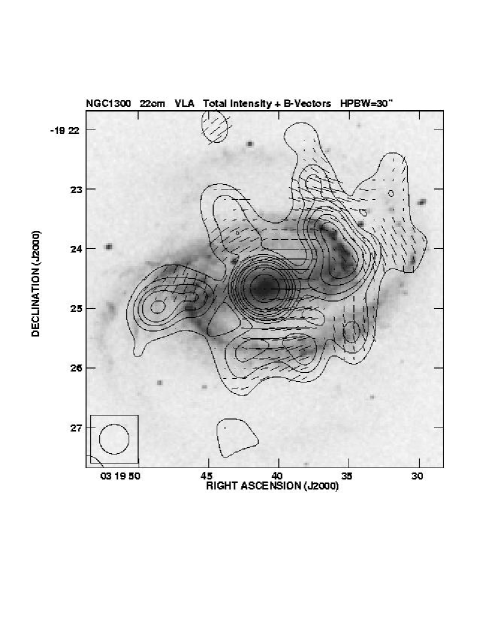
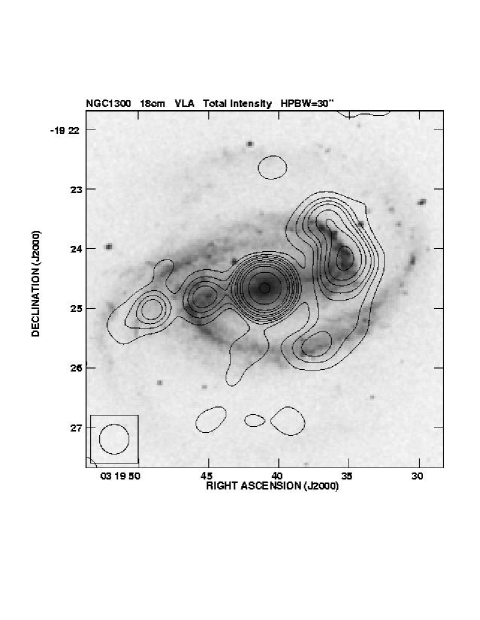
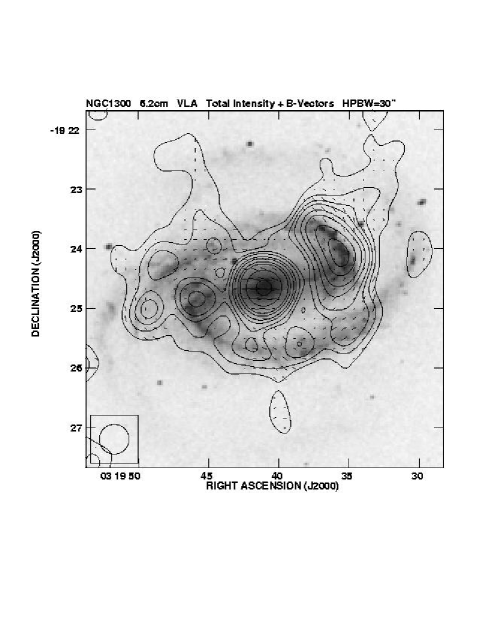
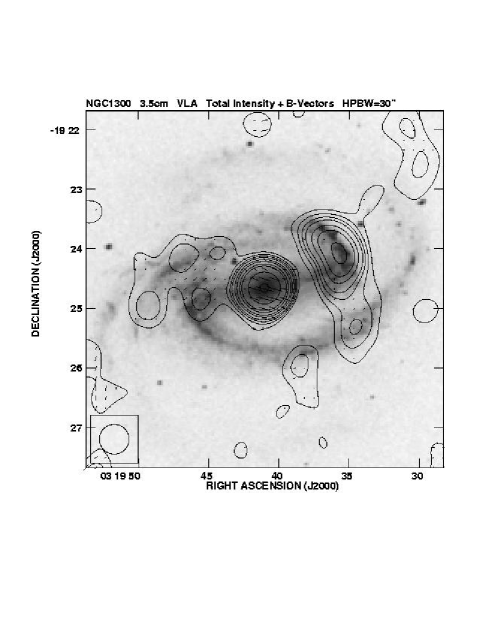
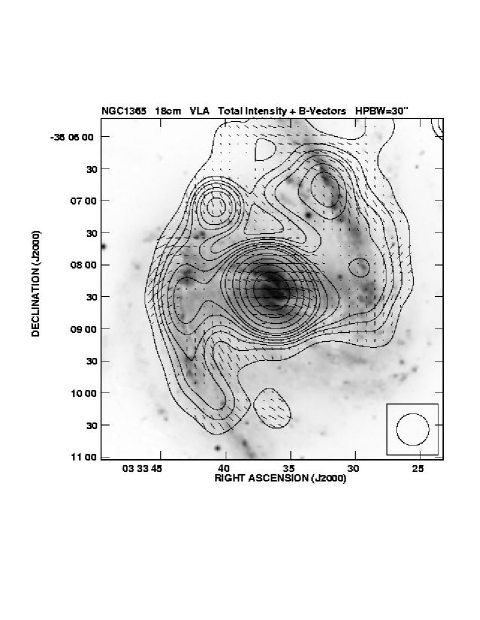
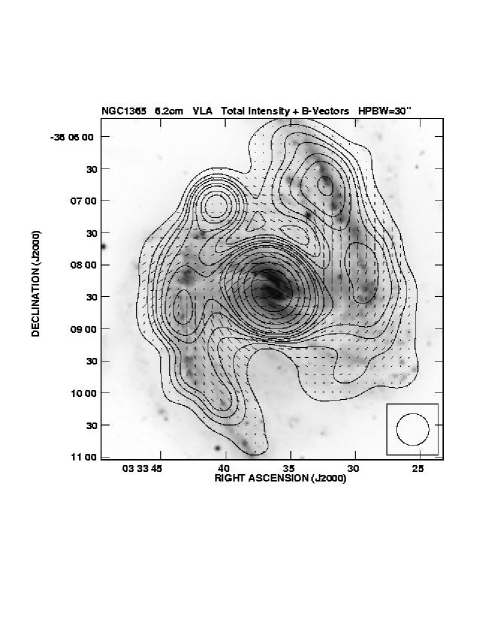
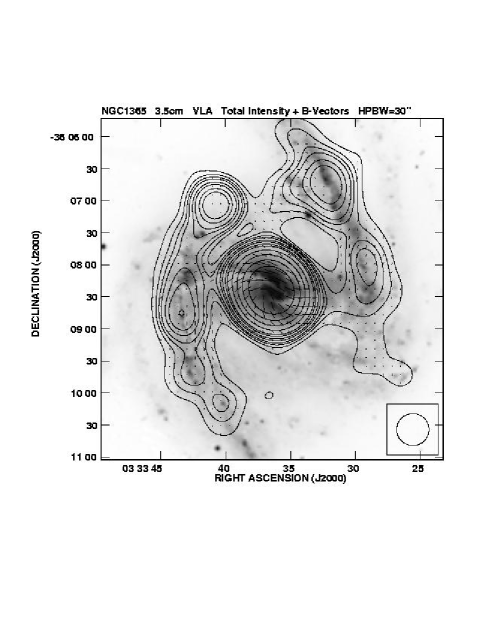
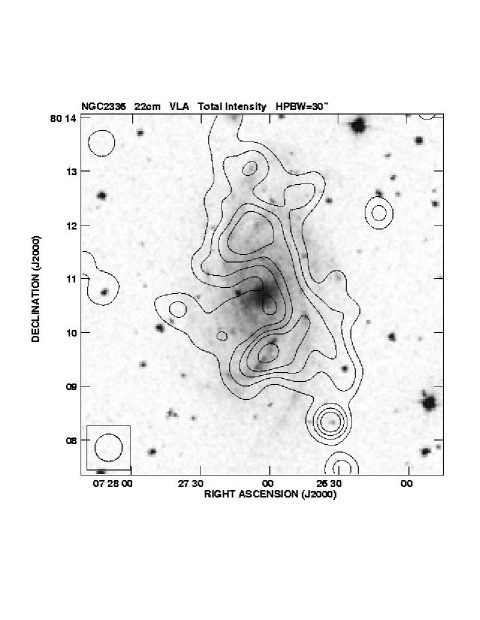
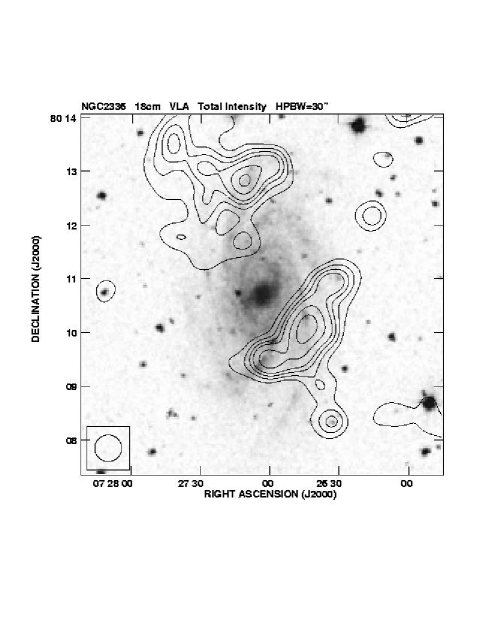
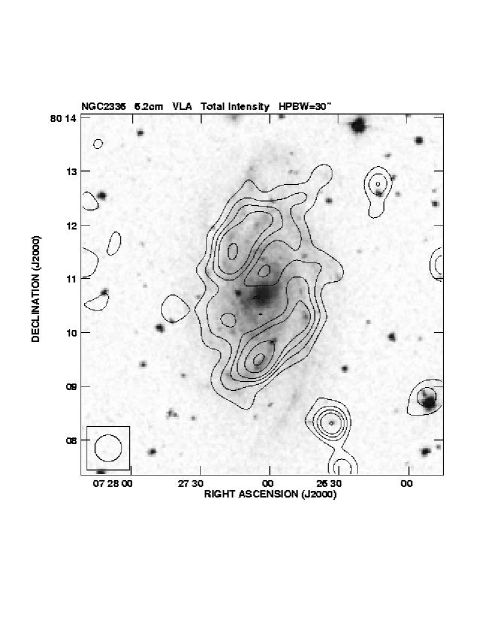
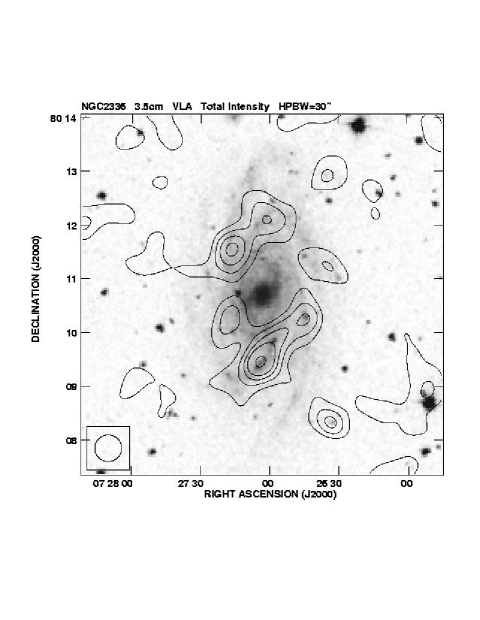
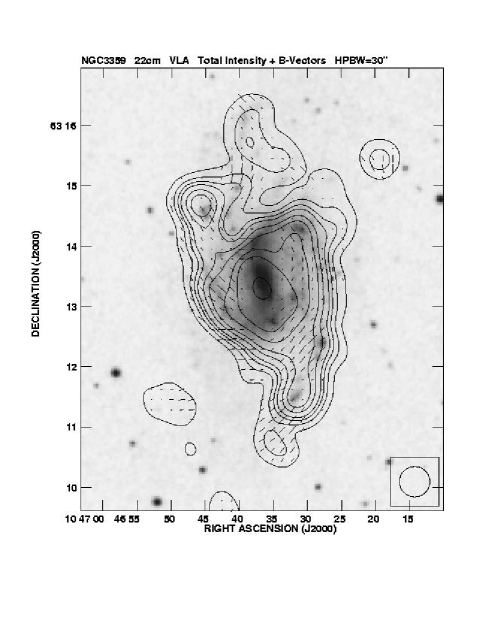
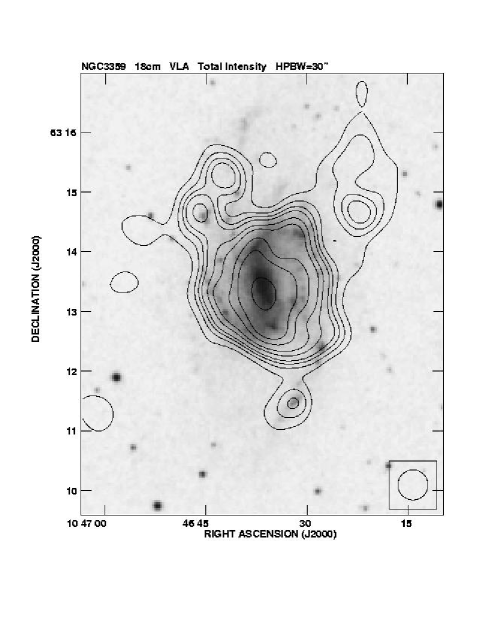
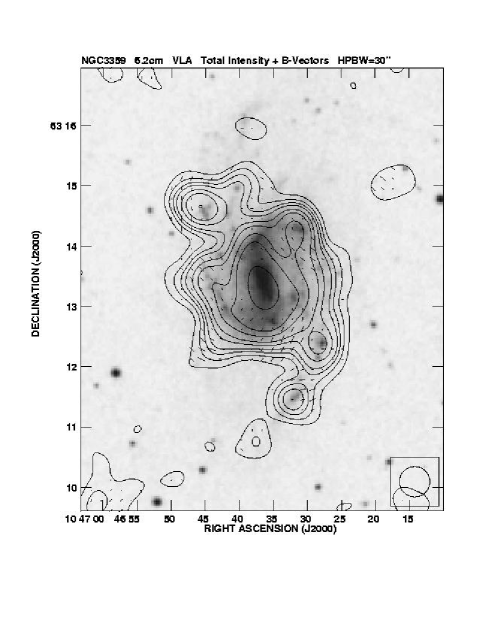
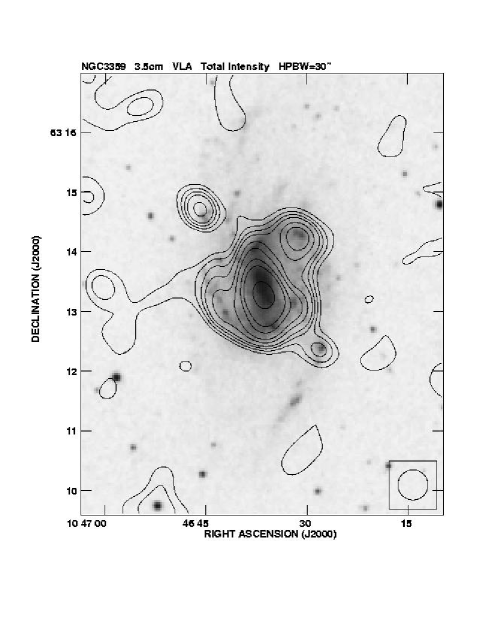
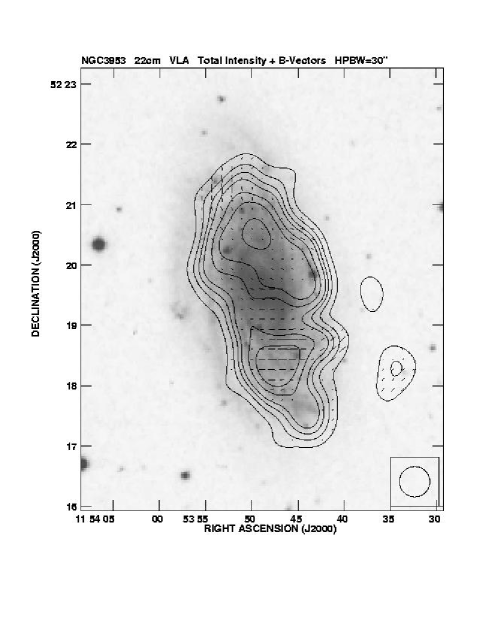
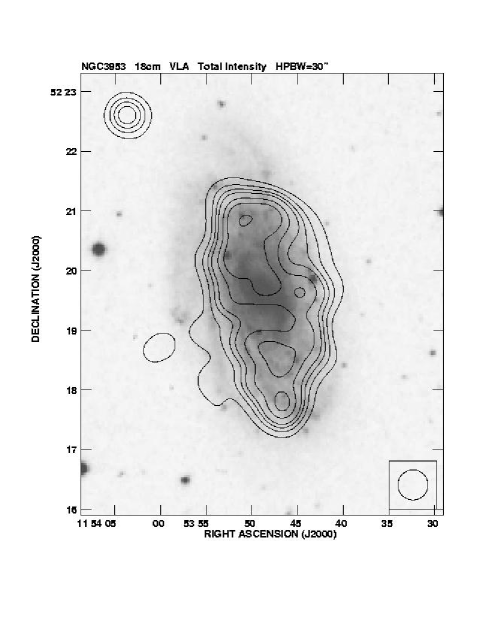
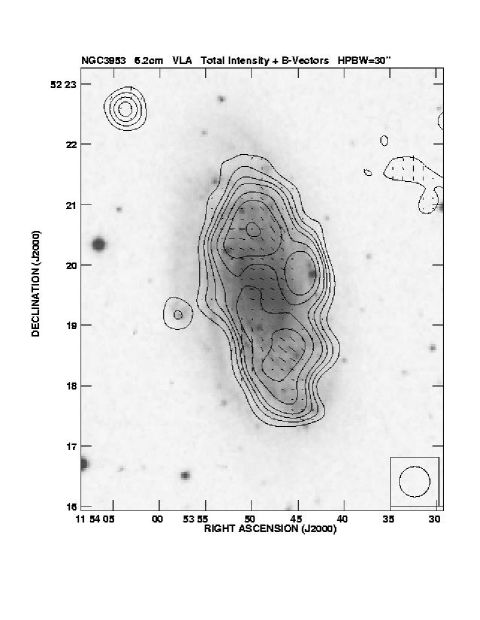
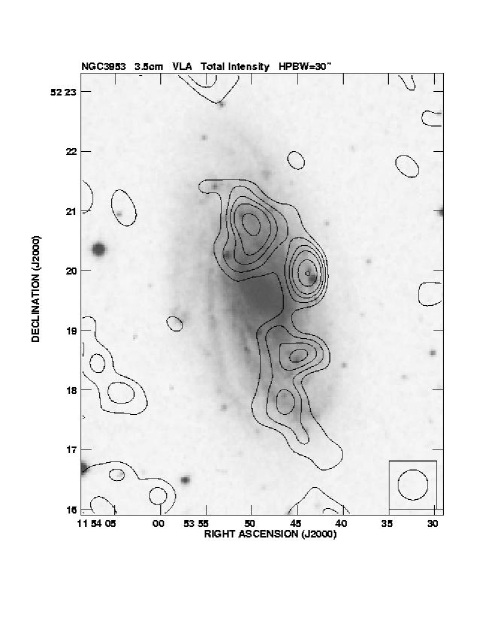
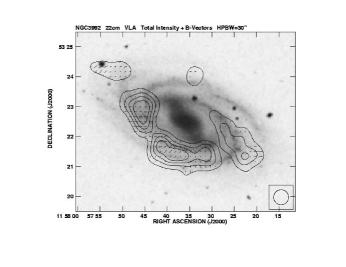
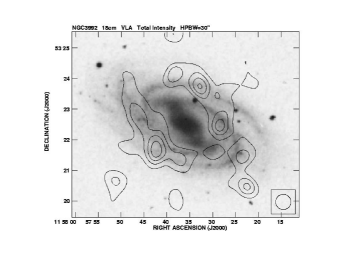
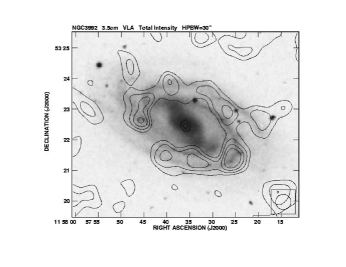
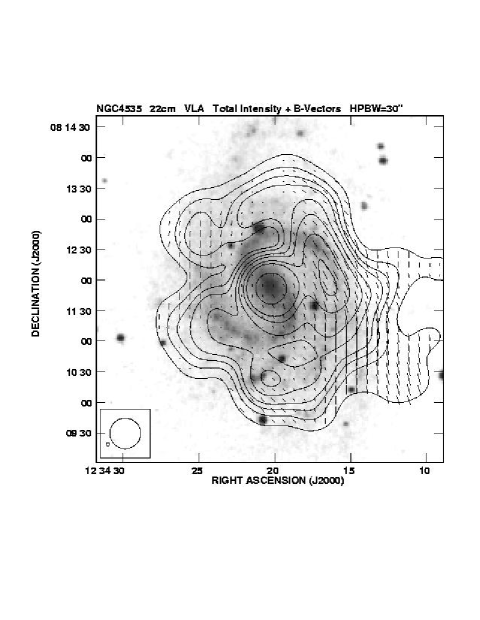
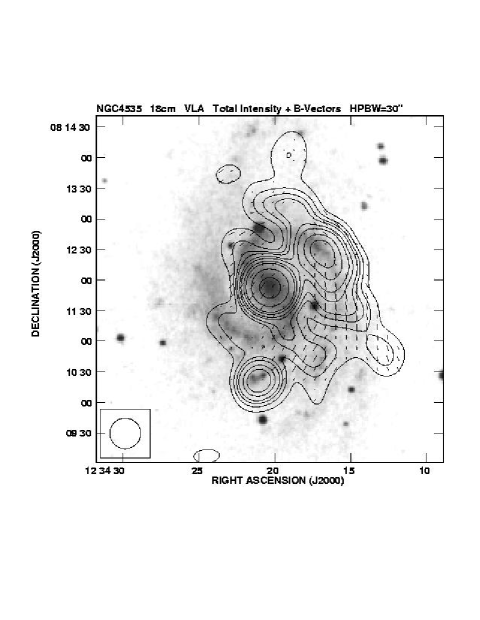
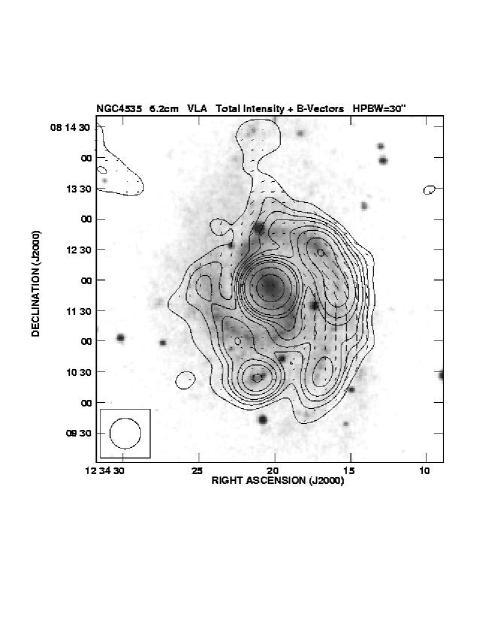
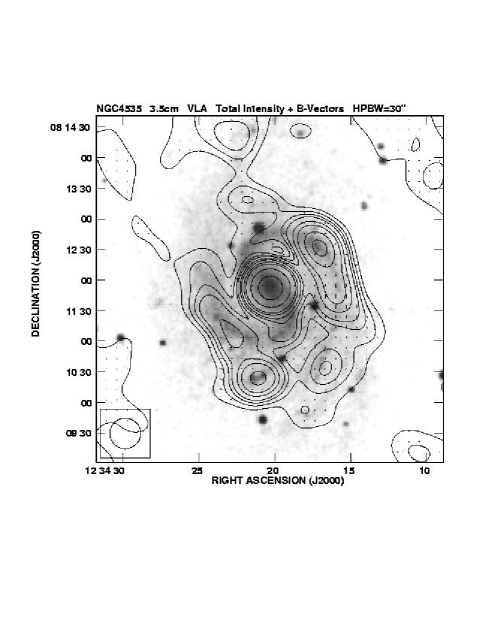
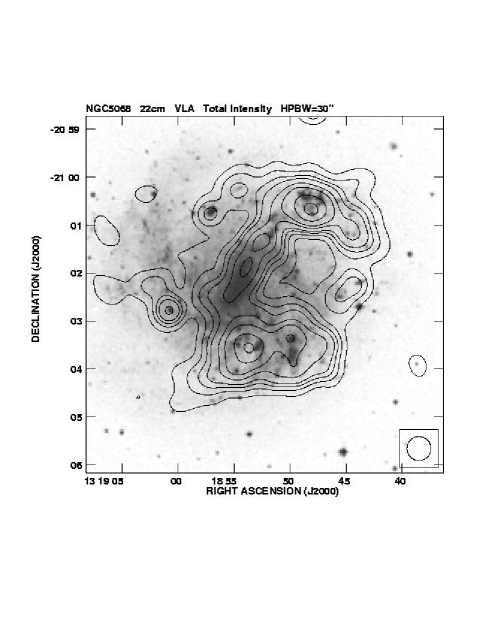
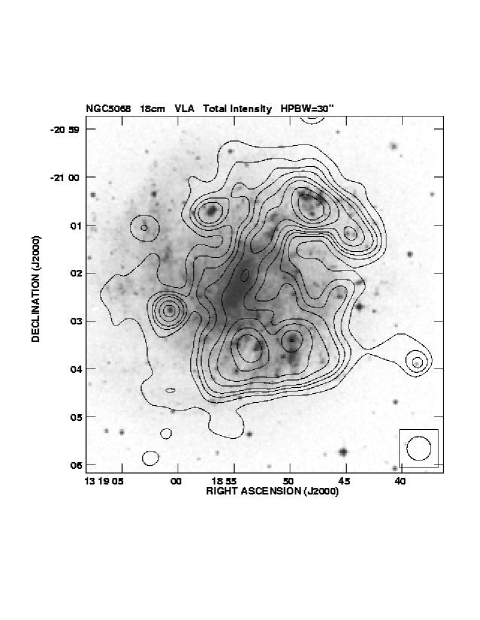
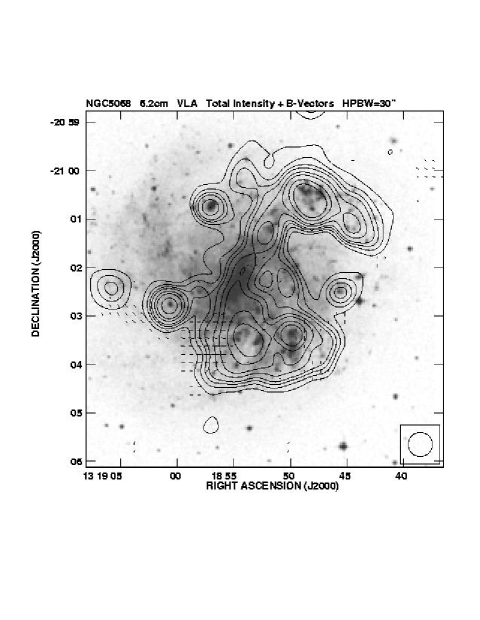
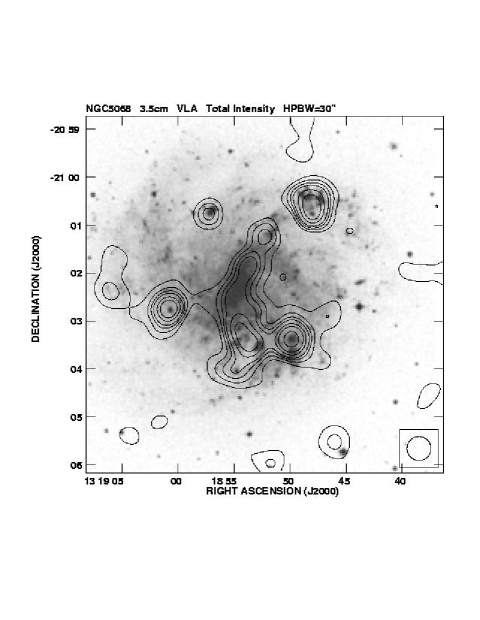
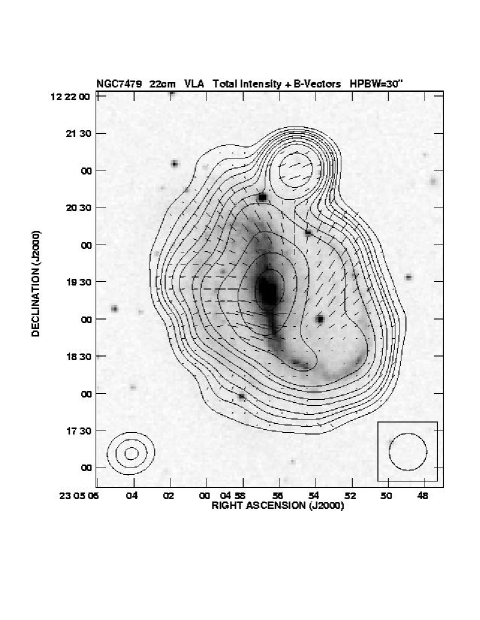
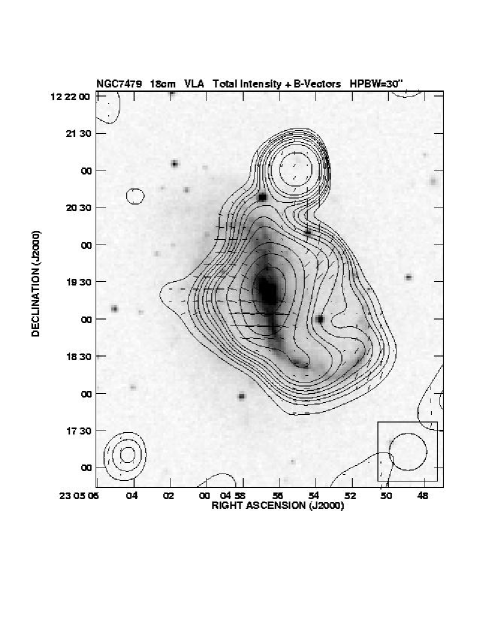
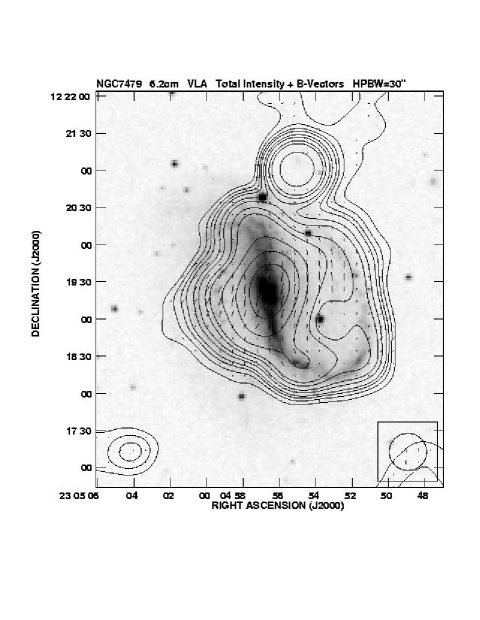
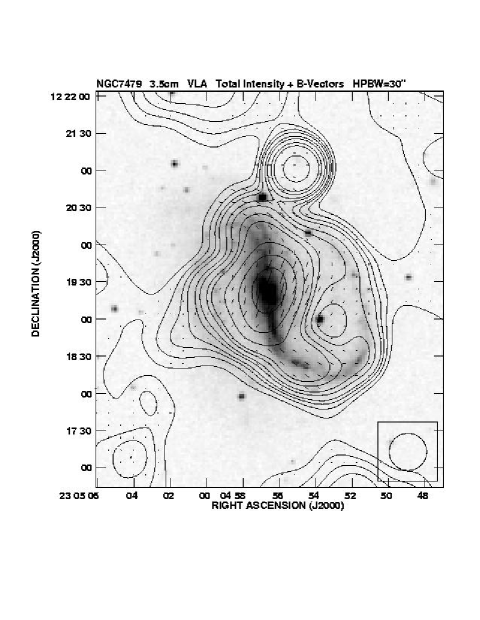
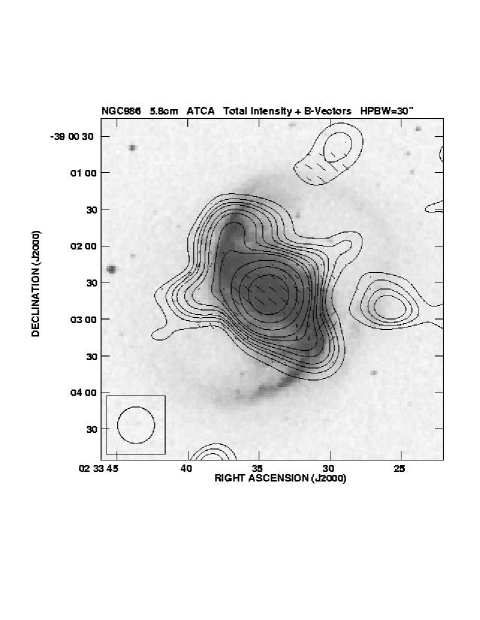
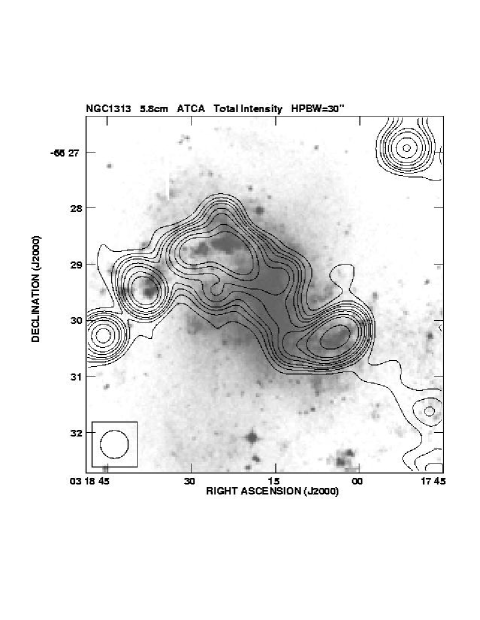
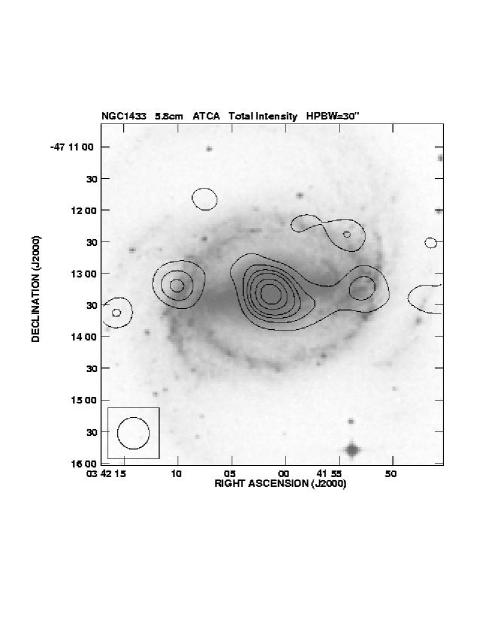
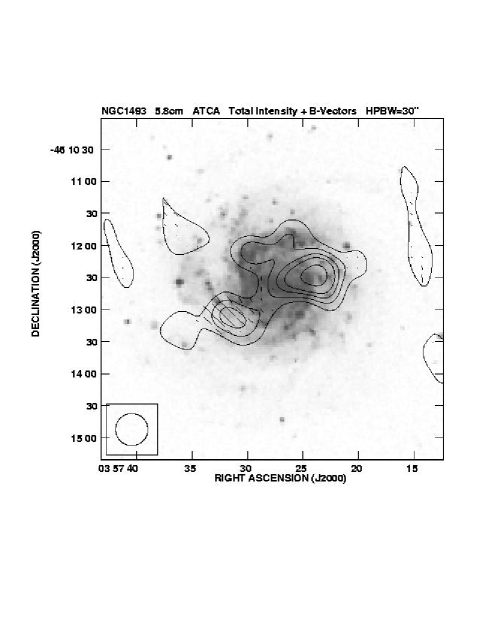
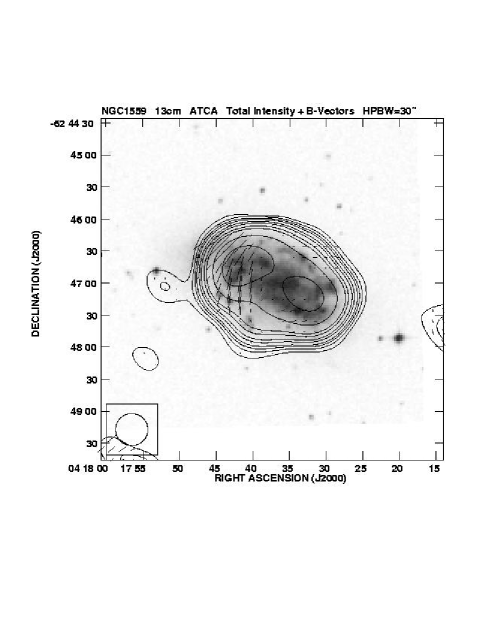
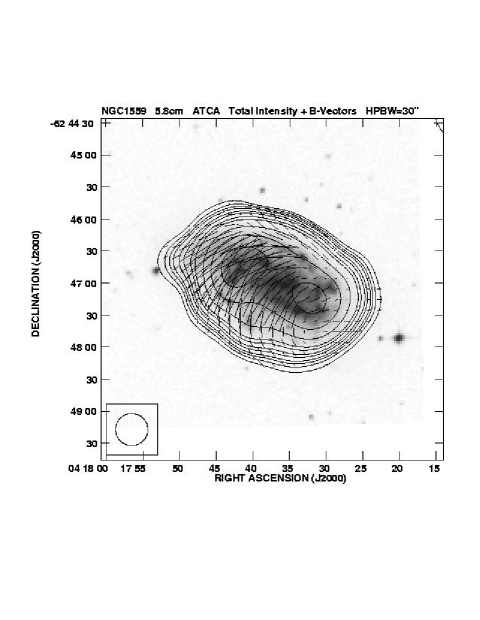
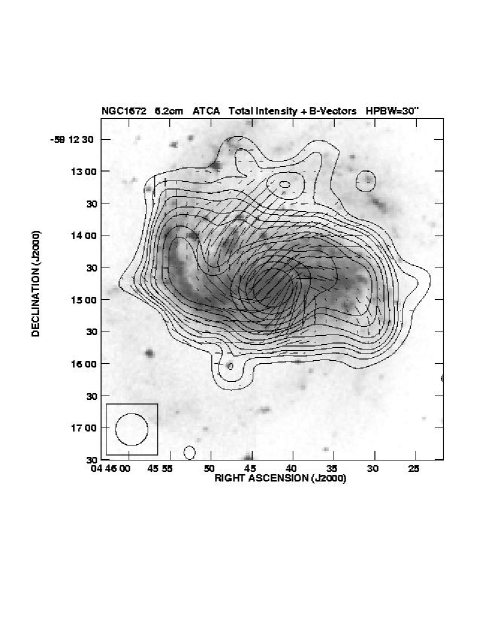
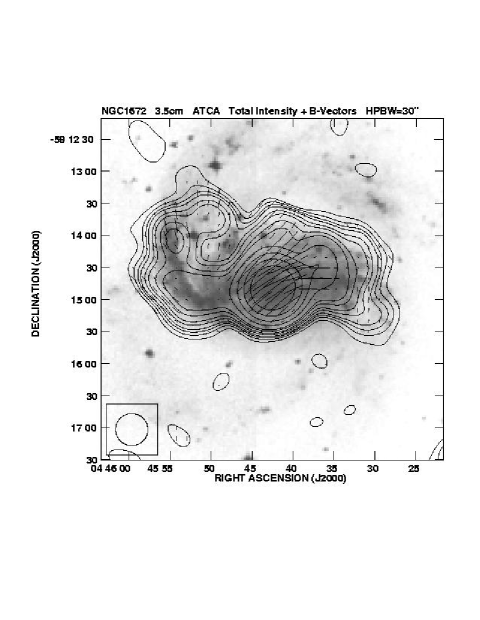
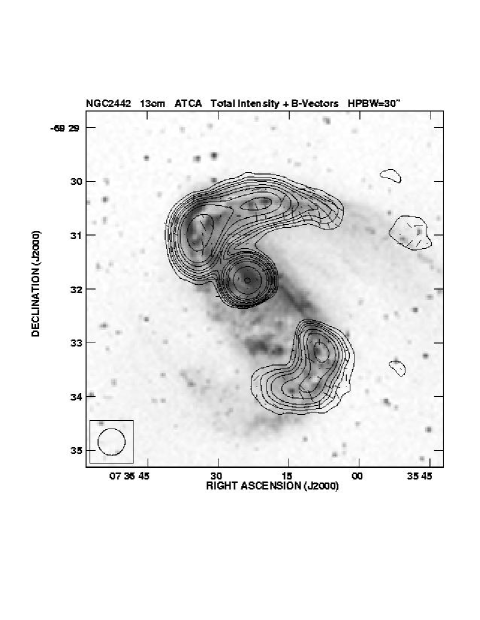
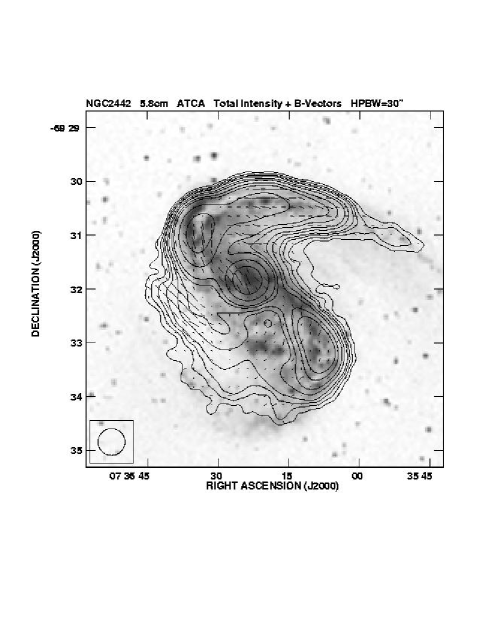
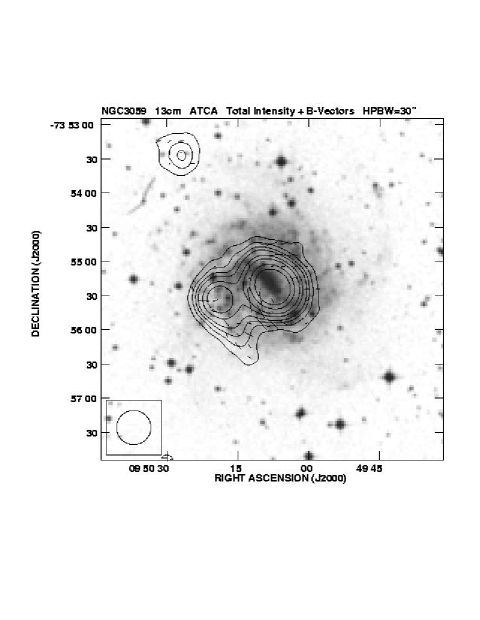
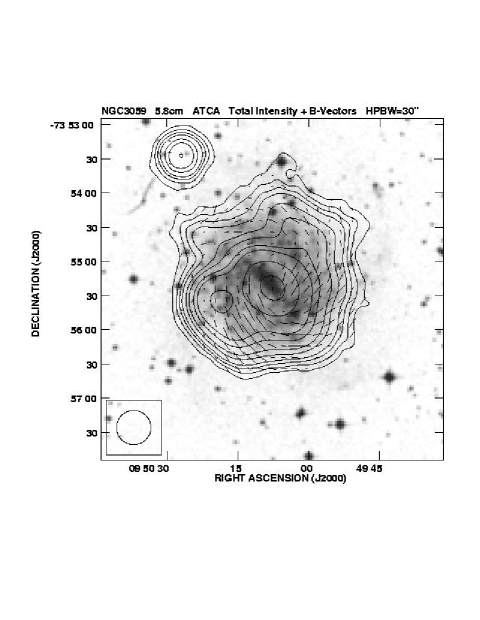
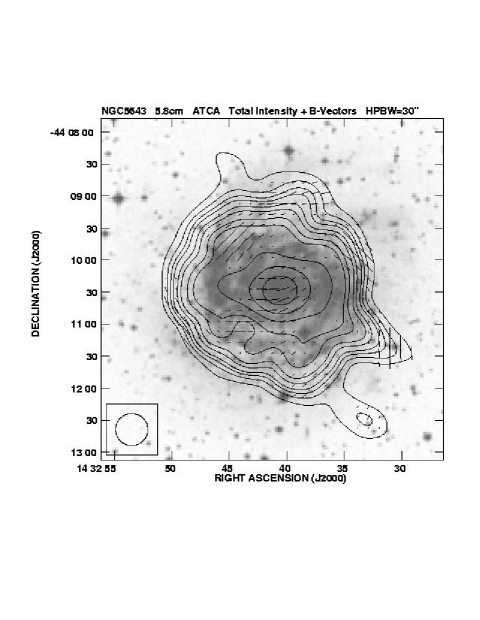
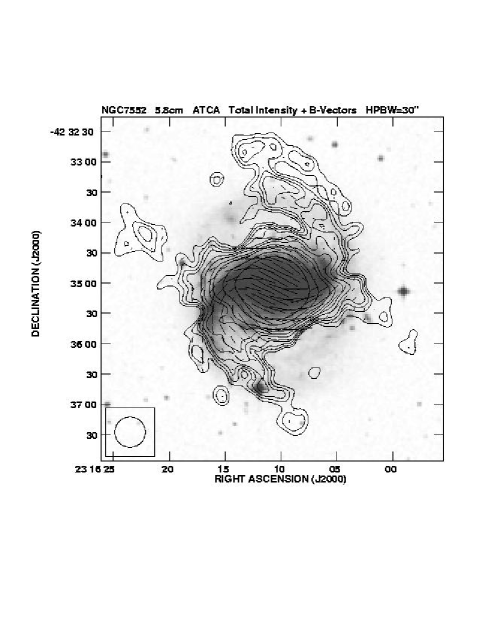
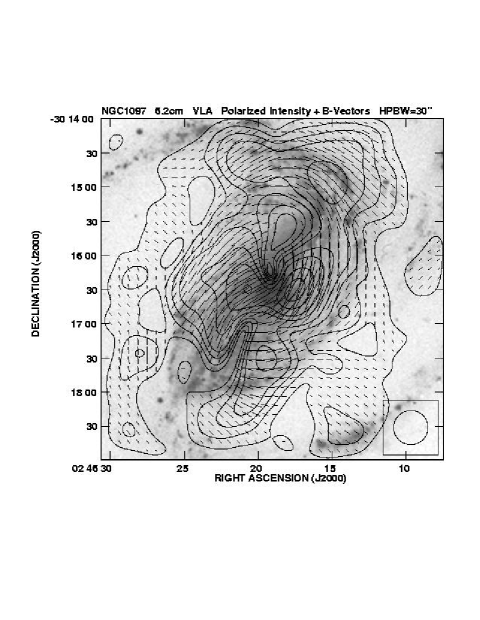
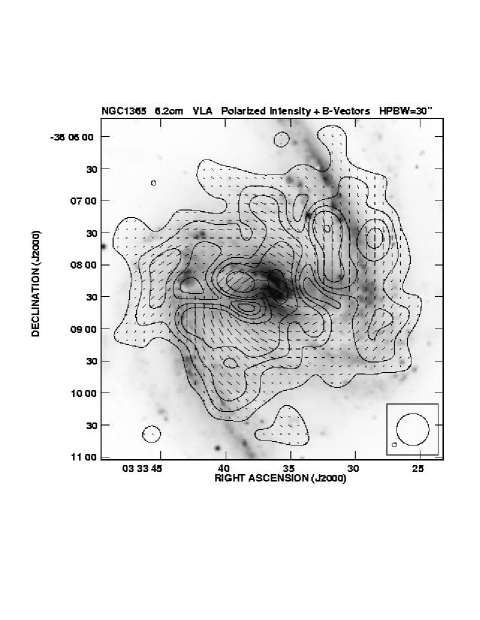
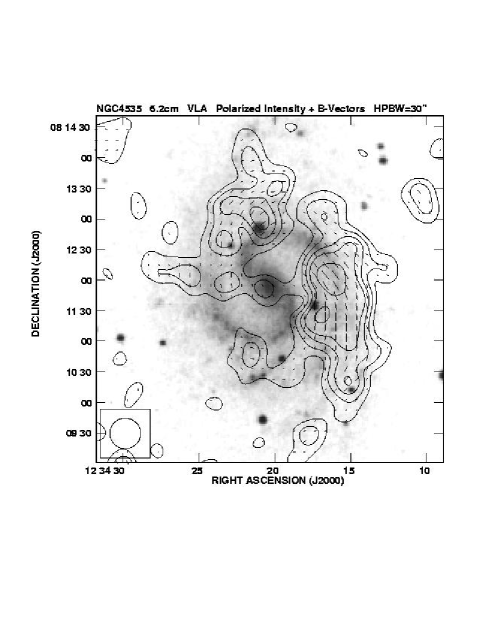
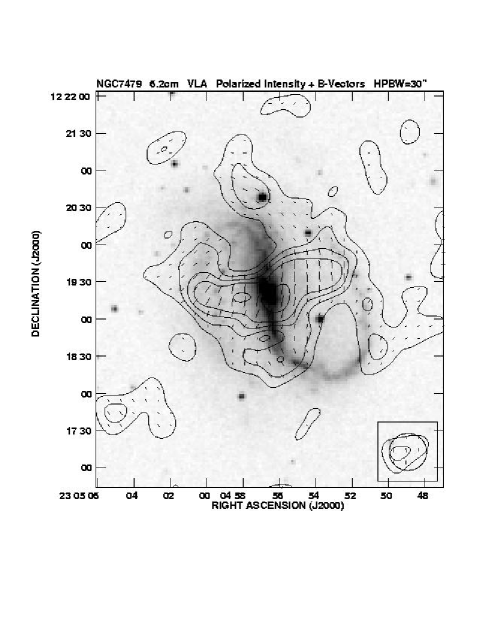
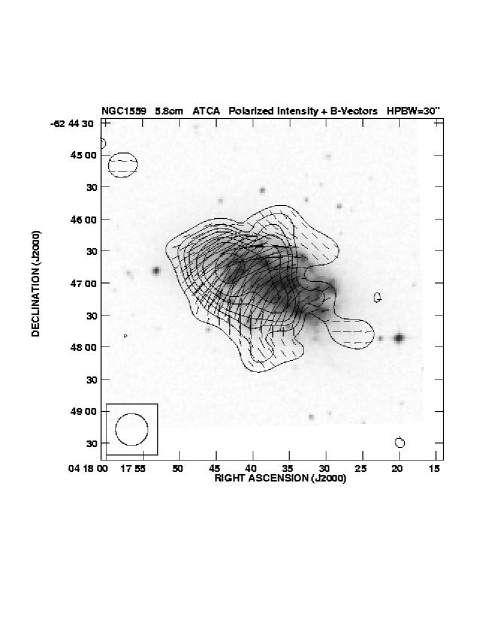
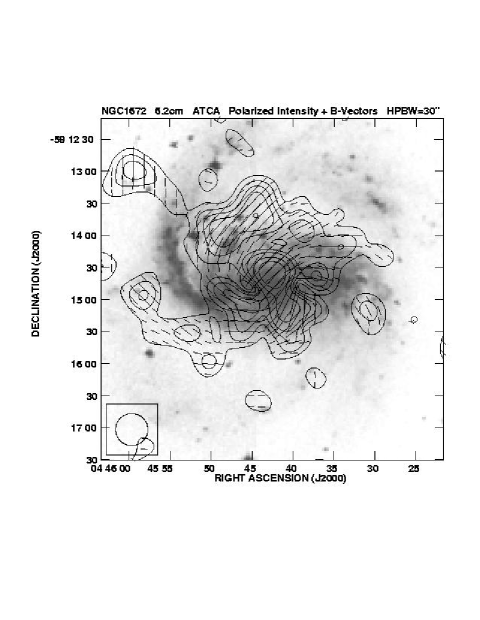
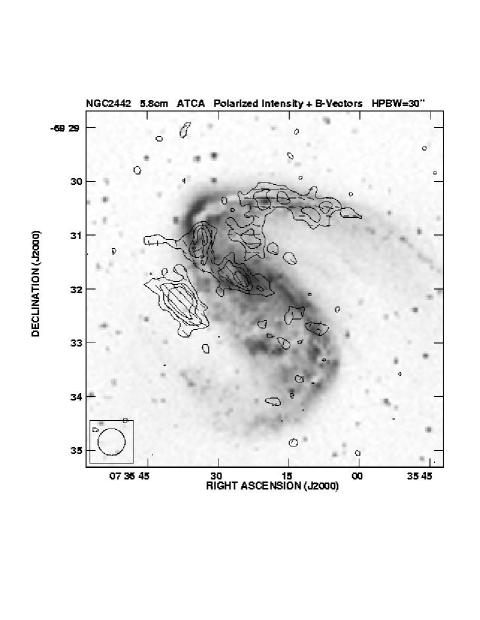
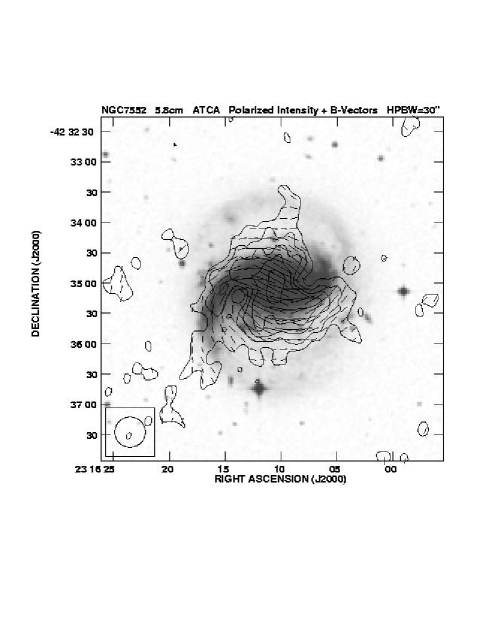
The final maps are displayed in Figs. 5–24, overlayed onto images from the Digitized Sky Surveys. 444The Digitized Sky Surveys were produced at the Space Telescope Science Institute under U.S. Government grant NAG W-2166. The images of these surveys are based on photographic data obtained using the Oschin Schmidt Telescope on Palomar Mountain and the UK Schmidt Telescope. The plates were processed into the present compressed digital form with the permission of these institutions. Contours show the total intensity at the wavelength indicated near the upper left corner of each frame, dashes indicate the orientation of the observed vector of the polarized emission turned by 90°. These ‘ vectors’ indicate the orientation of the magnetic field only in case of small Faraday rotation (see below). Due to missing spacings, the VLA maps at 3 cm and the ATCA maps at 13 cm do not show the extended emission in full.
We did not attempt to separate the thermal from the nonthermal emission because for most galaxies we have only maps at one or two wavelengths which show the full extended emission. The average thermal fraction in spiral galaxies is only 10% at 20 cm (Niklas et al. niklas+97 (1997)) which corresponds to 20% at 6 cm and 30% at 3 cm (assuming a nonthermal spectral index of 0.85).
Figures 25 and 26 show the distribution of polarized intensity PI and the observed vectors for the galaxies with the strongest polarization. We give the accurate observational wavelengths in the titles, but for ease of reading we will summarize all C-band observations as ‘6 cm’ and all X-band observations as ‘3 cm’. At the shorter wavelengths, 6 cm and 3 cm, the vectors in the Figures show the approximate orientation of the magnetic field averaged over the beam. A correction for Faraday rotation, significant at cm, was not attempted because of insufficient signal-to-noise ratios of the polarization data at these wavelengths.
In Section 4 we quote Faraday rotation measures (RM) between 22 cm and 6 cm which, however, can strongly be affected by Faraday depolarization (Sokoloff et al. sokoloff+98 (1998)). RM values between 6 cm and 3 cm were computed only for NGC 1097 and NGC 1365 for which the signal-to-noise ratio at 3 cm is sufficiently high. Correction for Faraday rotation in the Galactic foreground was not attempted.
We note that polarized emission can also be produced by anisotropic turbulent magnetic fields (Laing laing81 (1981), Sokoloff et al. sokoloff+98 (1998), Laing laing02 (2002)) which can be a result of compression and/or shearing by streaming velocities. These turbulent magnetic fields do not produce any Faraday rotation. The anisotropy of turbulence could be significant in bars. Further Faraday rotation measures with high accuracy and good resolution are required to distinguish between anisotropic turbulent and coherent regular fields in our sample galaxies.
The total and polarized intensities I and PI were integrated in concentric rings (15″ wide) defined in each galaxy’s plane, using the inclination and position angle PA given in Tables 1 and 2. The maximum radius for the integration is the outer radius of the ring where reaches the noise level. The integrated flux density is given in Tables 5 and 6. The average degree of polarization was obtained from the integrated values of I and PI. The errors in and include (as a quadratic sum) a 5% uncertainty in the absolute flux calibration and the zero-level uncertainty. In order to determine the zero level, we calculated the average surface brightness in several rings located outside the galaxy image. The rms scatter of these averages was adopted as the zero-level uncertainty.
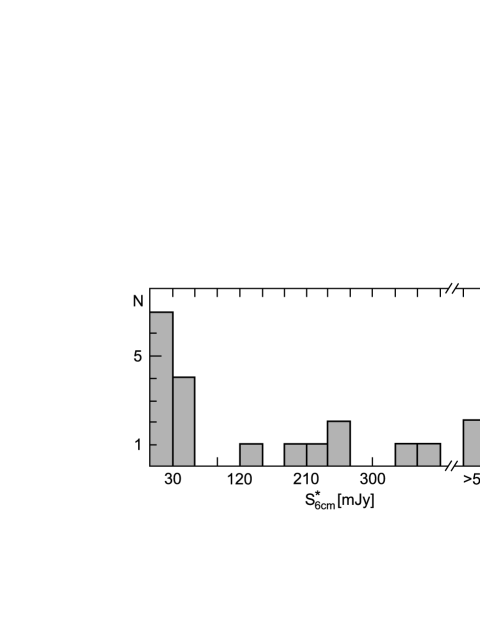
The variations of the radio flux density and far-infrared flux density between the galaxies of our sample cannot be explained by variations in distance alone. Having scaled the radio flux density at 6 cm to a common distance of 10 Mpc (, a measure of radio luminosity), we define three groups of galaxies (see Fig. 1 and column 7 of Tables 5 and 6):
-
•
Radio-weak: NGC 1300, 1313, 1433, 1493, 2336, 3059, 3359, 3953, 3992, 4535, 5068 ( mJy).
-
•
Moderate: NGC 986, 1559, 1672, 2442, 5643 (120 mJy mJy).
-
•
Radio-bright: NGC 1097, 1365, 7479, 7552 ( mJy).
Our sample is admittedly small and biased towards radio-bright galaxies. Our preliminary classification should be investigated with a larger sample in radio continuum and/or infrared emission.
The average total surface bightness was computed by dividing by the number of beams in the integration area. The results are given in column 11 of Tables 5 and 6. The error in is dominated by the uncertainty in the integration area which is estimated to be about 25%. A classification based on is similar to that based on .
4 Individual galaxies
4.1 The VLA sample
NGC 1097 (Fig. 5) has one of the intrinsically longest bars in our sample ( kpc) and is the most interesting galaxy concerning radio polarization. The nucleus (Seyfert 1 type, Storchi-Bergmann et al. storch+97 (1997)) and the circumnuclear starburst ring of 17″ ( kpc) radius (see Hummel et al. hummel+87 (1987), Gerin et al. gerin+88 (1988)) are prominent in total radio intensity. Polarized radio emission in this region reveals a spiral magnetic field extending from the circumnuclear ring towards the centre (Beck et al. beck+99 (1999)). NGC 1097 also features strong polarized emission upstream555As the gas moves faster than the pattern speed of the bar, upstream is defined as the region in front of the shock which lags behind with respect to the galaxy’s rotation. of the shock fronts (identified with the dust lanes offset from the bar major axis), where the regular magnetic field makes a large angle with the bar’s major axis and then, upstream of the dust lanes, turns to become aligned with the bar. This strong turning of polarization vectors leads to beam depolarization, so that the upstream regions appear as two elongated minima of polarized emission in Fig. 25. The enhancement of total and polarized emission in the dust lanes is only moderate and much weaker than the gas density enhancement (Beck et al. beck+99 (1999)). Extended polarized emission with apparent magnetic field orientation perpendicular to the optical spiral arms (Fig. 25) is visible in the northeast and southwest. The spiral arms outside the bar region exhibit only weak radio emission. Faraday rotation between cm and cm is generally weak, with , except in the central region where RM varies between and . RM between cm and cm is generally higher, it varies between in the upstream region and in the downstream region of the southern bar, and between and near the centre. The increase of RM with decreasing wavelength is typical for spiral galaxies (Sokoloff et al. sokoloff+98 (1998)).
NGC 1300 (Fig. 6) has one of the most pronounced optical bars in our sample. Total radio intensity is maximum in the nuclear region and at the ends of the bar where the spiral arms start (both are sites of strong star formation). No significant radio emission has been detected in the bar. The polarized emission is weak. The northern extensions visible in the maps at 22 and 6 cm are not real and result from poor data coverage in the plane. The cm and cm maps show less emission than those at cm and cm because the signal-to-noise ratios are worse.
NGC 1365 (Fig. 7) is the intrinsically largest and radio-brightest galaxy in our sample. Its bar length is 29 kpc. It has a Seyfert 1-type nucleus surrounded by a starburst region (see review by Lindblad lindblad99 (1999)). Similarly to NGC 1097, it has significant (though weaker) polarized radio emission upstream of the shock fronts and relatively weak emission enhancements on the dust lanes. The turn of magnetic field lines towards the dust lanes near the bar major axis is much smoother than in NGC 1097. The magnetic field orientations near the centre also form a spiral pattern. Sandqvist et al. (sandqvist+95 (1995)) describe a circumnuclear elliptical ring of about 1 kpc in radius, visible in radio continuum at and at a resolution of , and note its similarity to that in NGC 1097. Kristen et al. (kristen+97 (1997)) have revealed, in the optical range, a large number of bright spots arranged along the ring and suggest that the continuous ring structure might be obscured by dust absorption. The ring is not resolved in our observations. Faraday rotation between cm and cm is significant only in the central region (). RM between cm and cm jumps between and near the centre. The spiral arms outside the bar region are bright in radio and the regular magnetic field is well aligned with them (different from NGC 1097). A ridge of polarized emission (Fig. 25) is observed on the inner side of the northwestern spiral arm which may indicate field compression by a density wave, a ‘magnetic arm’, or depolarization along the optical spiral arm. This galaxy has an extended, almost circular, polarized envelope with the regular field aligned with the optical spiral arms.
NGC 2336 (Fig. 8) has a small optical bar. Two extended regions of total radio emission are prominent, but they do not coincide well with star-forming regions. No emission has been detected from the bar and the nucleus. No polarization has been detected. The northern extensions at 18 cm and 22 cm are probably not real but result from poor data coverage in the plane.
NGC 3359 (Fig. 9) has enhanced total radio emission from the bar where star formation is strong as well. The total emission from the southern spiral arm peaks in star-forming regions, which are best visible at cm. Weak polarized emission has been detected in the interarm regions with field lines parallel to the adjacent optical arm. No polarized emission has been detected from the bar, possibly due to insufficient angular resolution and depolarization.
NGC 3953 (Fig. 10) is notable for its extended, diffuse, polarized radio emission from the outer disc. No significant radio emission from the bar and the nucleus has been detected. Significant Faraday rotation between 22 cm and 6 cm occurs in the southern part of the galaxy ().
NGC 3992 (Fig. 11) features strong polarized radio emission from spiral arms with aligned magnetic fields. Weak emission from the nucleus has only been detected at 6 cm and 3 cm (the sensitivity was too low at 22 cm and 18 cm). No emission from the bar has been detected. Faraday rotation is significant () between 22 cm and 6 cm.
NGC 4535 (Fig. 12) exhibits apparently unpolarized radio emission from the central region and the bar, which is small and just resolved in our images. The polarized emission mainly comes from spiral arms with aligned magnetic fields and from the northern interarm region (Fig. 25). Faraday rotation is weak between 22 cm and 6 cm (), but larger between 6 cm and 3 cm ().
NGC 5068 (Fig. 13) has strong radio emission from the small bar and star-forming regions. Weak polarization has been detected at 6 cm in the southern part.
NGC 7479 (Fig. 14) has strong polarized radio emission, mainly due to the nuclear ‘jet’ which was discovered by Laine & Gottesman (laine+gottesman98 (1998)). The jet is not resolved in the maps presented here (Figs. 14 and 25). Total emission is enhanced in the western spiral arm. The polarized emission and Faraday rotation in this galaxy will be discussed in detail elsewhere.
4.2 The ATCA sample
NGC 986 (Fig. 15) has strong radio emission from the central star-forming region and the bar. Polarized emission is observed in the inner bar.
NGC 1313 (Fig. 16) exhibits strong radio emission from the bar and star-forming regions. No polarization has been detected.
NGC 1433 (Fig. 17) has weak radio emission from the central region which hosts an irregular star-forming ring of 5″ or kpc radius (Maoz et al. maoz+96 (1996)). Star formation has not been detected in the bar but is noticeable in the ring-like spiral arms, in particular at the ends of the bar (see H image by Crocker et al. crocker+96 (1996)) where weak radio emission is seen. No polarization has been detected.
NGC 1493 (Fig. 18) shows weak radio emission from the outer spiral arms. Polarization has only been detected in a small region in the southeast.
NGC 1559 (Fig. 19) possesses massive spiral arms with strong star formation. The small bar of about 40″ length is oriented almost east-west. Very strong radio emission originates in the bar and the disc. Polarized emission is strongly asymmetric with peaks near the ends of the bar and magnetic field lines at large angles to the bar (Fig. 26). The region where the magnetic field is strongly aligned and almost perpendicular to the bar’s major axis is larger than in NGC 1097.
NGC 1672 (Fig. 20) has the second largest bar in our sample (20 kpc). Its radio emission is very strong in the nucleus, the bar and the inner part of the spiral arm region. The nucleus is known to be of Seyfert 2 type and is surrounded by a starburst region (Evans et al. evans+96 (1996)). Polarized emission is strongest in the northeastern region upstream of the dust lanes, with magnetic field lines at large angles to the bar, smoothly turning towards the centre as in NGC 1097 and 1365 (Fig. 26).
NGC 2442 (Fig. 21), a member of the Volans Group, has an asymmetric appearance which may be a result of tidal interaction (Mihos & Bothun mihos+bothun97 (1997)) or ram pressure stripping (Ryder et al. ryder+01 (2001)). The H image by Mihos & Bothun (mihos+bothun97 (1997)) shows an unresolved central source and a circumnuclear star-forming ring of 8″ ( kpc) radius. NGC 2442 exhibits strong radio emission from the nucleus and the ends of the bar. Very strong and polarized emission has been detected in the northern arm (hosting a massive dust lane) with aligned field lines, possibly a signature of field compression and/or shearing. Diffuse radio emission is visible in the eastern part (Fig. 21), with a blob of highly polarized emission (Fig. 26). This galaxy will be discussed in Paper III (Harnett et al. harnett+02 (2002)).
NGC 3059 (Fig. 22) has a small optical bar. Diffuse, polarized radio emission has been detected in the whole disc, indicating a widespread, spiral, regular magnetic field similar to that of non-barred spiral galaxies. This is not surprising as the bar is small and under-resolved. We cannot exclude that this galaxy has a magnetic field component aligned with the bar.
NGC 5643 (Fig. 23) has strong, diffuse radio emission from the nucleus, the bar and the disc. The central region and outer disc are weakly polarized with some indication of a spiral pattern.
NGC 7552 (Fig. 24), a member of the Grus Quartet, has a starburst circumnuclear ring of 8″ ( kpc) radius, observed in radio continuum and near-infrared, a nuclear bar (observed in radio continuum and near-infrared) lying perpendicular to the primary bar, but no active nucleus (Forbes et al. 1994a ,b). It is notable for strong, highly polarized radio emission from the centre, the bar and the inner parts of the spiral arms. Our resolution is insufficient to resolve the radio ring. Polarized emission is strong upstream of the dust lanes, with magnetic field lines oriented at large angles to the bar major axis (Fig. 26); these features make this galaxy similar to NGC 1097 and NGC 1672. The outer extensions in Fig. 24 are artifacts due to unsufficient coverage. A detailed discussion of this galaxy will be given in Paper III.
| NGC | ||||||||||||||||||||||
| [mJy] | [%] | [mJy] | [%] | [mJy] | [mJy] | [%] | [mJy] | [%] | [mJy/ | [G] | [G] | |||||||||||
| b.a.] | ||||||||||||||||||||||
| 1097 | 350 | 25 | 1.5 | 0.9 | 262 | 30 | 1.3 | 1 | 142 | 12 | 359 | 8.5 | 1.0 | 94 | 18 | 5.7 | 1.7 | 1.67 | 13 | 4 | 4 | 1 |
| 1300 | 29 | 4 | 10 | 3 | [14] | — | 11 | 2 | 44 | 9 | 4 | 5 | 1 | 10 | 5 | 0.19 | 8 | 2 | 3 | 1 | ||
| 1365 | 540 | 31 | 1.6 | 0.4 | 423 | 30 | 1.7 | 1 | 206 | 13 | 744 | 2.4 | 0.5 | 116 | 10 | 2.2 | 0.6 | 2.69 | 15 | 5 | 3 | 1 |
| 2336 | 13 | 2 | [5] | — | 4.2 | 0.6 | 41 | 1.4 | 0.3 | — | 0.10 | 6 | 2 | |||||||||
| 3359 | 41 | 3 | 6 | 3 | [24] | — | 13 | 1 | 28 | 5 | 3 | [5] | — | 0.33 | 8 | 2 | 2 | 1 | ||||
| 3953 | 24 | 2 | 2 | 2 | [15] | — | 7 | 1 | 16 | 7 | 3 | [2] | — | 0.21 | 7 | 2 | 2 | 1 | ||||
| 3992 | 12 | 2 | 7 | 6 | — | — | 4.5 | 0.8 | 10 | 11 | 4 | 2 | 1 | — | 0.09 | 6 | 2 | 2 | 1 | |||
| 4535 | 43 | 4 | 9 | 5 | [19] | — | 13 | 2 | 33 | 14 | 4 | 8 | 1 | 8 | 4 | 0.21 | 8 | 2 | 3 | 1 | ||
| 5068 | 43 | 5 | — | 36 | 5 | — | 14 | 1 | 8 | 4 | 2 | [4] | — | 0.23 | 8 | 2 | 2 | 1 | ||||
| 7479 | 110 | 6 | 4 | 2 | [55] | — | 33 | 4 | 379 | 6.5 | 1.5 | 22 | 4 | 9 | 3 | 0.83 | 11 | 3 | 3 | 1 | ||
| NGC | ||||||||||||||||||||
|---|---|---|---|---|---|---|---|---|---|---|---|---|---|---|---|---|---|---|---|---|
| [mJy] | [%] | [mJy] | [%] | [mJy] | [mJy] | [%] | [mJy] | [%] | [mJy/b.a.] | [G] | [G] | |||||||||
| 986 | — | — | — | — | 38 | 3 | 246 | 2 | 1 | — | — | 0.86 | 12 | 4 | 2 | 1 | ||||
| 1313 | — | — | — | — | 20 | 3 | 3 | — | — | 0.37 | 9 | 3 | ||||||||
| 1433 | — | — | — | — | 3 | 1 | 5 | — | — | 0.06 | 6 | 2 | ||||||||
| 1493 | — | — | — | — | 3 | 1 | 4 | 6 | 4 | — | — | 0.09 | 7 | 2 | 2 | 1 | ||||
| 1559 | — | — | [150] | 0.3 | 0.1 | 105 | 6 | 232 | 3.9 | 0.4 | — | — | 4.13 | 16 | 5 | 4 | 1 | |||
| 1672 | [190] | — | [170] | — | 106 | 6 | 250 | 3.8 | 0.9 | 47 | 3 | 5.7 | 1.3 | 1.95 | 14 | 4 | 3 | 1 | ||
| 2442 | — | — | [65] | — | 74 | 4 | 201 | 2.6 | 0.5 | — | — | 1.17 | 13 | 4 | 2 | 1 | ||||
| 3059 | [45] | 11 | 8 | [16] | — | 29 | 2 | 57 | 7 | 1 | — | — | 0.65 | 11 | 3 | 3 | 1 | |||
| 5643 | — | — | — | — | 64 | 4 | 129 | 2 | 1 | — | — | 0.92 | 13 | 4 | 2 | 1 | ||||
| 7552 | — | — | — | — | 12520 | 546 | 2.0 | 0.5 | — | — | 2.16 | 15 | 5 | 2 | 1 | |||||
5 Discussion
5.1 The radio–infrared correlation
The integrated 6 cm radio flux density (Tables 5 and 6) is correlated with the integrated m far-infrared flux density (Tables 1 and 2) as shown in Fig. 2. The correlation coefficient is . NGC 1559 lies well above the fitted line, i.e., its radio emission is ‘too high’ compared with its far-infrared emission (cf. Section 5.2). This is possibly also true for NGC 1097. NGC 986 and NGC 7552 are ‘too radio-faint’, possibly due to the incomplete coverage of our observations.
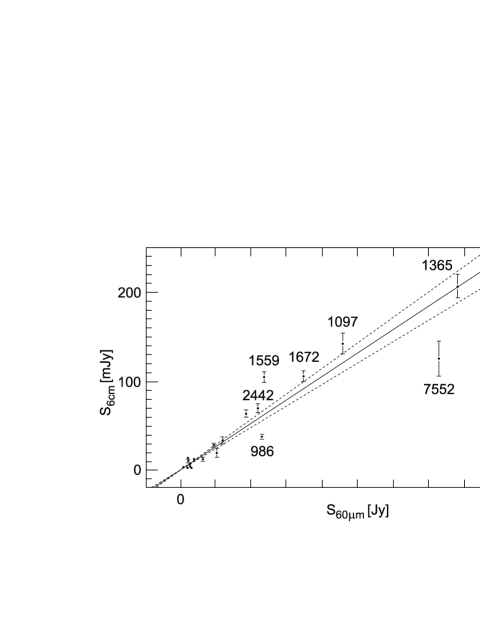
The radio–far-infrared correlation has been studied in detail for large samples of barred and non-barred galaxies. The average flux density ratio (where is measured in mJy and in Jy) is for the RC2 galaxies in the sample of de Jong et al. (jong+85 (1985)) and for the 134 galaxies observed by Unger et al. (unger+89 (1989), scaled to 6 cm). The slope of the fitted line in our Fig. 2 is , in agreement with these results. The radio continuum luminosity of spiral galaxies is also closely related to the far-infrared luminosity (Condon condon92 (1992), Niklas niklas97 (1997)).
Unger et al. found no significant difference in the radio/far-infrared ratio either between Hubble classes or between barred and non-barred galaxies. The average value of in our sample also indicates no general excess of radio emission from barred galaxies.
A close correlation between radio continuum emission and dust emission in the far-infrared has been found within many galaxies (Bicay & Helou bicay+helou90 (1990), Hoernes et al. hoernes+98 (1998)), and between radio continuum and the mid-infrared emission (m) in the spiral galaxy NGC 6946 at all spatial scales (Frick et al. frick+01 (2001)). ISOCAM images at m and m are available for several galaxies in our sample: NGC 1097, 1365, 1433, 1672, 4535 and 7552 (Roussel et al. 2001a ). The similarity to our radio maps is striking and shows that the relationship holds not only for the integrated flux densities and luminosities, but also for spatial scales down to our resolution.
As synchrotron emission dominates at radio wavelengths longer than about 3 cm, the radio–infrared correlation cannot be explained solely by thermal processes. Various interpretations are dicussed by Hoernes et al. (hoernes+98 (1998)). As suggested by Niklas & Beck (niklas+beck97 (1997)), the radio–[far-]infrared correlation for bright galaxies holds if the magnetic field is connected to the star formation rate where the gas clouds may serve as the physical link. For radio-weak galaxies, however, the far-infrared emission is dominated by cold dust heated by the general radiation field which is not related with recent star formation (Hoernes et al. hoernes+98 (1998)). Most of the galaxies in our sample are bright enough to ensure that their far-infrared emission is indeed a measure of star formation intensity.
In normal spiral galaxies, cool gas and magnetic fields are compressed in various shocks, followed by an increase in star formation. However, large-scale shock fronts in a galaxy do not always enhance star formation. For example, the non-barred spiral galaxy NGC 2276 interacts with some external (intracluster) gas, so that a large-scale shock front forms on the leading side producing a ridge of strong total and regular magnetic field without significant effect on star formation (Hummel & Beck hummel+beck95 (1995)). As a consequence, this galaxy deviates from the radio–far-infrared correlation.
Barred galaxies also host large-scale shock fronts, identified with dust lanes. However, shock fronts in bars are non-standard shocks in that they have enhanced velocity shear across them, similar to bow shocks. If the shear rate exceeds the inverse time for star formation, the gas density enhancement in the shock does not trigger star formation. If the magnetic field is compressed in the shock, the ratio of radio/far-infrared flux densities would be higher than normal. However, for our sample this ratio and the average total field strengths (Sect. 5.3) are similar to those of non-barred galaxies. This indicates that large-scale field compression in the bar is generally small and that the magnetic field is not frozen into the flow in the regions of strong compression and shear (the dust lanes). Nevertheless, the average surface brightness in radio continuum and far-infared increases with increasing bar length (see Sect. 5.2).
5.2 Radio emission and bar strength
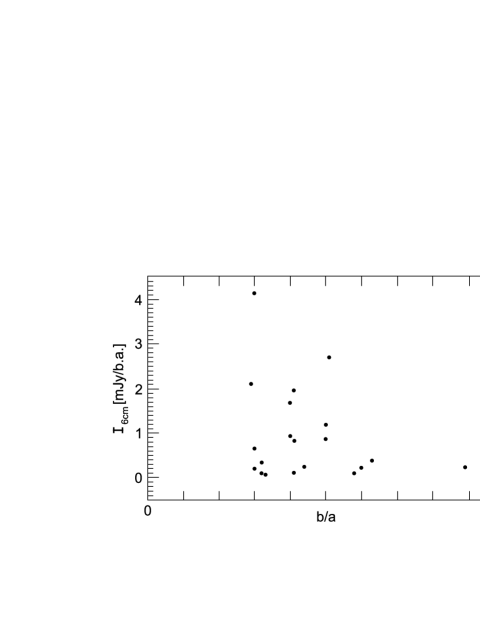
Several quantitative measures of bar strength have been suggested. Most of them are based on purely geometric parameters such as the bar axial ratio, where a smaller value of means a stronger bar (Martin martin95 (1995), Aguerri aguerri99 (1999), Chapelon et al. chapelon+99 (1999), Abraham & Merrifield abraham+merrifield00 (2000)). Smallest values of in our sample are found in NGC 1300, 1433, 1493, 1559, 3059, 3359 and 7552 (see Tables 1 and 2), but only NGC 1559 and NGC 7552 have a high surface brightness in radio continuum (see Tables 5 and 6) and far-infrared. NGC 1365 has the highest radio flux density in our sample, although the aspect ratio of its bar is relatively small (). However, it hosts the longest bar ( kpc) in the sample. NGC 1559, 1672 and 7552 are fainter mainly because they are smaller. Their (distance-independent) radio surface bightness values (measured in Jy/beam area) are similar to or even larger than that of NGC 1365 (see column 11 in Tables 5 and 6), and the same is true for the typical far-infrared surface brightness, which is a measure of star formation rate per surface area. Fig. 3 confirms that the radio surface brightness is uncorrelated with the aspect ratio (correlation coefficient of ).
A physically motivated measure of the bar strength has been introduced by Buta & Block (buta+block01 (2001)) and Block et al. (block+01 (2001)) based, following Combes & Sanders (combes+sanders81 (1981)), on the maximum amplitude of the tangential gravitational force relative to the mean axisymmetric radial force. Thus defined, the strength parameter is sensitive not only to the bar ellipticity, but also to its size and mass, and is related to the quadrupole moment of the bar potential (P. Englmaier, priv. comm.). A reliable estimation of involves careful analysis of near-infrared galactic images (Quillen et al. quillen+94 (1994)). Buta & Block (buta+block01 (2001)) and Block et al. (block+01 (2001)) determine for a selection of galaxies, but only six of them belong to our sample. Therefore, we consider a simpler (and admittedly incomplete) measure of the bar strength described in what follows.
The quadrupole moment, with respect to the major axis, of a homogeneous triaxial ellipsoid with semi-axes and is given by where is the mass of the ellipsoid (Landau & Lifshitz landau76 (1976)). Assuming that the vertical scale height of the bar is much smaller than its size () (e.g., Buta & Block buta+block01 (2001)), the quadrupole moment normalized to (with the mass within the radius ) is given by
| (1) |
where and are the average mass surface densities of the bar and within , respectively, and we have omitted numerical factors of order unity. The relative bar length , rather than the bar axial ratio, is the dominant factor in . Moreover, 70% of galaxies in our sample have , and varies just by 30% for . Therefore, is a poor measure of bar strength, especially for our sample, as it does not discriminate well enough between galaxies with .
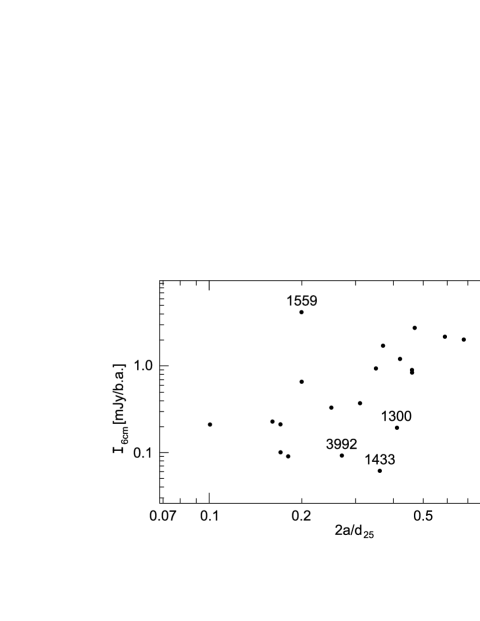
Since depends strongly on the relative bar length , we can reasonably expect that radio emission is correlated with this parameter. This expectation is confirmed by the high correlation between the radio surface brightness at and the relative bar length (correlation coefficient of , with NGC 1559 excluded – see below), confirmed by Student’s test. Fig. 4 shows this correlation in logarithmic scales. Although the scatter is stronger than that in Fig. 2, the correlation is not weaker than other correlations discussed for barred galaxies in the current literature (cf. Chapelon et al. chapelon+99 (1999)). We conclude that a stronger bar results in an overall enhancement of the total radio emission in the bar region despite a relatively weak compression of the regular magnetic field near the dust lanes, as discussed in Section 5.1. As noted by Block et al. (block+01 (2001)), longer bars can produce more extensive deviations form axial symmetry in the gas velocity because the relative tangential force is stronger when the end of the bar is farther from the (axisymmetric) bulge; this may be the physical reason for the correlation shown in Fig. 4.
With the most strongly deviating galaxy excluded (NGC 1559), the data shown in Fig. 4 can be fitted with a power law
A similar dependence is valid for the far-infrared surface brightness (exponent ).
We have been unable to include the dependence on the surface mass densities into our measure of the bar strength, and this plausibly contributes into the scatter of the data points around the fit. It is difficult to say whether or not is correlated with . If is independent of , the above fit implies an approximate scaling
There are a few deviations from the above correlation (see Fig. 4). NGC 1559 has the largest ratio of radio to far-infrared flux densities and the highest radio surface brightness, and so deviates strongly from the radio–infrared correlation as well (see Fig. 2). NGC 1559 is not a member of any group or cluster of galaxies and has no nearby companion (Zaritsky et al. zaritsky+97 (1997)). High-resolution radio and optical observations are required.
On the other hand, NGC 1300, 1433 and 3992 are radio-weak in spite of their relatively long bars (Fig. 4). Their far-infrared flux density and thus their star formation rate is low. Apart from an usually small value of for these galaxies, other reasons for these deviations are concievable. Martinet & Friedli (martinet+friedli97 (1997)) argue that some galaxies with strong bars have settled into a quiescent state after an episode of vigorous star formation which has transformed most of the gas into stars. Alternatively, Tubbs (tubbs82 (1982)) and Reynaud & Downes (reynaud+downes98 (1998)) found indications for suppression of star formation in fast flows of the gas along the bar. The field strength should be low in the first case, because there is not enough gas to hold the field or the dynamo is not able to maintain a strong magnetic field. In the second case the field should be strong, but the galaxy does not host enough cosmic-ray electrons to generate strong synchrotron radiation. This can be verified by comparing regular magnetic field strengths deduced from Faraday rotation and polarized intensity from further radio observations with higher sensitivity.
Measurements of the star formation efficiency SFE may also help: In the first case, the content of molecular gas should be low, with a SFE similar to that in spiral galaxies, while in the second case the SFE should be exceptionally small. Existing data seem to favour a higher SFE in barred galaxies compared to non-barred ones (Young young93 (1993)), but the infrared luminosity is dominated by the central region where star formation is triggered by gas inflow (see Roussel et al. 2001b ). The SFE in the bar itself (and its possible suppression by a fast gas flow) should be subject to future investigations.
5.3 Magnetic field strength
The estimates of the total magnetic field strength in our Galaxy, derived from -ray data and the local cosmic-ray energy density (Strong et al. strong+00 (2000)), agree well with equipartition values from radio continuum data (Berkhuijsen, in Beck beck01 (2001)), so that the equipartition assumption is a useful estimate, at least on scales of more than a few kpc.
From the integrated flux density at 6 cm and the solid angle of the integration area, the surface brightness and the corresponding equipartition strength of the total magnetic field were computed (Tables 5 and 6), assuming for all galaxies a thermal contribution to the surface brightness at cm of 20% and a spectral index of the nonthermal emission of 0.85, which is the mean value for spiral galaxies of type Sb and later (Niklas et al. niklas+97 (1997)).
Spectral indices between cm and cm () can be computed from our VLA data (given in Table 5). The values lie in the range 0.71 and 0.97 which is in the range typical of normal spiral galaxies (Niklas niklas95 (1995)). Nonthermal spectral indices cannot be determined with data at only two frequencies.
We adopted the standard cosmic-ray proton-to-electron ratio of 100, a pathlength through the disc of 1 kpc/, and assumed that the regular field is in the galaxy’s plane and the random field is statistically isotropic. Uncertainties in any of these parameters of lead to an error of in . We estimate the total error in to be about 30%. The relative errors between galaxies are smaller because some of the input parameters (e.g. the proton-to-electron ratio) are not expected to vary strongly from one galaxy to another.
With the above assumptions, is related to the average synchrotron volume emissivity and surface brightness (neglecting a term weakly varying with inclination ) by
Note that the equipartition field strengths are about 10% larger than the field strengths derived from the standard minimum-energy formula (which should be used with caution, see Beck beck00 (2000)).
The average total magnetic field strength , according to Tables 5 and 6 (representing the average synchrotron emissivity), is a function of neither Hubble type (SBb–SBc) nor luminosity class (I–III), which has also been found for a much larger sample of barred and non-barred spiral galaxies (Hummel hummel81 (1981)). The average total field strength is for our sample, similar to the average minimum-energy field strength of for the large galaxy sample (Hummel et al. hummel+88 (1988)) and to the mean equipartition value of of the sample of 146 late-type galaxies calculated by Fitt & Alexander (fitt+alexander93 (1993)), corrected to . Niklas (niklas95 (1995)) derived a mean equipartition value of for his sample of 74 spiral galaxies. Hummel (hummel81 (1981)) also found no significant emissivity difference between barred and non-barred galaxies.
The following galaxies have the strongest total magnetic field in our sample, as evidenced by their high radio surface brightness: NGC 1365, 1559, 1672 and 7552 (see Tables 5 and 6). This indicates that the total field strength is highest for galaxies with the (relatively) longest bars, with the exception of NGC 1559 that has a short bar (see Fig. 4).
The last column in Tables 5 and 6 gives the average equipartition strength of the resolved regular magnetic field, derived from the polarized surface brightness averaged over the galaxy. , in contrast to , depends on the linear resolution within a galaxy and thus on its physical size, its distance and its inclination. However, and in Tables 5 and 6 do not correlate with distance of the galaxy. As a test, we smoothed the 6 cm map of NGC 1097 by enlarging the beam size from 30″ to 60″ and to 90″ which corresponds to increasing the galactic distance by factors 2 and 3. The degree of polarization decreased from 8.5% to 7% and 6%, respectively, and the strength of the resolved regular magnetic field decreased from 4.3 to 4.0 and , respectively, remaining above the sample average. Hence the values of and in Tables 5 and 6 seem to depend only weakly on distance to the galaxies, implying that our observations generally resolve most of the structure in the regular magnetic field, at least for large galaxies and at distances of up to about 40 Mpc.
Average polarized surface brightness (and thus ) values are similar for the galaxies of our sample. The exceptions are NGC 1097 and NGC 1559 with , above the average of . NGC 1097 probably drives a strong dynamo where field amplification is supported by shear in the velocity field (Moss et al. moss+01 (2001), Paper II). The degree of polarization at 6 cm, signature of the degree of uniformity of the resolved field, is also high in NGC 1097 (see Fig. 25). NGC 1559, 1672 and 7552 are similar candidates for a strong dynamo, but the present radio observations (Fig. 26) have insufficient linear resolution at the relatively large distances of these galaxies to reveal the true strength of the regular fields and their detailed structure.
NGC 1300, NGC 3992 and NGC 4535 have the highest degrees of polarization but only low total surface brightness. They host weak but ordered magnetic fields with spiral patterns, similar to those in non-barred galaxies (Beck beck00 (2000)).
5.4 Bars and global magnetic field structure
A classification system of barred galaxies was introduced by Martinet & Friedli (martinet+friedli97 (1997)), based on the axis ratio (see Tables 1 and 2) and on the star formation rate (SFR) measured by the far-infrared luminosity. Galaxies with large are generally weak in star formation (class I), but some have a high SFR (class II). Galaxies with small have a large spread in SFR: from high (class III) to weak (class IV). Galaxies of class IV in Martinet & Friedli have strong bars, but low SFR (see Sect. 5.2).
Here we propose that there are basic differences among barred galaxies concerning their magnetic field structure and strength which may reflect physical properties of barred galaxies like the gas flow, the shock strength in the bar and the presence of a circumnuclear ring.
Firstly, barred galaxies can have low radio luminosity because they are small (NGC 1313, 1493 and 5068), or because their gas content and star formation activity is small in spite of their large bars (NGC 1300 and 1433). Little or no polarization is detected in these galaxies. In galaxies with small bars the radio continuum morphology is formed as a result of star formation in the spiral arms, as in NGC 2336, 3359, 3953, 3992, 4535, 5643, and also M83 observed previously by Beck (beck00 (2000)). The bar is of little importance for the overall radio properties of these galaxies. The average degree of radio polarization (i.e., the degree of field regularity) seems to be controlled by the spiral structure rather than the bar, being low in flocculent spirals and high when massive spiral arms are present. Regular fields are often enhanced in interarm regions between optical spiral arms, e.g. in NGC 3359, NGC 4535 and M83, similar to non-barred galaxies.
Secondly, galaxies with long bars and strong star formation have a high radio luminosity and a strong total magnetic field () (NGC 1097, 1365, 1672, 2442 and 7552, and also NGC 3627 observed previously by Soida et al. soida+01 (2001)). NGC 1097, 1365, 1672 and 7552 have a high polarization surface brightness and a strong regular field which is enhanced upstream of the shock fronts in the bar. The magnetic field lines upstream of the dust lanes are oriented at large angles with respect to the bar and turn smoothly towards the dust lanes along the major axis of the bar. This is accompanied by large-scale field enhancements associated with, e.g., strong shear in the velocity field and/or strong dynamo action rather than enhanced gas density. Gas inflow along the bar may lead to circumnuclear rings which have been detected already in NGC 1097 (Hummel et al. hummel+87 (1987), Gerin et al. gerin+88 (1988)), NGC 2442 (Mihos & Bothun mihos+bothun97 (1997)), NGC 7552 (Forbes et al. 1994a , 1994b ) and possibly in NGC 1365 (Sandqvist et al. sandqvist+95 (1995)), and should be searched for in the other radio-bright galaxies.
NGC 7479 is anomalous in the radio range as it possesses a nuclear ‘jet’ (Laine & Gottesman laine+gottesman98 (1998)). Indications of a weaker nuclear jet have been found in NGC 1365 by Sandqvist et al. (sandqvist+95 (1995)).
For NGC 986, 1559 and 3059 the resolution and sensitivity of the present observations are insufficient to reveal their detailed field structure.
NGC 7552 is a special case. Its radio surface brightness is high (i.e., the total magnetic field is strong, see Table 6), but still too low to be consistent with its far-infrared flux density (see Fig. 2). NGC 7552 hosts a starburst ring and may drive a ‘galactic superwind’ (Forbes et al. 1994a ). As a member of a galaxy group, it may be subject to tidal interactions. It seems possible that the magnetic field is still not strong enough to hold the large number of cosmic-ray electrons produced due to the high star formation activity. However, major distortions of our radio map by instrumental effects cannot be excluded. Further radio observations are required.
6 Conclusions
We observed a sample of 20 barred galaxies with the VLA and ATCA radio telescopes. Polarized radio emission was detected in 17 galaxies.
The flux densities in the radio continuum and the far-infrared spectral ranges are closely correlated in our sample. The average radio/far-infrared flux density ratio and equipartition strength of the total magnetic field are similar to those in non-barred galaxies. These properties are apparently connected to the star formation rate and possibly controlled by the density of cool gas. Radio surface brightness and present star formation activity are highest for galaxies with a high content of molecular gas and long bars where the velocity field is distorted over a large volume. The radio surface brightness is correlated with a newly introduced measure of bar strength proportional to the quadrupole moment of the gravitational potential. However, a few galaxies with strong bars are not radio bright, possibly because their molecular gas has been depleted in a star formation burst.
In barred galaxies with low or moderate radio surface brightness, the regular field (traced by the polarized radio emission) is strongest between the optical spiral arms (e.g. NGC 3359 and 4535) or has a diffuse distribution (e.g. NGC 3059 and 3953). In radio-bright galaxies, the pattern of the regular field can, however, be significantly different: the regular magnetic field may have a broad local maximum in the bar region upstream of the dust lanes, and the field lines are oriented at large angles with respect to the bar (NGC 1097, 1365, 1672 and 7552). We propose that shear in the velocity field around a large bar may enhance dynamo action and explain the observed strong regular fields. Strong bar forcing induces shear in the velocity field and enhancements in the regular magnetic field, and polarized emission traces such shear motions.
The southern galaxies NGC 986, 1559, 1672 and 7552 show strong polarization and are promising candidates for further studies with high resolution. Circumnuclear rings are already known to exist in NGC 1097, NGC 1365, NGC 2442 and NGC 7552 and should be searched for in NGC 986, 1559 and 1672.
Acknowledgements.
The authors would like to express special thanks to Dr. Elly Berkhuijsen for critical reading of the manuscript and many useful suggestions. Useful discussions with Drs. Peter Englmaier and David Moss are gratefully acknowledged. ME is grateful to the ATNF for providing support and facilities. His work in Australia was funded through grant No. Eh 154/1-1 from the Deutsche Forschungsgemeinschaft. VS acknowledges financial support from the RFBR/DFG programme no. 96-02-00094G and from the Royal Society. DDS acknowledges financial support from the RFBR programme no. 01-02-16158. JIH acknowledges the Australian Academy of Science for financial support under their Scientific Visits to Europe Program and the Alexander von Humboldt Foundation for its support. VS, JIH, AS and DS are grateful to the MPIfR for support and hospitality. This work was supported by the PPARC Grant PPA/G/S/1997/00284, the NATO Collaborative Linkage Grant PST.CLG 974737 and the University of Newcastle (Small Grants Panel). This work benefited from the use of NASA’s Astrophysics Data System Abstract Service.References
- (1) Abraham, R. G., & Merrifield, M. R. 2000, AJ, 120, 2835
- (2) Aguerri, J. A. L. 1999, A&A, 351, 43
- (3) Athanassoula E. 1992, MNRAS 259, 345
- (4) Beck, R. 2000, Phil. Trans. R. Soc. Lond. A, 358, 777
- (5) Beck, R. 2001, in The Astrophysics of Galactic Cosmic Rays, eds. R. Diehl, R. Kallenbach, E. Parizot, & R. von Steiger, Space Sci. Rev., 99, 243 (Dordrecht: Kluwer)
- (6) Beck, R., & Hoernes, P. 1996, Nature, 379, 47
- (7) Beck, R., Brandenburg, A., Moss, D., Shukurov, A., & Sokoloff, D. 1996, ARA&A, 34, 155
- (8) Beck, R., Ehle, M., Shoutenkov, V., Shukurov, A., & Sokoloff, D. 1999, Nature, 397, 324
- (9) Bicay, M. D., & Helou, G. 1990, ApJ, 362, 59
- (10) Block, D. L., Puerari, I., Knapen, J. H., et al. 2001, A&A, 375, 761
- (11) Buta, R., & Block, D. L. 2001, ApJ, 550, 243
- (12) Chapelon, S., Contini, T., & Davoust, E. 1999, A&A, 345, 81
- (13) Chiba, M., & Lesch, H. 1994, A&A, 284, 731
- (14) Combes, F., & Sanders, R. H. 1981, A&A, 96, 164
- (15) Condon, J. J. 1987, ApJS, 65, 485
- (16) Condon, J. J. 1992, ARA&A, 30, 575
- (17) Crocker, D. A., Baugus, P. D., Buta, R. 1996, ApJS, 105, 353
- (18) de Jong, T., Klein, U., Wielebinski, R., & Wunderlich, E. 1985, A&A, 147, L6
- (19) de Vaucouleurs, G., de Vaucouleurs, A., Corwin, H. G., et al. 1991, Third Reference Catalogue of Bright Galaxies (New York: Springer)
- (20) Elmegreen, B. G., & Elmegreen, D. M. 1985, ApJ, 288, 438
- (21) Evans, I. N., Koratkar, A. P., Storchi-Bergmann, T., et al. 1996, ApJS, 105, 93
- (22) Fitt, A. J., & Alexander, P. 1993, MNRAS, 261, 445
- (23) Forbes, D. A., Norris, R. P., Williger, G. M., & Smith, R. C. 1994a, AJ, 107, 984
- (24) Forbes, D. A., Kotilainen, J. K., & Moorwood, A. F. M. 1994b, ApJ, 433, L13
- (25) Frick, P., Beck, R., Berkhuijsen, E. M., & Patrickeyev, I. 2001, MNRAS, 327, 1145
- (26) Fullmer, L., & Lonsdale, C. 1989, Cataloged Galaxies and Quasars Observed in the IRAS Survey, Version 2, JPL D–1932 (Pasadena: JPL)
- (27) García-Barreto, J. A., Carrillo, R., Klein, U., & Dahlem, M. 1993, Rev. Mex. Astron. Astrofis., 25, 31
- (28) Gerin, M., Nakai, N., & Combes, F. 1988, A&A, 203, 44
- (29) Harnett, J. I., Ehle, M., Beck, R., Thierbach, M., Haynes, R.F. 2002, in prep. (Paper III)
- (30) Hoernes, P., Berkhuijsen, E. M., & Xu, C. 1998, A&A, 334, 57
- (31) Hummel, E. 1981, A&A, 93, 93
- (32) Hummel, E., & Beck, R. 1995, A&A, 303, 691
- (33) Hummel, E., van der Hulst, J. M., & Keel, W. C. 1987, A&A, 172, 32
- (34) Hummel, E., Davies, R. D., Wolstencroft, R. D., van der Hulst, J. M., & Pedlar, A. 1988, A&A, 199, 91
- (35) Jörsäter, S., & van Moorsel, G. A. 1995, AJ, 110, 2037
- (36) Kristen, H., Jörsäter, S., Lindblad, P. O., & Boksenberg, A. 1997, A&A, 328, 483
- (37) Laine, S., & Gottesman, S. T. 1998, MNRAS, 297, 1041
- (38) Laing, R. 1981, ApJ, 248, 87
- (39) Laing, R. 2002, MNRAS, 329, 417
- (40) Landau, L. D., & Lifshitz, E. M. 1976, The Classical Theory of Fields, §41 (Oxford: Pergamon)
- (41) Lindblad, P. O. 1999, A&A Rev, 9, 221
- (42) Ma, J., Peng, Q.-H., Chen, R., Ji, Z.-H., & Tu, C.-P. 1997, A&AS, 126, 503
- (43) Ma, J., Peng, Q.-H., & Gu, Q.-S. 1998, A&AS, 130, 449
- (44) Macri, L. M., Huchra, J. P., Stetson, P. B., et al. 1999, ApJ, 521, 155
- (45) Madore, B. F., Freedman, W. L., Silbermann, N., et al. 1998, Nature, 395, 47
- (46) Maoz, D., Barth, A. J., Sternberg, A., et al. 1996, AJ, 111, 2248
- (47) Martin, P. 1995, AJ, 109, 2428
- (48) Martin, P., & Friedli, D. 1997, A&A, 326, 449
- (49) Martinet, L., & Friedli, D. 1997, A&A, 323, 363
- (50) Mestel, L., & Subramanian, K. 1991, MNRAS, 248, 677
- (51) Mihos, J. C., & Bothun, G. D. 1997, ApJ, 481, 741
- (52) Möllenhoff, C., & Heidt, J. 2001, A&A, 368, 16
- (53) Moss, D., Korpi, M., Rautiainen, P., & Salo, H. 1998, A&A, 329, 895
- (54) Moss, D., Shukurov, A., Sokoloff, D., Beck, R., & Fletcher, A. 2001, A&A, 380, 55 (Paper II)
- (55) Neininger, N., Klein, U., Beck, R., & Wielebinski, R. 1991, Nature, 352, 781
- (56) Niklas, S. 1995, PhD Thesis, University of Bonn
- (57) Niklas, S. 1997, A&A, 322, 29
- (58) Niklas, S., & Beck, R. 1997, A&A, 320, 54
- (59) Niklas, S., Klein, U., & Wielebinski, R. 1997, A&A, 322, 19
- (60) Ondrechen, M. P. 1985, AJ, 90, 1474
- (61) Ondrechen, M. P., & van der Hulst, J. M. 1983, ApJ, 269, L47
- (62) Ondrechen, M. P., van der Hulst, J. M., & Hummel, E. 1989, ApJ, 342, 39
- (63) Quillen, A. C., Frogel, J. A., & González, R. A. 1994, ApJ, 437, 162
- (64) Reynaud, D., & Downes, D. 1998, A&A, 337, 671
- (65) Rohde, R., Beck, R., & Elstner, D. 1999, A&A, 350, 423
- (66) Roussel, H., Vigroux, L., Bosma, A., et al. 2001a, A&A, 369, 473
- (67) Roussel, H., Sauvage, M., Vigroux, L., et al. 2001b, A&A, 372, 406
- (68) Ryder, S. D., Koribalski, B., Staveley-Smith, L., et al. 2001, ApJ, 555, 232
- (69) Sandage, A., & Tammann, G. A. 1981, A Revised Shapley-Ames Catalog of Bright Galaxies (Washington: Carnegie Inst.)
- (70) Sandqvist, Aa., Jörsäter, S., & Lindblad, P. O. 1995, A&A, 295, 585
- (71) Soida, M., Urbanik, M., Beck, R., Wielebinski, R., & Balkowski, C. 2001, A&A, 378, 40
- (72) Sokoloff, D.D., Bykov, A.A., Shukurov, A., Berkhuijsen, E.M., Beck, R., & Poezd, A.D. 1998, MNRAS, 299, 189. Erratum: 1999, MNRAS, 303, 207
- (73) Storchi-Bergmann, T., Eracleous, M., Ruiz, M. T., Livio, M., Wilson, A. S., & Filippenko, A. V. 1997, ApJ, 489, 87
- (74) Strong, A. W., Moskalenko, I. V., & Reimer, O. 2000, ApJ, 537, 763
- (75) Tubbs, A. D. 1982, ApJ, 255, 458
- (76) Unger, S. W., Wolstencroft, R. D., Pedlar, A., et al. 1989, MNRAS, 236, 425
- (77) Whiteoak, J. B. 1970, Astrophys. Lett., 5, 29
- (78) Wilke, K., Möllenhoff, C., & Matthias, M. 2000, A&A, 361, 507
- (79) Young, J. S. 1993, in Star Formation, Galaxies and the Interstellar Medium, eds. J. Franco, F. Ferrini & G. Tenorio-Tagle (Cambridge: Univ. Press), 318
- (80) Young, J. S., Xie, S., Kenney, J. D. P., & Rice, W. L. 1989, ApJS, 70, 699
- (81) Zaritsky, D., Smith, R., Frenk, C., & White, S. D. M. 1997, ApJ, 478, 39