Intermediate Element Abundances in Galaxy Clusters
Abstract
-
•
We have determined the elemental abundances of Fe, Si, S, Ar, Ca, Ne, Mg, and Ni in the intra-cluster medium (ICM) using all the clusters in the archives of the ASCA X-ray telescope.
-
•
The calcium and argon abundances are very low and are not consistent with the abundances of the two well determined elements, silicon and sulfur.
-
•
The results do not show a clear preference for metal enrichment by solely Type Ia supernovae or Type II.
-
•
Trends in the abundances as a function of temperature (mass) suggest that different processes for enrichment and distribution of metals are important on different size scales.
Laboratory for High Energy Astrophysics, NASA/GSFC, Code 662, Greenbelt, MD 20771
Space Telescope Science Institute, Baltimore, MD, 21218
1. Introduction
The intra-cluster medium of galaxy clusters is the repository of all the metals produced by the stars in member galaxies. The determination of the elemental abundances in clusters provides an integrated measurement of metal production throughout the history of the cluster.
The measurement of elemental abundances in clusters is in many ways more straightforward than in other objects. Clusters are optically thin to X-rays and the spectra do not suffer from the complicating effects of radiative transport and dust common in photospheric measurements and galactic H II regions.
Compilations of X-ray cluster abundances exist (White 2000), but only for the iron-dominated overall metal abundance in clusters. Our compilation is the first large catalog of intermediate element abundances in clusters able to differentiate between several of the elements (Si, S, Ar, Ca), and the iron peak elements (Fe, Ni) observable by X-ray instruments. The results from this analysis are average elemental abundances from ensembles of clusters with similar properties. They provide a more general view in contrast with detailed spatially resolved abundance measurements for individual clusters from Chandra and XMM.
2. Data Sample and Reduction
We use the cluster sample of Horner et al. (ApJS submitted). All of the cluster observations () in the archives of the ASCA X-ray satellite were homogeneously reduced and fit to a MEKAL plasma model with galactic absorption to obtain the cluster temperature and metal abundance.
Individual cluster observations with ASCA do not have enough signal to noise to allow a determination of the intermediate cluster abundances. In order to improve the signal and determine the individual element abundances, we stacked together single cluster observations with similar properties. The individual cluster observations were divided into 22 bins based on their temperature and iron abundance: There are eleven 1 keV wide bins from 0 to 11 keV, and each bin is equally split into a low Fe abundance group and a high Fe abundance group. There are 218 clusters in our sample. We exclude clusters with more than 40 thousand counts in order not to unduly bias the results in a single bin. All of the clusters in a bin (typically 8 – 20) are jointly refit to a single VMEKAL model with the same set of abundances for all the clusters in each bin. The solar abundances of the elements we use are given in Grevesse & Sauval (1998). The results from the high Fe bin and the low Fe bin are combined to give a single data point for each 1 keV temperature bin. We fit for Fe, S, Si, Ca, Ar, and Ni separately, and for Ne and Mg tied together.
In order to assess the effects that a possible systematic error in the ASCA calibration might have on our abundance determinations, we carefully examined the residuals from a very long observation of the quasar 3c273. 3c273 and sources in its class are known for featureless powerlaw spectra, allowing us to assume that any features left after fitting can be attributed to calibration errors in the response matrix. We reduced the ASCA 3c273 data the same way the cluster data was reduced, and fit the quasar with an absorbed power law model. We then took the residuals from the fit and applied them to the cluster data in order to correct for any response matrix errors, a sort of spectral flat-fielding. We then refit the clusters with the corrected spectra. The resulting abundances are identical to the original abundances within the statistical errors, showing that response matrix problems cannot be the source of significant systematic errors in the abundance determinations.
3. Results
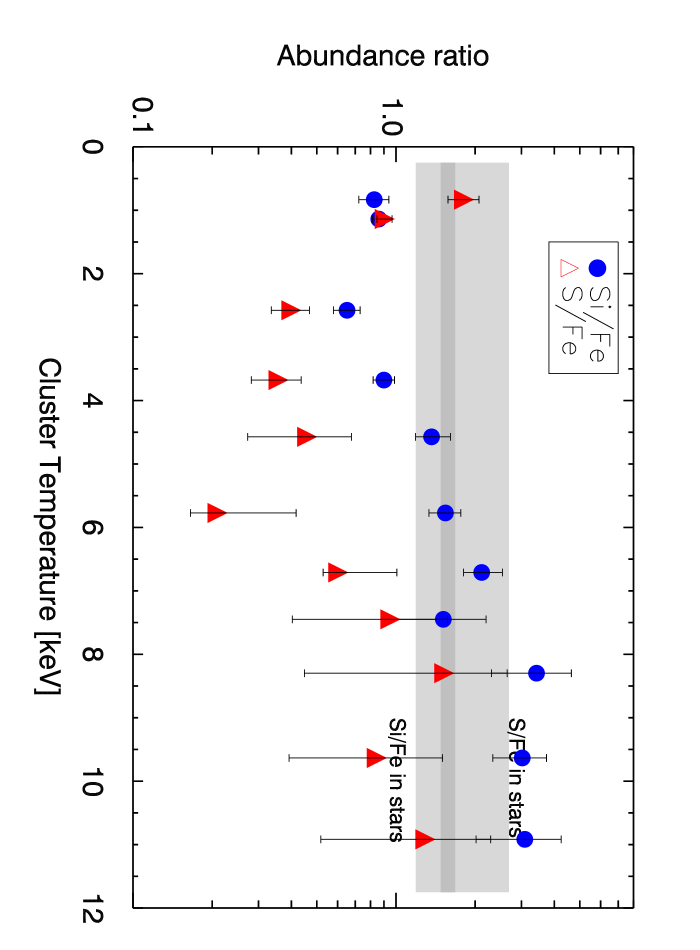
In Figure 1 we compare our silicon and sulfur cluster X-ray results to optical data from stars given in Timmes, Woosley, & Weaver (1995). Our main results are given graphically in Figure 2.

The most striking result is that the several elements do not track each other consistently and have very different overall abundances. Figure 2 shows that calcium and argon are not detected, and have statistically significant upper limits, while silicon and sulfur range from about 0.1 to 0.8 solar. The abundances for neon and magnesium are not considered well determined because the main K-shell spectral lines for these elements fall in the middle of the numerous lines from the L-shell of iron, confusing the analysis. Also very perplexing is the fact that silicon rises with increasing temperature, while sulfur falls. All of these elements belong to the elemental family formed by adding particles to oxygen, and are expected to have similar abundances as a result of their similar formation processes.
We have attempted to determine the supernovae (SN) fraction capable of producing the observed metals in clusters by comparing the Si/Fe and S/Fe ratios from theoretical yields for Type Ia and Type II SN given by the THN-40 and W7 models to our observed data. Figure 3
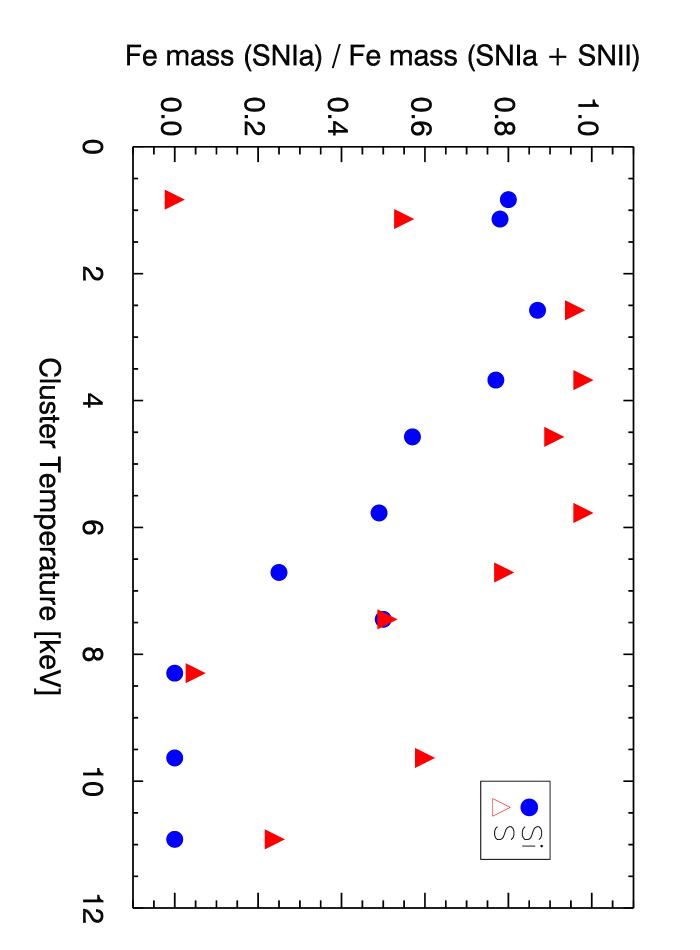
shows the SN ratio derived from our data for silicon and sulfur and the theoretical yields. Even at the same mass scale, the Type I to Type II ratio determined by the elemental ratios depends on the choice of elements used. This suggests that the supernovae models need refinement, that we need to consider mechanisms for distributing the metals within the ICM, or both. However, it can be said that low mass clusters have a higher proportion of their iron from Type Ia SN, and that high mass clusters have most of their iron from Type IIs. This supports the hypothesis that low mass groups do not have a large enough gravitational potential to hold onto the energetic products of Type II SN.
Thanks go to Mike Loewenstein for useful discussions and access to his collection of SN yields.
References
- Gibson, Loewenstein, & Mushotzky(1997) Gibson, B. K., Loewenstein, M., & Mushotzky, R. F. 1997, MNRAS, 290, 623
- Grevesse & Sauval(1998) Grevesse, N. & Sauval, A. J. 1998, Space Science Reviews, 85, 161
- Horner et al.(ApJS, submitted) Horner, D. J., Baumgartner, W. H., Gendreau, K. C., & Mushotzky, R. F. 2002, ApJS, submitted
- Timmes, Woosley, & Weaver(1995) Timmes, F. X., Woosley, S. E., & Weaver, T. A. 1995, ApJS, 98, 617
- White(2000) White, D. A. 2000, MNRAS, 312, 663