Detecting the Baryons in Matter Power Spectra
Abstract
We examine power spectra from the Abell/ACO rich cluster survey and the 2dF Galaxy Redshift Survey (2dFGRS) for observational evidence of features produced by the baryons. A non-negligible baryon fraction produces relatively sharp oscillatory features at specific wavenumbers in the matter power spectrum. However, the mere existence of baryons will also produce a global suppression of the power spectrum. We look for both of these features using the false discovery rate (FDR) statistic. We show that the window effects on the Abell/ACO power spectrum are minimal, which has allowed for the discovery of discrete oscillatory features in the power spectrum. On the other hand, there are no statistically significant oscillatory features in the 2dFGRS power spectrum, which is expected from the survey’s broad window function. After accounting for window effects we apply a scale-independent bias to the 2dFGRS power spectrum, and . We find that the overall shapes of the Abell/ACO and the biased 2dFGRS power spectra are entirely consistent over the range Mpc-1. We examine the range of and baryon fraction, for which these surveys could detect significant suppression in power. The reported baryon fractions for both the Abell/ACO and 2dFGRS surveys are high enough to cause a detectable suppression in power (after accounting for errors, windows and -space sampling). Using the same technique, we also examine, given the best fit baryon density obtained from BBN, whether it is possible to detect additional suppression due to dark matter-baryon interaction. We find that the limit on dark matter cross section/mass derived from these surveys are the same as those ruled out in a recent study by Chen, Hannestad and Scherrer.
1 Introduction
During its first years, the Universe was filled with a fully ionized plasma with a tight coupling between the photons and baryons via Thomson scattering. A direct consequence of this coupling is the acoustic oscillation of both the primordial temperature and density fluctuations (within the horizon) caused by the trade–off between gravitational collapse and photon pressure. The relics of these acoustic oscillations are predicted to be visible as alternating peaks and valleys in the CMB temperature power spectrum. The relative amplitudes and locations of the features provide powerful constraints on the cosmological parameters (e.g. , etc). The BOOMERANG, MAXIMA, and DASI experiments announced the first high confidence detection of these acoustic oscillations in the temperature power spectrum of the Cosmic Microwave Background (CMB) radiation (Miller et al. 1999; Melchiorri et al. 2000; Balbi et al. 2000; Lee et al. 2001; Netterfield et al. 2002; Halverson et al. 2002; de Bernardis et al. 2002; Miller et al. 2002a).
Like the CMB experiments mentioned above, we have also seen the recent emergence of large and/or deep extragalactic datasets to directly measure the 3-dimensional luminous matter power spectrum, . Specifically, the PSCz galaxy survey (Saunders et al. 2000), the Abell/ACO cluster survey (Miller et al. 2002b), and the 2dF Galaxy Redshift Survey (Colless et al. 2001) have all released newly measured power spectra (Hamilton, Tegmark, and Padmanabhan, 2000; Hamilton and Tegmark 2002; Miller & Batuski 2001; Miller, Nichol & Batuski 2001a,b; Percival et al. 2001; Tegmark, Hamilton & Xu 2002). These surveys are beginning to allow us to search for oscillatory features in the matter power spectrum (frozen into the matter distribution from acoustic oscillations on the largest-scales). Using some of these large (in volume and/or number) surveys, Miller et al. (2001a) found statistically significant features (dips in power) at and Mpc-1 in the . While much less obvious, features (at similar wavenumbers) were also qualitatively observed in the recently determined 2dFGRS (Percival et al. 2001) and the 2dF QSO power spectrum (Hoyle et al. 2002). The existence of such oscillatory features in the matter power spectrum permits one only to say whether they are consistent with baryonic features, since features could also be due to other reasons (e.g. features in the primordial ).
Besides the features resulting from acoustic oscillations, the presence of a non-negligible baryon fraction in the Universe has another observational consequence on the power spectrum: the overall power below the sound horizon is suppressed over a large range in (see Eisenstein and Hu 1998–hereafter EH98). The suppression occurs in both the cold dark matter and baryonic transfer functions. As discussed in EH98, the main effect of the baryons is the suppression of the growth rates between the equality and drag epochs. Therefore, the effect of baryons in the matter power spectrum can be detected via this suppression over many -modes, as opposed to looking for the sharp features which result from the acoustic oscillations.
However, there are some “degeneracies” in the suppression. In addition to the baryonic damping discussed above, dark matter (hereafter–DM) scattering off the baryons will also suppress the power spectrum on scales smaller than the sound horizon (Chen, Hannestad, and Scherrer 2002), and hot dark matter will also have the effect of suppressing power on small scales. Eisenstein and Hu (1999) note that the suppression of the transfer function due to baryons will dominate over neutrinos. Others have begun to address the effects of hot dark matter (see Wang, Tegmark, and Zaldariagga 2002 and Elgaroy et al. 2002), and so we focus here on suppression effects related to the baryons: baryon suppression and DM-baryon scattering.
In Section 2 we compare the 2dFGRS power spectrum to that of the Abell/ACO cluster spectrum, taking into account effects from their respective window functions. By controlling the False Discovery Rate (Miller et al. 2001a,c), we look for any statistically significant oscillatory features in the 2dFGRS power spectrum. In Section 3, we then examine whether either of these surveys could have detected the baryons through suppression. In Section 4, we examine the effect of DM–baryonic scattering interactions on the . We then summarize and discuss our findings in Sections 5 and 6.
2 The 2dFGRS and Abell/ACO
2.1 The Surveys and their Spectra
In this work, we have chosen to examine two of the largest luiminous-mass samples available today: the Abell/ACO cluster catalog and the 2dF Galaxy Redshift Survey catalog. The cluster catalog covers 2 steradian (the entire sky excluding ) and has over 600 clusters to . This sample is presented in Miller et al. (2002b) and the power spectrum can be found in Miller & Batuski (2001). The 2dFGRS covers a much smaller portion of the sky (a southern strip and a northern strip ). However, the 2dFGRS power spectrum probes to a deeper redshift than the Abell/ACO () and has galaxy redshifts. The sample selection and definition for the 2dFGRS can be found in Colless et al. (2001) and the power spectrum in Percival et al. (2001). We chose these samples for their size (in volume and in number) and also because their were calculated using the Feldman, Kaiser, and Peacock (1994) prescription. Also, as we show below, after accounting for the window effects on the 2dFGRS and relative bias, the shapes of the two power spectra are indistinguishable.
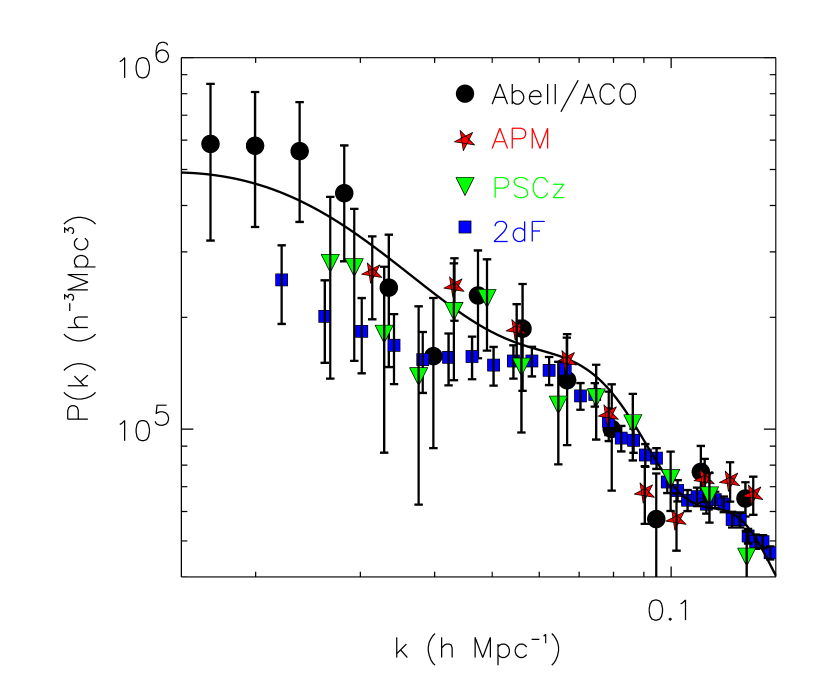
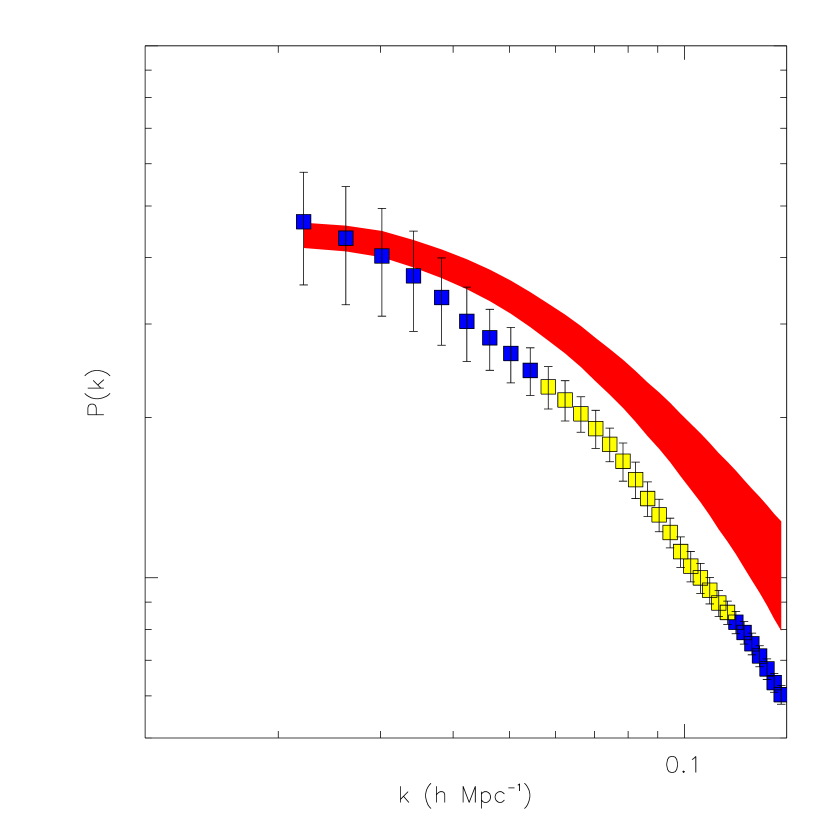
In Figure 1, we plot the of the three surveys used in Miller et al. (2001a), along with the 2dFGRS measurement of Percival et al. (2001). In this plot, all of the have been normalized to the Abell/ACO amplitude over the range Mpc-1. The features (dips) seen in the Abell/ACO, PSCz and APM measurements are not nearly as evident in the 2dFGRS data. In Figure 1, one should notice that for Mpc-1 the shapes of all four spectra are nearly identical. We discuss the difference at larger scales (Mpc-1) below.
2.2 Detecting Features and Deviations
Throughout this work, we will be performing statistical tests to differentiate between some given null hypothesis (e.g. a spectrum without baryonic oscillations) and the data (real or modelled). Instead of looking at the overall shapes of two power spectra (using a test, for example), we approach this problem from a multiple-hypothesis testing point-of-view. We choose this type of statistical technique because we will want to detect either (a) discrete features in the spectrum for which a test provides very little information (like their location), or (b) the global suppression of the , and not simply strong features caused by acoustic oscillations. For instance, a multi-hypothesis testing approach allows us to demand that all measurements for some are rejected, and not just the bumps and dips.
Our choice of testing procedure will be via controlling the False Discovery Rate or FDR (see Miller et al. 2001a and Benjamini & Hochberg 1995). FDR is a simple procedure which allows one to control the number of mistaken rejections (or false discoveries) when performing multiple hypothesis tests. One pre-specifies the acceptable fraction of false discoveries as , then the FDR procedure defines an appropriate significance threshold so that an error rate is obtained for the data in question. For example, if and we found in our tests that six of the data points are rejected from the null hypothesis (in this case, the null hypothesis is these points being drawn from a smooth, featureless power spectrum), then on average, only two of these points are erroneous rejections of the null hypothesis. A key advantage of the FDR procedure is that it works with highly correlated data, such as the Percival et al. 2dFGRS . While we do not have the 2dFGRS covariance matrix, we do not need it to apply the FDR procedure (at the cost of a slightly more conservative statistical test).
The FDR technique has since be applied in a variety of astrophysical scenarios. For instance, Miller et al. (2001c) applied the FDR technique to source detection algorithms in astronomical images. Hopkins et al. (2002) then extended on this work by combining source pixels into extended sources and studying the final error rates. Recently, Tago et al. (2002) used FDR to search for oscillatory features in the large-scale structure two-point correlation function on scales Mpc.
Operationally, the FDR technique requires that we first compute the –value for each result obtained in the tests. 111The –value is the probability that a random sampling would lead to a data value with an equal or higher deviation from the the null hypothesis. Herein we have used a smooth CDM model based on the Percival et al. (2001) best-fit cosmological parameters, but with the baryon oscillations removed (EH98). We rank, in increasing size, the -values of each data and plot these as points , where is the rank of the point. We then draw a line of slope and zero intercept, where is the number of points and accommodates for correlated data. The numerator, is the user specified false discovery rate. The first crossing of this line with a –value (moving from larger to smaller –values) defines the significance threshold , below which all points are rejected based on our null hypothesis. On average, only of these rejected points will be mistakenly identified as significant (or rejected by the test) as a result of random fluctuations of the null hypothesis.
2.3 Oscillatory Features and Window Effects in the 2dFGRS
In this section, we apply the FDR tecnhique to determine whether the measured values of the 2dFGRS are consistent with a smooth, featureless, underlying power spectrum. Miller et al. (2001a), performed such an analysis on the Abell/ACO, PSCz, and APM cluster data (shown in Figure 1). They found features at and . In fact, we do not find any statistically significant features in the 2dFGRS , even though qualitatively one sees dips and valleys in the from Percival et al. (2001) (see Figure 1).
Next, we examine what effect the windows of these surveys have on their measured . We ask whether a feature as strong as that seen in the Abell/ACO data (and also seen in the PSCz from Hamilton and Tegmark 2002) could have been detected through the window of the 2dFGRS. As we shall show below, the effect of window “smearing” is significant for the 2dFGRS.
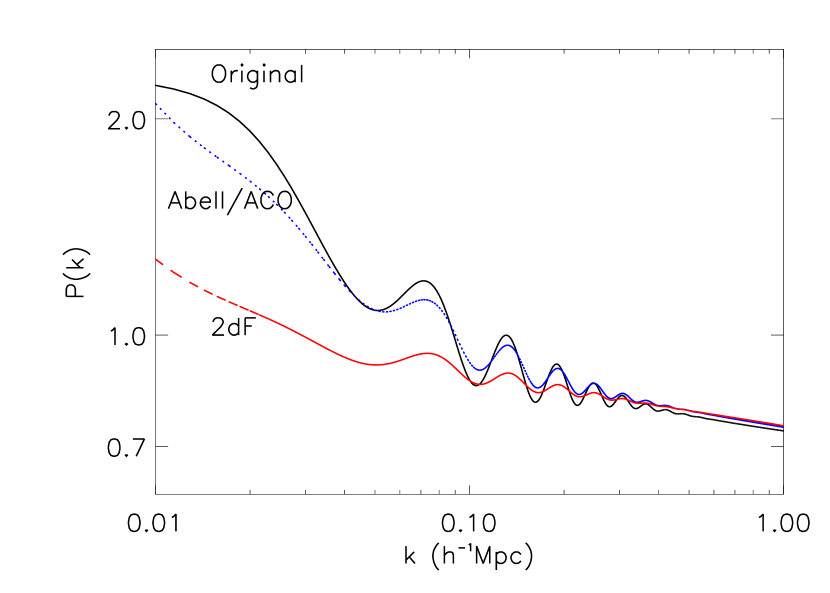
In Figure 2, we show the effects of the Abell/ACO window function compared to the 2dFGRS window function. In this Figure, we use the cosmological model parameters from Miller et al. (2001a,b), which have oscillatory features resulting from a non-zero baryon fraction (, , and ) To be consistent with Percival et al. (2001), we divide the baryonic power spectrum by a zero-baryon model ( and ) which has the effect of visually enhancing any features. We then convolve this model with the Abell/ACO window (from Miller & Batuski 2001) and also the 2dFGRS window (given in Percival et al. 2001). The difference between the height of the unconvolved peak and the Abell/ACO convolved peak at Mpc-1 is . The difference in the locations of the maximum of the unconvolved and Abell/ACO convolved peaks is . However, the 2dFGRS convolution reduces the height of the peak by and shifts the peak towards smaller by . The effect from the 2dFGRS window gets smaller as we move towards larger .
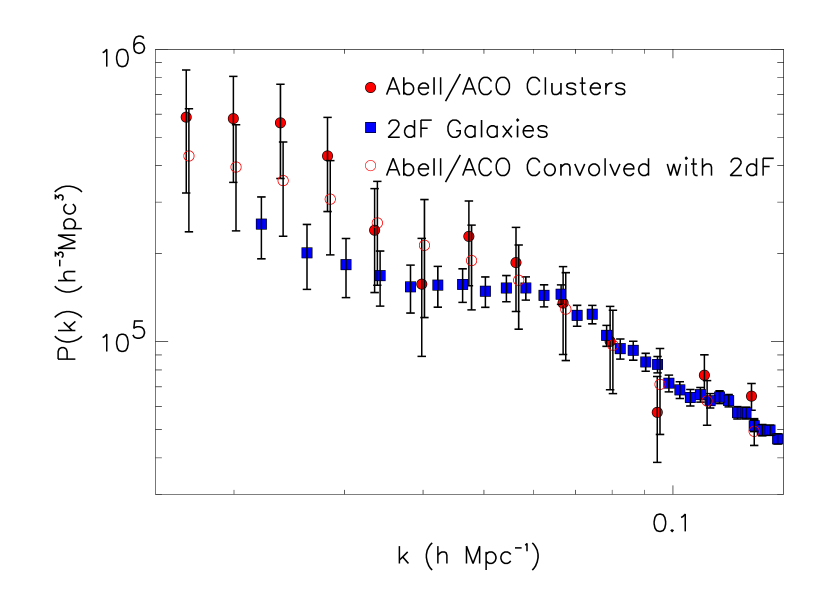
Figure 2 shows that while the Abell/ACO window has minimal effect (i.e. ) on the amplitudes of the features, the 2dFGRS window will smear the features significantly. We then can convolve the Abell/ACO power spectrum of Miller & Batuski (2001) with the window of the 2dFGRS (under the approximation that the Abell/ACO spectrum is entirely unaffected by the its window). In Figure 3, we see that the features in the Abell/ACO are entirely washed out. If we now perform the same statistical search for features in the Abell/ACO , we do not find any features.
An advantage of surveys like the PSCz and Abell/ACO are their approximate full-sky coverage, resulting in a well determined and highly peaked window function. While 2dFGRS has a large number of points (galaxies), it also has a very broad window (from its irregular shaped volume). Therefore, while the 2dFGRS will have smaller error bars, the oddly shaped survey volume of the 2dFGRS makes any statistical search for features difficult, if not impossible.
When comparing the convolved Abell/ACO and the 2dFGRS galaxy power spectrum (shifted to match the amplitude of the clusters), we see that the overall shapes of the two are consistent (within their errors) on scales Mpc (Mpc-1). A Kolmogorov-Smirnoff test finds no significant difference between these two power spectra. Note that neither the 2dFGRS nor the Abell/ACO power spectra appear to turn-over at large scales. As discussed by Miller & Batuski (2001), this is especially important for the Abell/ACO survey since the window function has little effect on the power spectrum at near gigaparsec scales (). A possible cause of excess power on large-scales is from leakage of power on smaller scales due to the broadness of the window function. However, Miller & Batuski have shown that such leakage should be minimal for the Abell/ACO survey for . The fact that we are not seeing a turnover in any of the new large-surveys could imply an ever decreasing (so long as the baryonic fraction of matter is not large and the dark matter is cold).
A remarkable aspect of Figure 3 is the overall success of a simple linear biasing model in re-normalizing the amplitudes of these power spectra over nearly a decade of scale. A similar result was already found for the Abell/ACO, PSCz, and APM surveys in Miller et al. (2001a). This scale–independent biasing model, over the range in discussed herein, has already been predicted in recent numerical simulations (Narayanan, Berlind & Weinberg 2000). We have applied techniques to calculate the amplitude shift (e.g. a minimization of the data with identical -values as well as using model fits to the data and re–normalizing them to the Abell/ACO data), but in all cases we obtain identical results: the relative bias (where ) between the Abell/ACO cluster sample and the 2dF galaxy power spectra is over the range Mpc-1.
2.4 Summary of the Shapes
In this section, we showed that the shapes of the 2dFGRS and Abell/ACO are indistinguishable after accounting for relative bias and window effects. We also showed that the features seen in the 2dFGRS are not significant.
In their likelihood analyses, Percival et al. (2001) find a non-negligible baryon fraction in two localized regions of parameter space: ( and . These two regions are likely a result of degeneracy in the models (see Percival et al. 2001). The high baryon fit has very strong features, while the low baryon model is a better overall fit to the 2dFGRS power spectrum, but still has features. However, since we find no observed features in the 2dFGRS power spectrum, we examine the effects of baryon suppression. Specifically, we ask at what baryon fraction will the Abell/ACO and 2dFGRS surveys be able to differentiate between a zero-baryon model and a baryon model (with the same ).
3 Suppression via the Baryons
In this section, we present a method for detecting the baryons based on comparing a non-baryonic model to the data. On the largest scales (and all other parameters being equal), a baryonic and non-baryonic power spectrum will have the same shape and amplitude for a given dataset. One could then normalize the model (with no baryons) to the data on these very large scales, and search for the baryonic suppression on smaller scales (e.g ). However, the current measurements of power on the largest scales are not precise enough to warrant such an analysis (the fractional errors on the measured power spectra for the Abell/ACO and 2dFGRS surveys are on the largest scales). So instead of the measured for these surveys, we use model power spectra (while still using the errors on the measured ) and vary the baryon fraction to conjecture on the detectability of baryon suppression.
A possible source of concern in our analysis is non-linear evolutionary effects which are known to erase the baryonic oscillations. However, these non-linear effects are not expected to be significant for Mpc-1 (Mieksin, White, and Peacock 1999). Also, Percival et al. (2001) used fully evolved N-body simulations (see their Figure 4) to show that non-linear effects do not strongly alter the recovered linear power spectrum for Mpc-1. Therefore, throughout the rest of this work, we only use power spectrum measurements for Mpc-1.
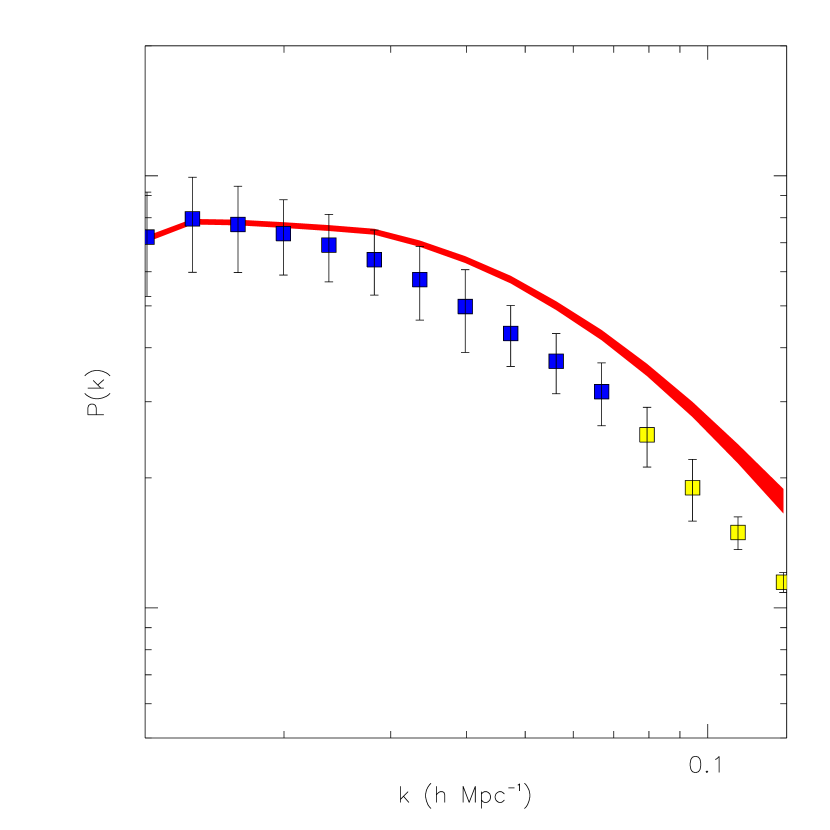
We mimic the measurements using model at the same -values and fractional errors as given by Miller and Batuski (2001) and Percival et al. (2001). We also convolve the model with the window functions of each experiment. We normalize the nonzero model to the zero baryon model using the power calculated at three smallest -values of the two different surveys. This has some consequences that we discuss below. We allow for uncertainty in this normalization by calculating the the error-weighted root mean square difference between the two models over the -values used in the normalization. Ideally, the zero baryon and non-zero baryon models should have zero difference. But when an RMS is non-zero, we consider this to be an uncertainty and apply it over the full range of power in the null hypothesis. This turns the null hypothesis into a band of power. We show two examples in Figure 4. On the left, we show the Abell/ACO -values, errors and window, while on the right we use the 2dFGRS. Notice that the 2dF does not probe to large enough scales (small enough ) to get the correct normalization, whereas the Abell/ACO data does.
The null hypothesis for our testing procedure is the model containing no baryons. We quantify differences from the null using the False Discovery Rate procedure described above. Instead of looking at the overall shapes of two power spectra, we approach this problem from a multiple-hypothesis testing point-of-view. We choose this statistical technique because we want to detect the global suppression of the and not simply the features caused by acoustic oscillations. The FDR technique allows us to demand that all measurements above some specified are rejected, and not just the bumps and dips. Since the Abell/ACO and 2dFGRS surveys sample the at different intervals, we must account for the sampling differences. Specifically, we require that at least seven adjacent 2dFGRS data points differ from the null hypothesis, before we identify a statistical detection of the baryon suppression. For the more sparsely sampled Abell/ACO data, we require at least four adjacent data points to differ from the null. We have chosen these requirements to meet two criteria: (1) Enough points must be rejected so that we are detecting more than just the bumps and wiggles (baryonic acoustic features span very small ranges of –typically one data point in the Abell/ACO and two in the 2dFGRS); (2) If of the total dataset is suppressed, then we have a positive detection. We note that our results are the same when we make minor changes to these requirements. We use to control false discoveries.
We calculate the probability (for each data point) that the nonzero power is from the zero baryon power spectrum. We use a two population test statistic:
| (1) |
where and are the values taken from the fitting formula of EH98 after inputting and for a Hubble constant of km s-1 Mpc-1 and a primordial spectral index, . has no noticable effect on the shape of the and the Hubble constant and the spectral index will affect the shapes of the baryon and non-baryon power spectra in the same way. Therefore, none of these affect our test statistic. All of our models are strictly for Cold Dark Matter universes. The errors on are the fractional errors from the original experiments and the error on is from the RMS after normalizing the nonzero power spectrum to the zero baryon power spectrum. We then apply the FDR method as described above. We use the correlated correction (see Miller et al. 2001c) to account for the fact that the 2dFGRS points are correlated.
To recap, our algorithm is as follows: (1) create model power spectra with and without baryons over a range of and ; (2) convolve these models with the appropriate window function; (3) normalize the baryonic to the non-baryonic for the three smallest -values in the appropriate survey; (4) apply an error-band to the non-baryonic using the RMS difference to the baryonic ; (5) use FDR to find significant differences between the non-baryonic and baryonic convolved , using the wavenumbers and errors of the appropriate survey.
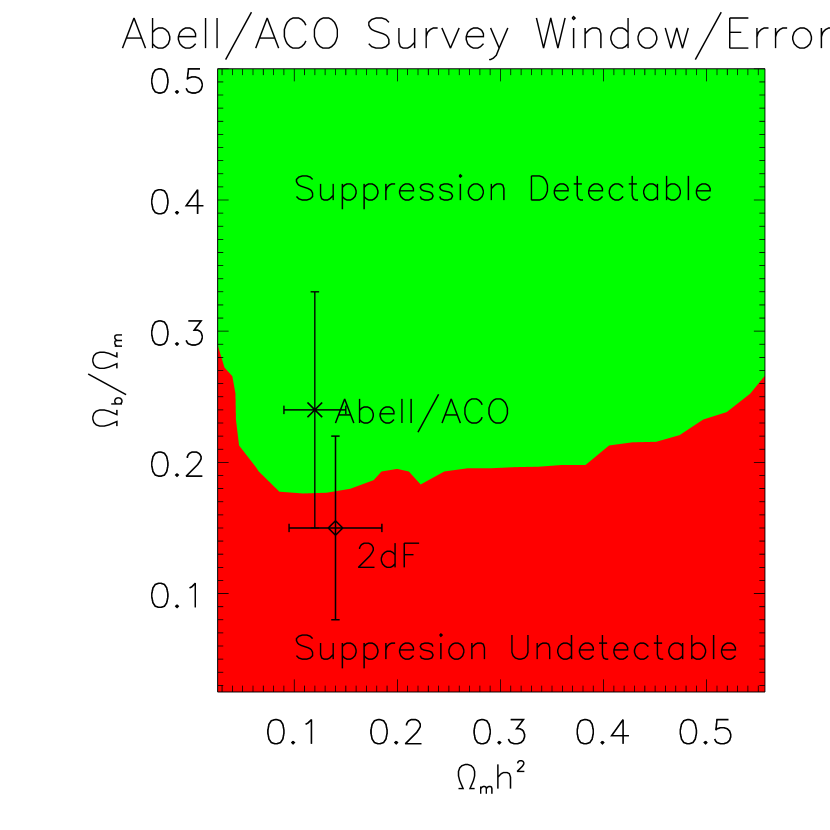
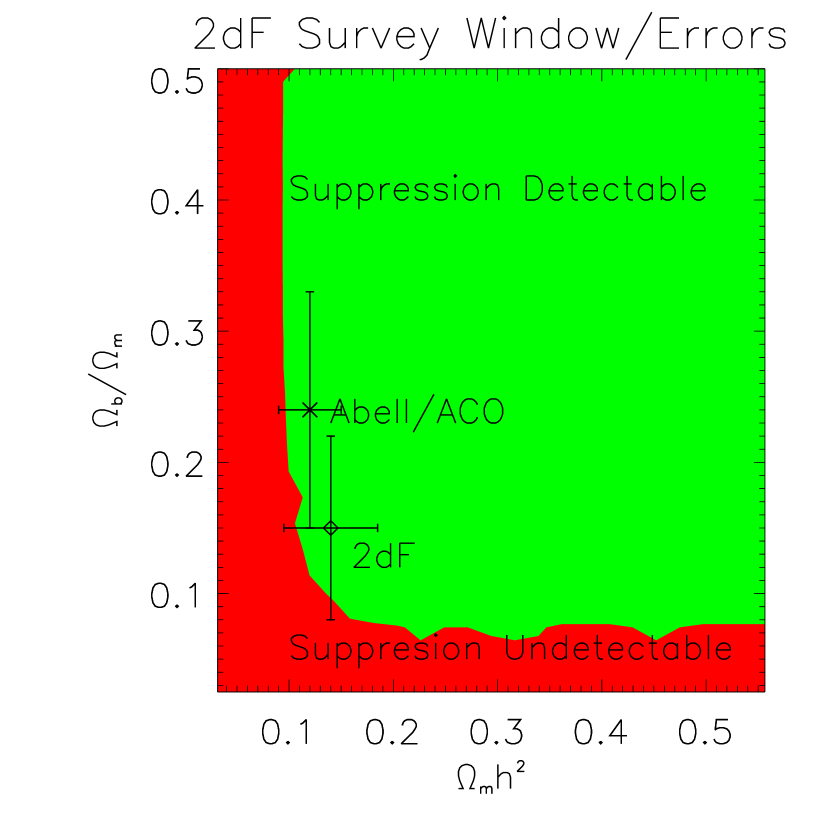
In Figure 5 we present our results. These plots separate two regions in parameter space: one where the baryon suppression could have been detected (green), the other where the suppression could not be detected (red). The left side edge of non-detectability in the 2dFGRS is directly tied to the availability of low measurements. As gets smaller, the sound horizon gets larger. This means that for small , the scale at which the non-baryonic and baryonic power spectra become identical gets large. Therefore, one would need measurements of the on these large scales to accurately normalize the baryon spectrum to the non-baryon spectrum. If a survey cannot probe to these large scales, the normalization occurs over a range in -space where the two power spectra are not identical, resulting in large uncertainty and the error band around the null hypothesis gets very wide.
The lower limits on the baryon fraction are a direct consequence of the error bars on the measurements, i.e. the smaller the error, the lower the baryon fraction one can detect through suppression. In this sense, the Abell/ACO and 2dFGRS are complementary. An Abell/ACO type survey (all-sky but few data) probes to lower while the 2dFGRS (small sky coverage but many data) probes to lower baryon fractions.
In both surveys, the reported baryon fractions (by Miller et al. and by Percival et al.) are within their respective ranges of detectability. The lower 2dFGRS baryon fraction (compared to the Abell/ACO) would be undetectable in the Abell/ACO power spectrum due to its larger errors and sparse sampling. We note that both surveys find results for and that are just in the range of detectability (). Since the suppression in power from the baryons occurs over a large range in , it is likely that these surveys are detecting baryon effects through suppression, rather than through any discrete features.
4 Suppression via DM Scattering
Besides baryons, interaction between dark matter and baryons could also suppress the power spectrum of the fluctuation. Although for the WIMPs such effect is too small to be observable (Chen et al. 2001), a number of dark matter candidates, especially some associated with the strongly self-interacting dark matter particles (Spergel & Steinhardt 2000), could have such interaction with baryons (e.g. Starkman et al 1990, Wandelt et al. 2000 and references therein). If such interaction indeed exists, it would have profound implication for the formation and evolution of structure, and its detection could provide important clues to the nature of the dark matter.
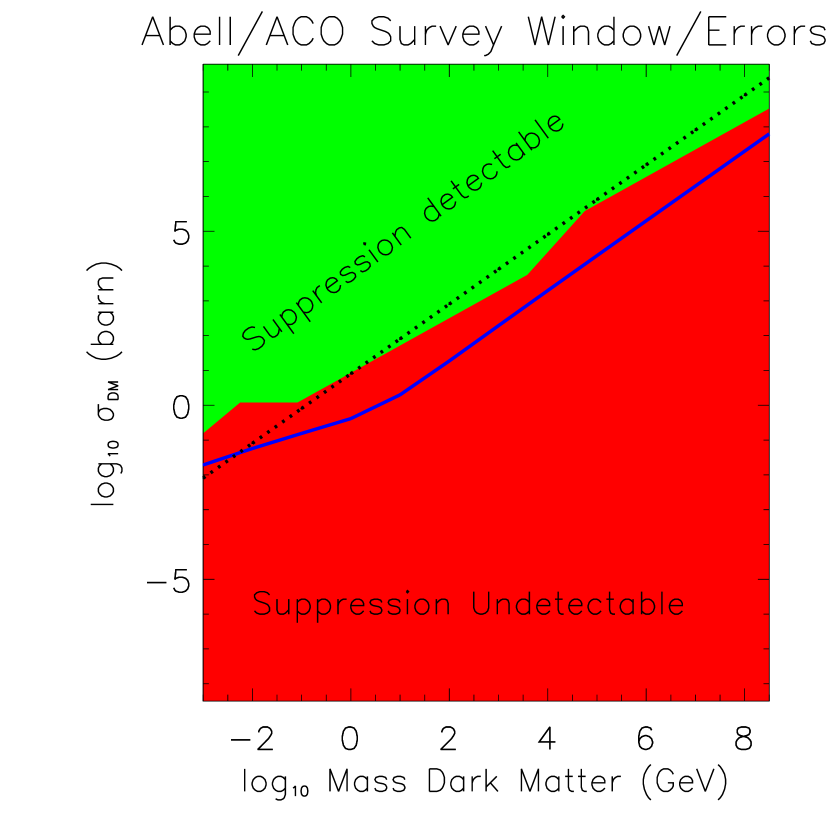
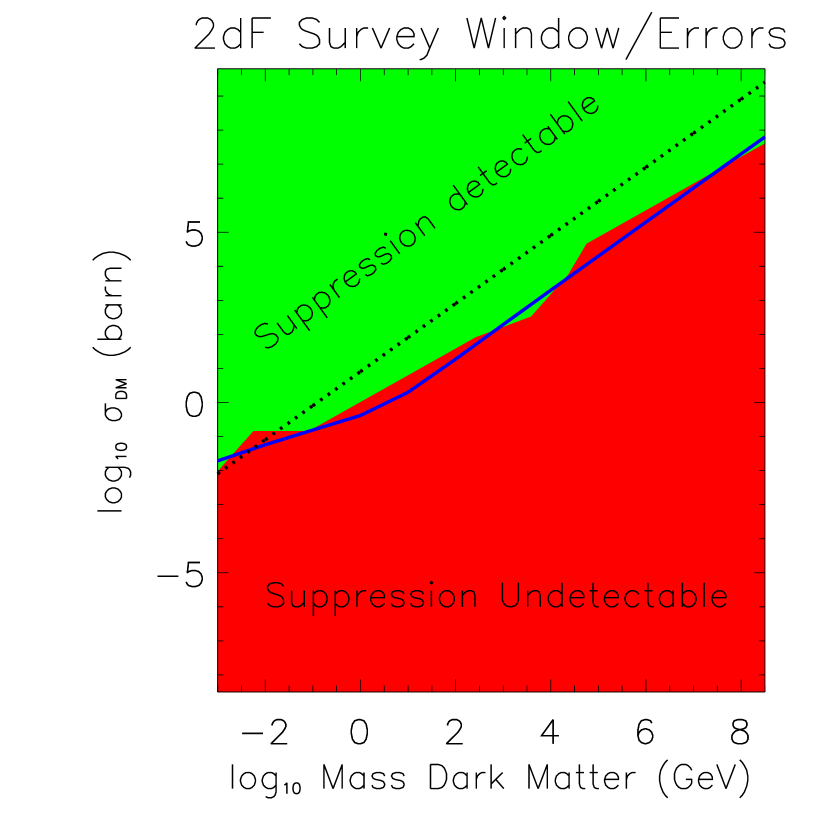
The matter power spectrum is suppressed by such interaction, because momentum is transfered from the baryon-photon fluid to the dark matter in baryon-dark matter collisions (Chen et al 2002). The magnitude of this suppression depends on both the baryon-dark matter interaction cross section and the dark matter mass. We use the same technique as described above to look for such suppression, and determine the range of cross section and mass for which such suppression could be detected from the Abell/ACO and 2dFGRS data. In this exercise, we fix and .
Our result is plotted in Fig. 6. The solid blue curve in the plot is the limit obtained from combing current CMB and large scale structure data by Chen et al 2002. Above this curve, the DM mass and cross-section of the DM-baryon interaction is ruled out at the 95% confidence level. Using the techniques described in this paper, we find that the dark matter-baryon interaction is detectable with these two survey data sets only if they are above or very close to this limit. The detectable range for the 2dFGRS survey runs parallel to the Chen et al limit, while the Abell/ACO data set is seen to be slightly weaker for this purpose. This result is not surprising, since the more sensitive large scale structure constraint in the Chen et al paper is also based on the same 2dFGRS data set. Despite different techniques, on this log-log plot the difference appears almost indistinguishable. However, Spergel and Steinhardt (2000) suggest a much stronger DM self-interaction (the dotted line if Figure 6). Thus, if the DM-baryon interaction is as strong as DM self-interactions, we should be able to detect this suppression with the current 2dFGRS data.
5 Summary
We have examined two large surveys for the effects of baryons on the luminous matter power spectrum. We have shown that the window effects on the measured are minimal (%) for the Abell/ACO survey, while they are significant in the 2dFGRS. The 2dFGRS window not only smoothes out any features, but it also moves those features to higher . We have shown that the features detected in the Abell/ACO by Miller, Nichol, and Batuski (2001), are entirely erased by the 2dFGRS window. There are features in the 2dFGRS power spectrum visible to the eye, but they are not significant after a thorough statistical analysis.
After convolving the Abell/ACO power spectrum with the 2dFGRS window, we find that the shapes of the two power spectra are entirely consistent from Mpc-1 to Mpc-1. Neither survey shows evidence for a turnover in power toward a scale-invariant spectrum.
Since the presence of baryons suppresses the power spectrum on scales smaller than the sound horizon, we examined whether either of these surveys could have detected this suppression. We utilized a multiple hypothesis testing approach (by controlling the False Discovery Rate) as opposed to an omnibus test (e.g. a test). This allowed us to demand that the detection of the overall suppression, and not simply the baryonic features. Since neither the 2dFGRS nor the Abell/ACO have accurate power measurements on the largest scales (where there is no baryonic suppression), we consider model power spectra which have the same attributes (windows, sampling, errors, etc) of the two surveys. We find that the Abell/ACO survey and the 2dFGRS survey are complementary in that the former can probe to smaller due to its volume and window, while the latter can probe to smaller due to its better sampling and smaller errors.
Recently, Chen et al. (2002) had shown that scattering interactions between dark matter and the baryons will also cause significant suppression in the matter power spectrum. We fix and and examine a range of dark matter masses and DM-baryon cross sections to see whether either of these surveys could detect this suppression. We find that such interaction is detectable if the interaction strength is above or close to the current limit put by the CMB and large scale structure data. However, we note that if the interaction strength between the dark matter and baryon is as strong as the Spergel-Steinhardt dark matter self-interaction as speculated in Wandelt et al. (2000), it should already be detectable.
6 Discussion
Most efforts in this area of research have focused on finding the bumps and dips in the power spectrum resulting from acoustic oscillations ( Eisentstein et al. 1998; Miller et al, 2001a,b; Meiksin, White, and Peacock 1999). However, even when such features are found (e.g. Miller et al. 2001a), they may not be the direct result of the baryons (although statistical tests like FDR can rule out their being caused by random fluctuations of noise). At best, features in the power spectrum can said to be consistent with those expected from acoustic oscillations.
In this paper, we take a new approach: we study how surveys can detect the baryons through a global suppression of the power spectrum on scales smaller than the sound horizon. Such a technique is much more robust to detecting the effects of the baryons, since it occurs over a large range of scales (as opposed to the two or three nearly discrete features from acoustic oscillations). Specifically, we have examined the detectability of any suppression in the on scales , which could be due to the existence of baryons as well as DM-baryon scattering interactions.
The local contains a wealth of information imprinted on it. Unfortunately, our measurements of the local are as yet unable to fully extract all this information, (e.g. the unambiguous detection of baryons). While features in the have been found at and in many different (and independent) datasets (Miller et al. 2001a), there is no conclusive proof that they are the result of baryon fluctuations (although see Miller et al. 2001b). Likewise, the accuracy of power measurements on the largest scales is not yet good enough to use the techniques described in this paper on real measurements. However, under the hypothesis that the current data on large-scales can accurately trace the power, we use model power spectra to find that both the Abell/ACO (through its volume) and the 2dFGRS (through its sampling) are close to being able to detect baryon suppression. The combination of volume and sampling from the Sloan Digital Sky Survey may soon provide the answer (York et al. 2000, Stoughton et al. 2002). Therefore, it is important to continue to pursue high precision measurements of the over as large a range of ’s as possible. This should be achieved through larger surveys of clusters and galaxies which possess a well-determined, compact window function and a high sampling density. Likewise, strong dark matter–baryon interactions could also produce a suppression in the matter power spectrum, whose evidence could be found using these methods. Current data sets could already detect such interaction if its strength is as strong as the Spergel-Steinhardt self interaction, and this could be further improved with the SDSS data.
Acknowledgments X.C. is supported by the NSF under grant PHY99-07949.
References
- Balbi et al. (2000) Balbi, A. et al. 2000, ApJ, 545, L1
- Benjamini and Hochberg (1995) Benjamini, Y., Hochberg, Y., 1995, JRSSB, 57, 289
- Chen, Kamionkowski, Zhang (2001) Chen, X., Kamionkowski, M., Zhang, X., 2001, Phys. Rev. D, 64, 021302.
- Chen, Hannestad & Scherrer (2002) Chen, X., Hannestad S., Scherrer, R. J., 2002, PRD accepted (astro-ph/0202496).
- Colless et al. (2001) Colless, M. et al. 2001, MNRAS, 328, 1039
- de Bernardis et al. (2002) de Bernardis, P. et al. 2002, ApJ, 564, 559
- (7) Eisenstein, D.J., Hu, W. 1998, ApJ, 496, 605
- Eisenstein, Hu, Silk, & Szalay (1998) Eisenstein, D. J., Hu, W., Silk, J., & Szalay, A. S. 1998, ApJ, 494, L1
- Eisenstein & Hu (1999) Eisenstein, D. J. & Hu, W. 1999, ApJ, 511, 5
- Elgaroy et al. (2002) Elgaroy et al. 2002, PRL in press, astro-ph/0204152
- Feldman, Kaiser, & Peacock (1994) Feldman, H. A., Kaiser, N., & Peacock, J. A. 1994, ApJ, 426, 23
- Halverson et al. (2002) Halverson, N. W. et al. 2002, ApJ, 568, 38
- Hamilton, Tegmark, & Padmanabhan (2000) Hamilton, A. J. S., Tegmark, M., & Padmanabhan, N. 2000, MNRAS, 317, L23
- Hamilton & Tegmark (2002) Hamilton, A. J. S. and Tegmark, M. 2002, MNRAS, 330, 506
- Hopkins et al. (2002) Hopkins, A. M., Miller, C. J., Connolly, A. J., Genovese, C., Nichol, R. C., & Wasserman, L. 2002, AJ, 123, 1086
- Hoyle et al. (2002) Hoyle, F., Outram, P. J., Shanks, T., Croom, S. M., Boyle, B. J., Loaring, N. S., Miller, L., & Smith, R. J. 2002, MNRAS, 329, 336
- Lee et al. (2001) Lee, A. T. et al. 2001, ApJ, 561, L1
- Meiksin, White, & Peacock (1999) Meiksin, A., White, M., & Peacock, J. A. 1999, MNRAS, 304, 851
- Melchiorri et al. (2000) Melchiorri, A. et al. 2000, ApJ, 536, L63
- Miller et al. (1999) Miller, A. D. et al. 1999, ApJ, 524, L1
- Miller & Batuski (2001) Miller, C. J. & Batuski, D. J. 2001, ApJ, 551, 635
- Miller, Nichol, & Batuski (2001a) Miller, C. J., Nichol, R. C., & Batuski, D. J. 2001a, ApJ, 555, 68
- Miller, Nichol, & Batuski (2001b) Miller, C. J., Nichol, R. C., & Batuski, D. J. 2001b, Science, 292, 2302
- Miller et al. (2001c) Miller, C. J. et al. 2001c, AJ, 122, 3492
- Miller, Nichol, Genovese, & Wasserman (2002a) Miller, C. J., Nichol, R. C., Genovese, C., & Wasserman, L. 2002a, ApJ, 565, L67
- (26) Miller, C.J., Krughoff, K.S., Batuski, D.J., Slinglend, K.A., Hill, J.M., 2002b, AJ in press
- (27) Nettefield, C.B., et al. 2002, ApJ in press
- Narayanan, Berlind & Weinberg (2000) Narayanan, V. K., Berlind, A. A. & Weinberg, D. H. 2000, ApJ, 528, 1
- Percival et al. (2001) Percival, W. J. et al, 2001, MNRAS, 327, 1297
- Saunders et al. (2000) Saunders, W. et al. 2000, MNRAS, 317, 55
- Spergel & Steinhardt (2000) Spergel, D. N., Steinhardt, P. J., 2000, Phys. Rev. Lett., 84, 3760.
- Starkman et al. (1990) Starkman, G. D., Gould, A., Esmailzadeh, R., Dimopoulous, S., 1990, Phys. Rev. D, 41, 3594.
- Stoughton et al. (2002) Stoughton, C. et al. 2002, AJ, 123, 485
- Tago et al. (2002) Tago, E., Saar, E., Einasto, J., Einasto, M., Müller, V., & Andernach, H. 2002, AJ, 123, 37
- (35) Tegmark, M., Hamilton, A.J.S., and Xu, Y. 2002, MNRAS in press astro-ph/0111575
- Wandelt et al. (2000) Wandelt, B.D. et al., 2000, Proceedings of Dark Matter 2000, [astro-ph/0006344].
- Wang et al. (2001) Wang, X., Tegmark, M. and Zaldarriaga, M. 2001, Phys. Rev. D. submitted, astro-ph/0105091 – WTZ
- York et al. (2000) York, D. G. et al. 2000, AJ, 120, 1579