XMM-Newton observation of the Lockman Hole ††thanks: Based on observations obtained with XMM-Newton, an ESA science mission with instruments and contributions directly funded by ESA Member States and the USA (NASA)
We present the results of the X-ray spectral analysis of the first deep X-ray survey with the XMM-Newton observatory during Performance Verification. The X-ray data of the Lockman Hole field and the derived cumulative source counts were reported by Hasinger et al. (2001). We restrict the analysis to the sample of 98 sources with more than 70 net counts (flux limit in the [0.5-7] keV band of erg cm-2 s-1) of which 61 have redshift identification. We find no correlation between the spectral index and the intrinsic absorption column density NH and, for both the Type-1 and Type-2 AGN populations, we obtain . The progressive hardening of the mean X-ray source spectrum with decreasing flux is essentially due to an increase in intrinsic absorption. The marked separation between the two AGN populations in several diagnostics diagrams, involving X-ray colour, X-ray flux, optical/near IR colour and optical brightness, is also a consequence of different absorption column densities and enables the classification of optically faint obscured AGN. The Type-2 and obscured AGN have weaker soft X-ray and optical fluxes and redder RK′ colours. They follow the evolutionary tracks of their host galaxies in a color-redshift diagram. About 27 of the subsample with RK′ colour are EROs (RK) and most of these 18 X-ray selected EROs contain an obscured AGN as revealed by their high X-ray-to-optical/near IR flux ratios. There are six sources in our sample with [0.5-10] erg s-1 and cm-2: which are likely Type-2 QSOs and we thus derive a density of objects of this class per square degree.
Key Words.:
Surveys – Galaxies: active – (Galaxies:) quasars: general – (Cosmology:) diffuse radiation – X-ray: galaxies – X-rays: general1 Introduction
The deep ROSAT survey of the Lockman Hole showed that about 80 of the soft (0.5-2 keV) X-ray background (XRB) is resolved into discrete sources (Hasinger et al. gunther98 (1998)). These findings have recently been confirmed and strengthened using the two deep Chandra surveys of 1 Msec each (Brandt et al. brandt01 (2001); Rosati et al. piero02 (2002)). An important population of X-ray sources with hard spectra, most probably obscured active galactic nuclei (AGN), is present in the Chandra (Barger et al. barger01 (2001); Hornschemeier et al. hornschemeier01 (2001); Rosati et al. piero02 (2002)) and XMM-Newton (Hasinger et al. paper1 (2001), hereafter Paper I) deep surveys; a few objects of this class had already been detected in ROSAT deep and shallower surveys (Lehmann et al. 2001a ; Mittaz et al. mittaz99 (1999)). In the hard band (2-10 keV), the X-ray source density derived from the number counts in the two Chandra deep surveys is about 4000 deg-2 (Brandt et al. brandt01 (2001); Rosati et al. piero02 (2002)) resolving of the 2-10 keV XRB. This population of X-ray sources show a progressive hardening of the average X-ray spectrum towards fainter fluxes (Tozzi et al. paolo01 (2001); Mittaz et al. mittaz99 (1999)).
The XMM-Newton deep survey ( 100 ksec of good quality data) of the Lockman Hole was obtained during Performance Verification. The X-ray data reduction and analysis (restricted to sources within a 10 arcmin radius) was reported in Paper I where it was demonstrated that the different populations of X-ray sources are well separated in X-ray spectral diagnostics based on hardness ratios. The extensive optical follow-up programs of this field (Lehmann et al. 2001a , and references therein) provide an understanding of the physical nature of the X-ray sources. The point sources detected in the soft band by ROSAT are predominantly unobscured (in both optical and X-ray bands) AGN spanning a wide redshift range. In the XMM-Newton sample, there is a significant fraction of sources with hard spectra. This new population is most probably dominated by intrinsically absorbed AGN. This assumption can be tested using the available optical spectra and, more efficently, by X-ray spectral study.
To this aim, we have performed an X-ray spectral analysis of the
sources in the Lockman Hole to understand their physical nature
combining the X-ray data with the optical/near IR information. We also
use the subsample with redshift identification to check the validity
of our conclusions concerning the specific properties of the obscured
AGN population. Preliminary results of this work were reported by
Mainieri et al. (mainieri02 (2002)).
In the following we will refer
to Type-1 (broad and narrow emission lines) and Type-2 AGN (high
ionization narrow emission lines) using the optical spectroscopic
classification.
The observations are presented in Sect. 2. The results of the spectral analysis are described in Sect. 3, in particular the range of the X-ray spectral index, the observed distribution and colour-colour diagnostics diagrams. The optical/near IR properties are discussed in Sect. 4 together with a comparison with QSO and galaxy evolutionary tracks. The search for relations between X-ray and optical/near IR fluxes is presented in Sect. 5. The effect of the absorbing column density on the X-ray luminosity and the Type-2 QSO candidates are discussed in Sect. 6. Representative spectra of the different classes of X-ray sources are given in Sect. 7. Finally, our conclusions are outlined in Sect. 8.
2 X-ray observations
2.1 Sample definition
The X-ray results reported in this paper are obtained from the XMM observation of the Lockman Hole field, centered on the sky position RA 10:52:43, DEC +57:28:48 (J2000). This is a region of extremely low Galactic Hydrogen column density, (Lockman et al. lockman86 (1986)). The observation was performed in five separate revolutions (, , , and ) during the period April -May , for a total exposure time of ksec. Due to periods of high background and flares, the good time intervals added up to approximately ksec.
The dataset, the cleaning procedure used, the source detection and the astrometric corrections are described in details in Paper I.
In this work, we use a sample of 192 sources with a likelihood value (corresponding to ; see Paper I), and extend the analysis to the whole Lockman Hole field of view (in Paper I only sources with off-axis angle were considered). The flux limits of this sample in the [0.5-2], [2-10] and [5-10] keV bands are 0.31, 1.4 and erg cm-2 s-1, respectively. We have used only EPIC-pn data in this work. We restrict the X-ray spectral analysis to sources with more than 70 counts in the [0.5-7] keV band after background subtraction, for which a reasonable parameter fit can be obtained. This defines a sample of 98 sources, of which 76 within an off-axis angle of . The full sample includes 38 Type-1 AGN, 15 Type-2 AGN, 34 unidentified sources (mostly newly detected XMM-Newton sources), four extended sources, two normal galaxies and five stars.
2.2 The X-ray source catalogue
The catalogue of the 98 X-ray sources studied here is given in Table 2. We report in the first two columns the source number and the ROSAT number (if any); in the third column the classification scheme (see Schmidt et al. schmidt98 (1998)): 1=Type-1 AGN, 2=Type-2 AGN, 3=galaxy, 4=group/cluster of galaxies, 5=star, 9=unidentified source; in columns 4 and 5 the X-ray source coordinates (J2000). Off-axis angles and observed counts in the [0.5-7] keV band are reported in columns 6 and 7. The X-ray flux is given in three different bands : [0.5-2], [2-10] and [5-10] keV (see Table 2 in Paper I for the energy conversion factors in the different bands). Cols. 11, 12 and 13 give the R and K′ magnitudes, and RK′ colour respectively. In column 14, we give the redshift based on low-resolution Keck spectra. The column density, (in excess to the galactic ones), and the spectral index as measured from spectral fitting are reported in columns 15 and 16. The errors correspond to confidence level for one interesting parameter (). The last two columns give the absorbed X-ray luminosities, which are derived from the X-ray spectra in the rest-frame bands: [0.5-2] and [2-10] keV. We assume a critical density universe with km and .
3 Spectral analysis
3.1 Spectra extraction
The purpose of this work is to perform an X-ray spectral analysis of the sources in the Lockman Hole field, taking advantage of the large collecting area of the XMM-Newton satellite. This represent a step forward respect to the hardness ratios diagnostic diagrams and stacking techniques (Tozzi et al. paolo01 (2001); Alexander et al. 2001a ) in which the range of source redshifts will smear out the signature of absorption and other X-ray spectral features (e.g., the iron K line).
We use an automated procedure to extract the X-ray spectra of the 98 sources. Firstly, a source catalog is constructed using the SAS detection algorithm (see Paper I for details on the detection process). We then perform the source detection using SExtractor (Bertin et al. ) on the same image ([0.5-7] keV band). SExtractor yields shape elliptical parameters for each source (the semi-major/minor axes and the orientation angle) which are added to the main SAS catalog by cross-correlating the two source lists.
Elliptical parameters for each source are used to define the appropriate region for the extraction of the spectrum, thus taking into account the broadening of the PSF at increasing off-axis angles. The background region is defined as an annulus around the source, after masking out nearby sources. The XSELECT tool is used to extract the spectrum, and the GRPPHA tool is used to bin the data so as to have at least 20 counts per bin. In this process, the background count rate is rescaled with the ratio of the source and background areas.
3.2 Spectral parameters
We use XSPEC (v11.1) for the spectral fitting analysis. As a first approximation, a model with an intrinsic absorption ( or if the redshift is known) is used. An additional photoelectric absorption component () fixed to the Galactic column density is also included in the model.
This fit yields the power-law photon index , the intrinsic column density , and the X-ray luminosity in the [0.5-2] and [2-10] keV rest-frame bands. A clear soft excess is present in several sources (especially the absorbed ones). In order to reproduce this feature we add two separate components to the baseline model (wabszwabspowerlaw): a blackbody or an extra powerlaw. Extra parameters measured from this composite fit (second power-law index or blackbody temperature) are not reported in Table 2111In Sect. 7, we present six spectra and best fit models representative of different classes of objects..
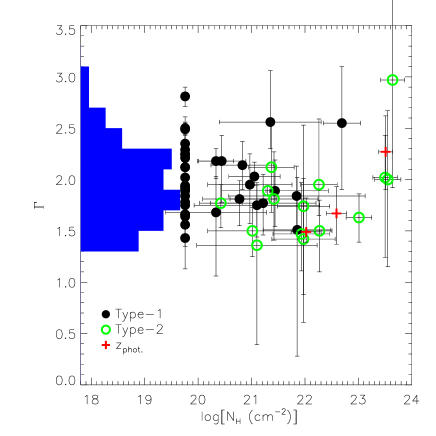
In Fig. 1, we plot versus the column density for the sources with known redshifts. This diagram suggests that the intrinsic slope of the X-ray spectrum is the same for all the objects whatever the absorption levels, with . Therefore the increasing hardness of the source spectra at fainter fluxes observed in the Chandra deep fields (Giacconi et al. giacconi01 (2001); Tozzi et al. paolo01 (2001); Brandt et al. brandt01 (2001)) is probably due to intrinsic absorption and not to an intrinsically hard power law. Several teams (Della Ceca et al. 1999b ; Akiyama et al. akiyama00 (2000); Fiore et al. fiore01 (2001); Maiolino et al. 2001a ; Page et al. page01 (2001); Reeves et al. reeves00 (2000); Risaliti et al. risaliti01 (2001)) reported the existence of AGN optically classified as Type- but with an indication of absorption in their X-ray spectra. In our sample, there are seven objects with an intrinsic absorption between and cm-2 which are optically classified as Type- AGN. Moreover, the source (ROSAT ) shows a high intrinsic absorption of cm-2 while it was optically classified as an unabsorbed QSO at a redshift of . In these cases the optical classification is de-coupled from the X-ray classification. This could be due to a gas-to-dust ratio and/or a chemical composition different from those in Galactic interstellar gas (Akiyama et al. akiyama00 (2000); Maiolino et al. 2001b ). The three sources with photometric redshifts have an absorption greater than cm-2 which, combined with the RK′ colours, suggest that they are probably obscured AGN (Lehmann et al. 2001a ).
3.3 Observed distribution
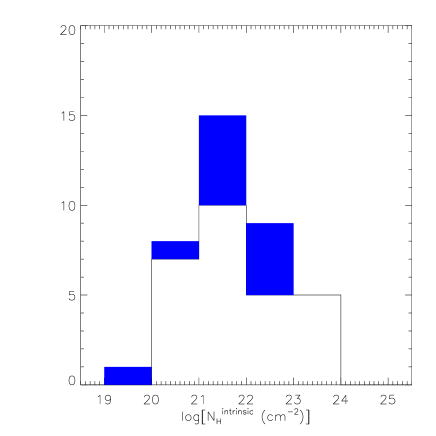
The distribution and its cosmological evolution are key ingredients in the XRB synthesis models (Comastri et al. comastri95 (1995); Gilli et al. gilli01 (2001)). In Fig. 2 we show the distribution for the 38 sources with an off-axis angle . In this central region where the exposure time is approximately constant, our threshold of 70 counts in the [0.5-7] keV band corresponds to a flux of erg cm-2 s-1. The surface density of sources down to this flux limit, 1700 deg-2, is in very good agreement with that derived from the logN-logS relation given in Paper I. Therefore our sample can be regarded complete and the derived NH distribution representative of the overal AGN population at the afore mentioned flux limit.
3.4 X-ray colour-colour diagrams
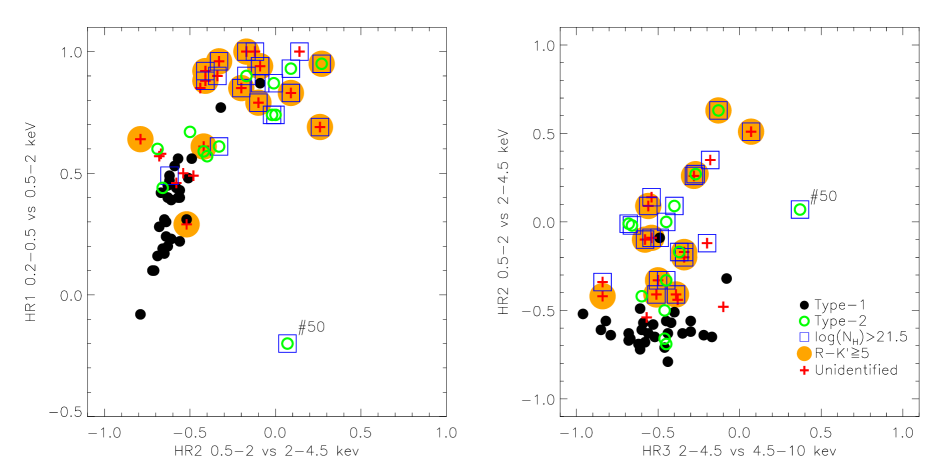
A useful method to constrain the nature of X-ray sources, in particular when the signal-to-noise ratio is not high enough for spectral analysis, is to use X-ray colour-colour diagrams (e.g. Della Ceca et al. 1999a ; Paper I). In Fig. 3 we present two of these diagrams. We have used the energy bands : 0.2-0.5 keV (US), 0.5-2 keV (S), 2-4.5 keV (M) and 4.5-10 keV (H) to define three different hardness ratios: HR1=(S-US)/(S+US), HR2=(M-S)/(M+S), HR3=(H-M)/(H+M). We use different symbols to indicate Type- AGN, Type- AGN and unidentified sources. The sources with have special labels (square box); when the redshift is unknown, the derived column densities are only lower limits. We also highlight the sources with RK, usually called Extremely Red Objects (see Sect. 4.2 for a discussion of the properties of this class of objects).
In both diagrams, Type- AGN are confined in a small region, as opposed to Type- AGN and unidentified sources which are spread over a much broader area with high hardness ratios (see also Paper I). Moreover, using the additional information on the measured intrinsic absorption column density, it is now clear that the hardening of non-Type-1 sources is mainly due to the presence of intrinsic absorption with superimposed on relatively soft spectra (see Fig. 1), rather than intrinsically hard spectra (this is also consistent with the fact that Type-1 and Type-2 AGN span similar range in HR3). These diagrams also suggest that a large fraction of the unidentified sources (mainly newly detected XMM-Newton sources) are X-ray obscured AGN.
4 Optical properties
4.1 Optical-to-near-IR colours
A deep broad-band K′ (1.92-2.29 ) survey of the Lockman Hole region was carried out with the Omega-Prime camera (Bizenberger et al. bizenberger98 (1998)) at the Calar Alto 3.5m telescope in 1997 and 1998. This survey covers approximately half the Lockman Hole field.
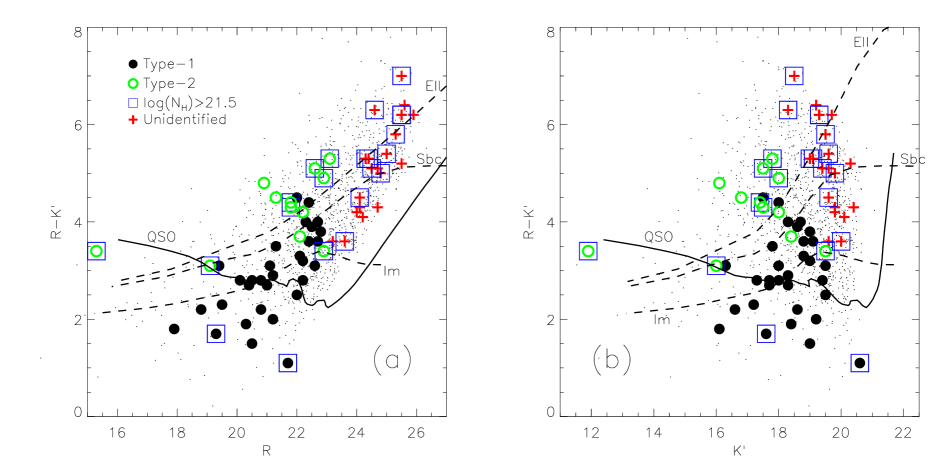
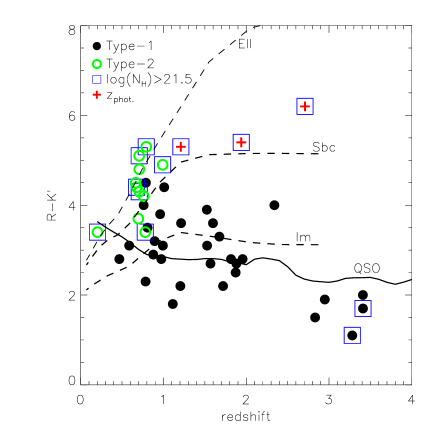
Several X-ray surveys (Hasinger et al. gunther99 (1999); Giacconi et al. giacconi01 (2001); Lehmann et al. 2001a ; Alexander et al. 2001a ) have shown that the RK′ colour of the optical counterparts of X-ray sources increases with the optical faintness, and this in a more pronounced way than for the field sources (Rosati et al. piero02 (2002)). This trend is also evident in the colour-magnitude diagram RK′ versus R shown in Fig. 4a. We note that the still unidentified objects are significantly redder than the bulk of the identified sources. Using the X-ray information on , we also find that there is a strong correlation between the X-ray absorption and optical colour. For comparison, we also plot the evolutionary tracks of an early, late and irregular galaxy type using the template library of Coleman et al. (coleman80 (1980)), whose spectral energy distributions (SEDs) were extended to the near-IR and far UV using Bruzual & Charlot (1993) models as updated in 2000 (private communication). Magnitudes are normalized to the measured local value K, and no dust extinction is assumed. The QSO evolutionary track is derived from the empirical template from the Sloan Digital Sky Survey (Vanden Berk et al. vanden01 (2001)), together with the models of Granato et al. (granato97 (1997)), normalized to M (for brighter objects the curve should be shifted to the left), for the extension in the near IR.
In the RK′ versus K′ diagram, shown in Fig. 4b, there is no evident trend between RK′ colour and near-IR flux. Moreover, the range of K′ magnitudes covered by the Type-2 AGN and unidentified sources is almost the same as that of the Type-1 AGN population. This is likely due to a combination of a less pronounced absorption effect in the K′ band, a different K-correction for AGN-type spectra (small) and star-like galaxy spectra (large), as well as an increased contribution of the host galaxy light in the K′ band relative to that of the AGN. Consequently the difference in the observed magnitudes between absorbed and unabsorbed sources is smaller than in the R band.
The RK′ versus redshift diagram is shown in Fig. 5 for the subsample with optical identification (redshift and AGN type) and X-ray spectral fit (see also Fig. 7 in Lehmann et al. 2001a). The correlation between optical classification, optical/near IR colour and X-ray absorption is even clearer than in Fig. 4. Most of Type-2 AGN, whose optical colours are dominated by the host galaxy, are also significantly absorbed (log N), whereas Type-1 AGN are unobscured and the emission from the central AGN is contributing significantly to their optical colours. There are two exceptions, high redshift Type-1 QSOs, which are optically unobscured but absorbed in the X-ray band (see Sect. 7.4): this could indicate a variation in the gas-to-dust ratio (Granato et al. granato97 (1997); Maiolino et al. 2001a ; Maiolino et al. 2001b ). The colours of the three sources with photometric redshifts appear to be dominated by the light from their host galaxies.
The spectroscopic identification is still in progress and, to date, we have 24 new XMM-Newton sources with measured redshift using LRIS at the Keck II telescope in March 2001 (PI: Maarten Schmidt). There is an increasing fraction of Type-2 AGN among these fainter X-ray sources, and almost all the identified Type-2 AGN are at . The derived but still preliminary redshift distribution seems to be in clear disagreement with predictions from X-ray background models (e.g. Gilli et al. gilli01 (2001)) based on the integrated emission of Type-1 and Type-2 AGN and constrained by deep ROSAT surveys (see also Hasinger gunther02 (2002); Rosati et al. piero02 (2002)). This calls for a revision of the evolutionary parameters of these models for both the space density of Type-1 and Type-2 AGN and the obscuration fraction (Type-1/Type-2 ratio) as a function of the redshift. The latter is directly related to assumptions in the unified AGN scheme.
| Ty- | Ty- | Unid.c | Absd | |
|---|---|---|---|---|
| () | () | () | () | |
| ( ) | () | () | () | |
| ( ) | () | () | () | |
| ( ) | () | () | () |
a Type- AGN
b Type- AGN
c Unidentified sources
d Sources with log(N
4.2 X-ray detected Extremely Red Objects
In recent years, much efforts have been devoted to understand the nature of Extremely Red Objects (EROs hereafter). We define EROs as objects with 222Other selection criteria have also been used, such as or ..
In a recent wide-area survey, Cimatti et al. (cimatti02 (2002)) have spectroscopically identified a sizeble sample of field EROs with K and found them to be almost equally divided between old passively evolving ellipticals and dusty star-forming galaxies at . With XMM-Newton and Chandra observations (Alexander et al. 2001b ; Brusa et al. brusa02 (2002)), the fraction of optical counterparts with extremely red colours has significantly increased when compared to the first examples of EROs found in ROSAT surveys (Lehmann et al. 2001a ).
In the subsample of 66 X-ray sources with measured colour, we find 18 (or 27) EROs. Two of them are Type-2 AGN, one is classified as a normal galaxy, one is an extended source and 14 are unidentified sources; no Type-1 AGN are found. From Table 1, we infer that the fraction of Type-1 AGN decreases with increasing values of , whereas the fraction of unidentified sources and intrinsically absorbed (log(N) sources increases. Moreover, all the X-ray detected EROs have an X-ray-to-optical flux ratio (see Fig. 6b) and they sample the hardest part of X-ray colour-colour diagrams (see Fig. 3). The X-ray luminosities in the [0.5-10] keV rest-frame energy band of the seven EROs with known spectroscopic and/or photometric redshift are in the range erg s-1. We thus conclude that our X-ray selected sample of EROs is heavily dominated by sources with strong AGN activity and absorbed X-ray spectra (twelve, or 67, have log(N).
In the 1 Msec observation of the Chandra Deep Field South (Tozzi et al. paolo01 (2001); Rosati et al. piero02 (2002)) about 5 of the optically selected EROs are detected at X-ray energies, and their stacked spectrum is consistent with absorbed objects. In that field 19 of the X-ray sources are EROs, down only to the flux limits of our complete sample in the Lockman Hole.
5 X-ray-to-optical flux ratios
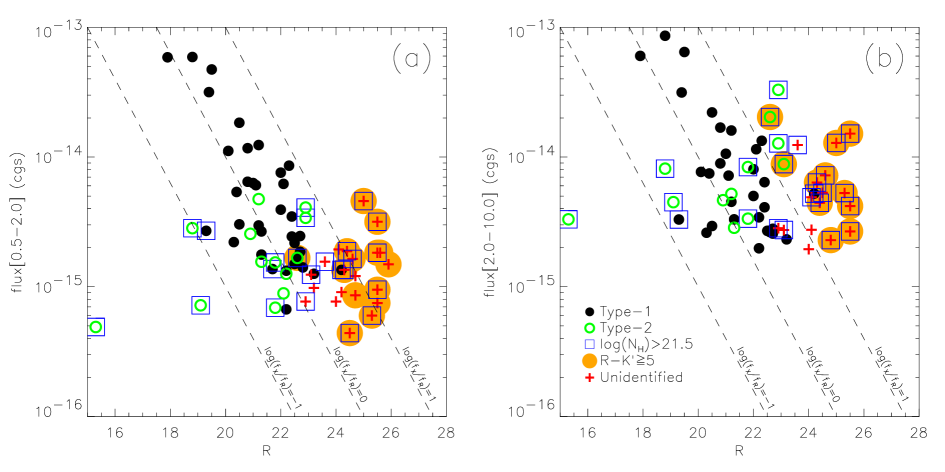
X-ray-to-optical flux ratios can yield important information on the nature of X-ray sources (Maccacaro et al. maccacaro88 (1988)). A value of is a clear sign of AGN activity since normal galaxies and stars have usually lower X-ray-to-optical flux ratios, . In Fig. 6, we plot the X-ray flux in [0.5-2.0] (a) and [2.0-10] (b) keV bands as a function of the R magnitude for the 98 sources of the sample. A large fraction of the sources spans the typical X-ray-to-optical flux ratio of AGN. While in the soft band (Fig. 6a) the Type-2 AGN and the unidentified sources are confined at the lower fluxes of our sample, in the hard band (Fig. 6b), where the effect of the absorption is weaker, the range of fluxes covered by these sources is almost the same as that of the Type-1 AGN sample. We also note that of the sources are confined in a region with . Among the sources with a high X-ray-to-optical flux ratio, are heavily absorbed (log(N) and are EROs. Their optical classification is still largely incomplete due to their faintness: two are Type-1 AGN, four are Type-2 AGN, one is an extended source and 13 are unidentified.
At the current flux limit of our complete sample, the population of objects with very low X-ray-to-optical flux ratio is largely missing. Such a population was unveiled by the Chandra deep surveys (Giacconi et al. giacconi01 (2001); Hornschemeier et al. hornschemeier01 (2001)) and found to comprise normal galaxies and low-luminosity AGN (with L erg s-1 in the [0.5-10] keV energy band).
There are examples in the literature of “X-ray bright” objects (LX[2-10] erg s-1) but without any obvious signature of nuclear activity in the optical spectra (Griffiths et al. griffiths95 (1995); Comastri et al. comastri02 (2002) and references therein). A heavily obscured AGN is among the most likely explanations. In our sample there are two sources ( and ) optically classified as normal galaxies (their optical spectra show emission lines that declare them as star-forming galaxies) which are however X-ray luminous: LX[2-10] and LX[2-10] erg s-1 respectively. Their X-ray spectra are clearly absorbed ( and ) reinforcing the evidence that they contain an obscured AGN. More examples of this class of objects are expected at the completion of the optical identification of the newly detected XMM-Newton sources.
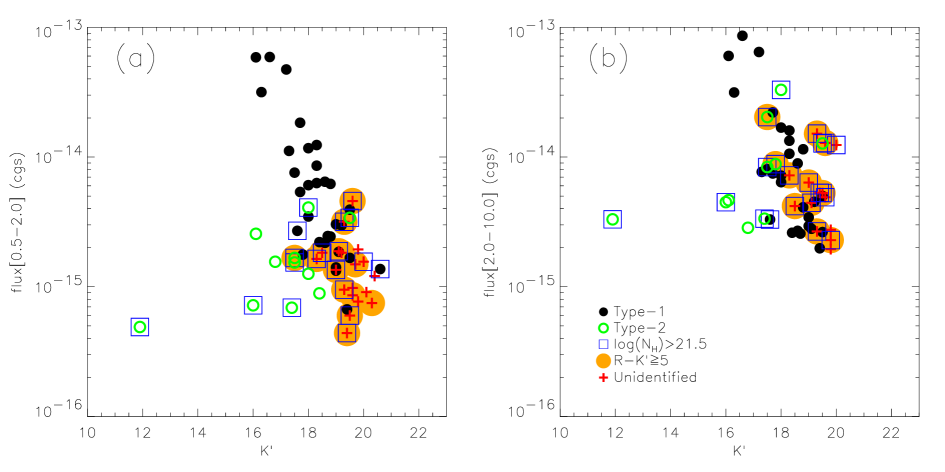
In Fig. 7, we plot the X-ray flux in [0.5-2.0] (a) and [2.0-10] (b) keV bands as a function of K′ magnitudes. In these diagrams, there is a strong overlap between Type-2 AGN and unidentified sources and the Type-1 AGN population, more prounonced in Fig. 7b. The overlap in magnitudes is likely due mainly to a K-correction effect (see also Fig. 4b), whereas in the X-ray hard band the effect of the absorption is weaker (see also Fig. 6b).
6 X-ray luminosity and Type-2 QSO candidates
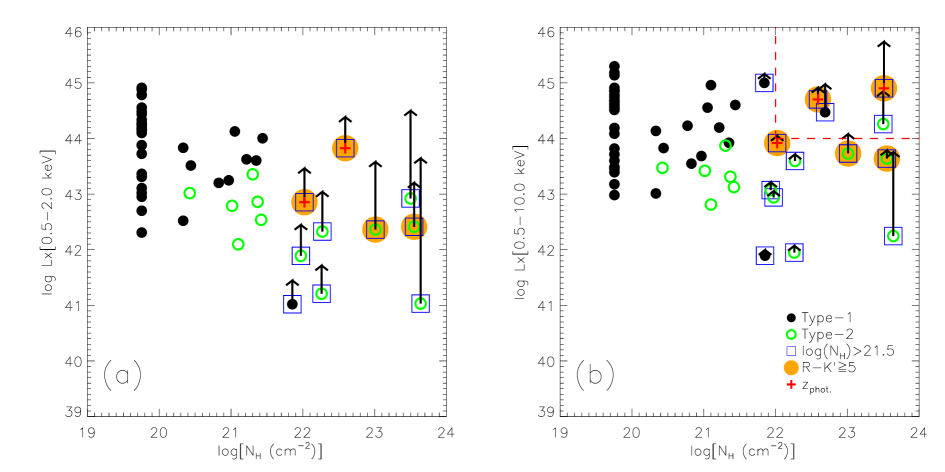
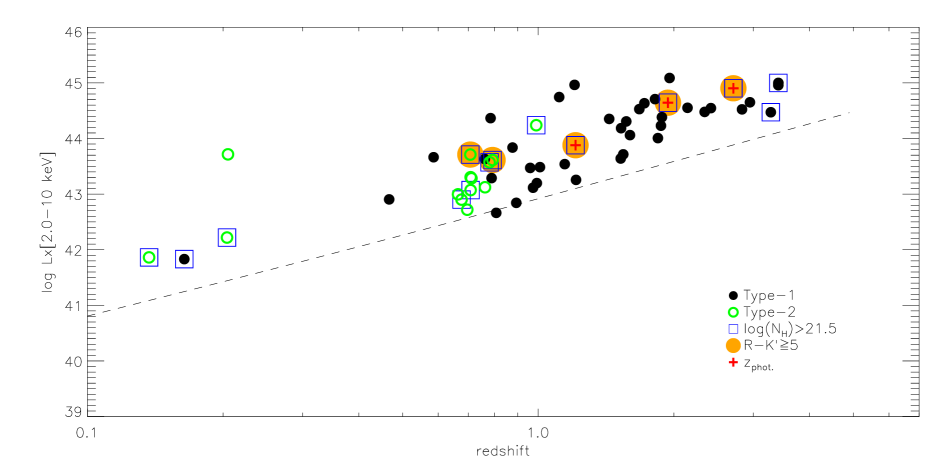
We have redshifts (and luminosities) for 61 objects or of the sample with X-ray spectral analysis. In Fig. 8, we plot X-ray luminosity in the [0.5-2] (a) and [0.5-10] (b) keV rest-frame bands as a function of the log(). Type-1 AGN (objects without soft absorption) cover a range between erg s-1 and erg s-1 in the [0.5-2] keV band; whereas absorbed Type-2 AGN have luminosities in the range - erg s-1. In the total band (Fig. 8b) the effect of absorption is less evident so that the range of luminosity of Type-1 ( - erg s-1) and Type-2 AGN ( - erg s-1) is comparable. We have derived the unabsorbed luminosities for objects with log(N and reported them in Fig. 8 as arrows. In the soft band (Fig. 8a), where the effect of absorption is stronger, luminosities increase substantially and the range of intrinsic luminosities of Type-2 AGN fall in the same range as that of Type-1’s (see also Gilli et al., in preparation). In Fig. 8b, we have highlighted the region where LX[0.5-10] erg s-1 and cm-2, i.e. the “Type-2 QSO region”. Six objects fall inside this area: one is optically classified as a Type-1 AGN (see Sect. 7.4 for more details), two are Type-2 AGN. For the remaining three, we derived photometric redshifts and due to their X-ray absorption and optical/near-IR colours are likely Type-2 AGN. Four of them are also EROs. We argue that these six sources are reliable Type-2 QSO candidates. All of them are within an off-axis angle of 10 where the sample is complete (see Sect. 3.3) and we thus derive a density of 69 objects of this class per square degree.
In Fig. 9, we show the X-ray luminosity as a function of redshift, using the observed hard band luminosity which is relatively unaffected by absorption.
7 High S/N spectra
In Fig. 10 we show six X-ray spectra representative of the different classes of objects in our sample. The source numbers refer to the catalogue presented in this work, for reference we give also the ROSAT catalogue numbers (Hasinger et al., gunther98 (1998)). The redshift of the sources are reported in Lehmann et al. (2001a ). Sources with interesting line features will be reported in a future work (Hasinger et al. 2002, in preparation).
7.1 Unabsorbed sources
Source (ROSAT ): this source was already observed by ROSAT
(Lehmann et al. ingo00 (2000)) and optically classified as a Type-1
AGN at .
This is one of the brightest sources in our sample (3164 EPIC-pn
counts in the [0.5-7] keV band).
This source is very well fitted () by a simple power
law model with and
consistent with the Galactic value ( ). We measure erg s-1 in
the [0.5-10] keV rest-frame band, and .
Source (ROSAT ): it was
observed by ROSAT (Schmidt et al.schmidt98 (1998)) and classified as a
Type-1 AGN at .
This source (1537 EPIC-pn counts in the [0.5-7] keV band) is well
fitted () by a simple power law model with
and NH consistent with the
Galactic value ( ). It has L erg s-1 in the [0.5-10] keV rest-frame band.
7.2 Absorbed sources
Source (ROSAT ): this object was part of the ROSAT
ultradeep HRI survey (Hasinger et al., gunther98 (1998)). Lehmann et
al. (2001a ) give a photometric redshift .
The spectrum extracted from the EPIC-pn data (332 counts in the
[0.5-7] keV band) is well fitted () by a model, with an intrinsic absorption of and
; the unabsorbed rest-frame luminosity in
the [0.5-10] keV band is erg
s-1.
Source (ROSAT ): was observed by ROSAT
(Schmidt et al. schmidt98 (1998)) and optically classified as a Type- AGN at
. From the fit of the X-ray spectra we get
the values, cm-2 and
. The unabsorbed X-ray luminosity in the
[0.5-10] keV rest-frame band is
erg s-1.
7.3 Multi component spectra
Source (ROSAT ): this source was classified as a Type-2 AGN at z=0.204 by Lehmann et al. (2001a ). As noted in Paper I, a very soft component superimposed on a heavy absorbed power law, is likely present in this source as suggested by the unusually large value of the hardness ratio HR3. The XMM-Newton spectrum clearly shows such a feature. By fitting a double power law model (), we obtain: cm-2, for the hard component and for the soft component (). We also find an unabsorbed X-ray luminosty L erg s-1 in the [0.5-10] keV rest-frame band and a ratio , unusually low for an AGN, which is probably due to the strong intrinsic absorption.
7.4 Type-1 QSO with X-ray absorption
Source (ROSAT ): this object is optically classified as a Type-1 QSO at (Lehmann et al., 2001a ). A clear absorption is present in the X-ray spectrum and the fit yields cm-2. As already argued in Sect. 3.2, this mismatch between the optical and X-ray classifications could be due to a gas-to-dust ratio or a chemical composition different from that of the Galactic interstellar gas (Akiyama et al. akiyama00 (2000); Maiolino et al. 2001b ).
8 Conclusions
We have discussed the X-ray spectral properties of a sample of 98 sources found in the 100 ksec XMM-Newton observation of the Lockman Hole, using data from the EPIC-pn detector. The large throughput and the unprecedented sensitivity at high energies of the X-ray telescope and detectors allow us, for the first time, to measure separetely the intrinsic absorption and the slope of the power law emission spectrum for the faint source population. We have derived the spectral index () and the column density () for sources with more than 70 counts in the [0.5-7] keV band. We find that the value of is independent of the absorption level with . Thus, we infer that the progressive hardening of the X-ray spectra of faint sources observed in Chandra deep fields (Giacconi et al. giacconi01 (2001); Tozzi et al. paolo01 (2001); Brandt et al. brandt01 (2001)) is mainly due to the increasing level of intrinsic absorption rather than intrinsically flat spectra.
We confirm that the colours of X-ray counterparts get redder towards fainter R magnitudes. Such a trend is not present between and the K′ magnitude; this is likely due to a combination of a less pronounced absorption effect in this band, a different K-correction for AGN-type spectra (small) and star-like galaxy spectra (large), as well as an increased contribution of the host galaxy light in the K′ band relative to that of the AGN.
Comparing the colours of the X-ray sources with evolutionary tracks of various galaxy-types as a function of redshift, we find that Type-2 AGN have colours dominated by the host galaxy and are also significantly absorbed (log ). On the other hand, for Type-1 AGN, the large majority of which are unabsorbed, the nuclear component is significantly contributing to their optical colours. In addition, there is a strong correlation between the colour and the amount of intrinsic X-ray absorption.
We have also defined an X-ray selected sample of 18 EROs () and found that it mainly comprises X-ray absorbed objects with a strong correlation between colour and intrinsic column density.
We have derived the unabsorbed rest-frame luminosities of the sources with strong intrinsic absorption. There are six absorbed, bright X-ray objects in our sample with erg s-1 and cm-2: one is an optically classified Type-1 QSO (source see Sect. 7.4), two are Type-2 AGN and the remaining three have a photometric redshift and due to their X-ray absorption and optical/near-IR colours likely Type-2 AGN. Four of them are also EROs (). These are likely to be Type-2 QSO candidates and we derive a density of objects of this class per square degree at a flux limit in the [0.5-7] keV band of erg cm-2 s-1.
Our analysis of the unidentified sources (mostly newly detected XMM sources) shows that the majority of these sources have absorbed X-ray spectra and are consequently located in the harder part of the diagnostic X-ray colour-colour diagrams. They are also optically fainter ( of them have R) and their optical-to-near-IR colours are redder ( have RK) than already identified sources. Their X-ray-to-optical flux ratios are . From these properties, we argue that the majority of these sources are Type-2 AGN. This is confirmed by our on-going optical spectroscopic survey which is showing that the bulk of these sources is at . Two X-ray bright optically “normal” galaxies are present in our sample. Their X-ray spectra are clearly absorbed suggesting the presence of an obscured AGN. We expect this class of objects to increase from the optical identification of the newly detected XMM-Newton sources.
Acknowledgements.
We thank Andrea Comastri, Roberto Gilli, Giorgio Matt and Paolo Tozzi for useful comments and discussions. We thank the referee, X. Barcons, for helpful comments that improved the manuscript. RDC acknowledge financial support from the Italian Space Agency, ASI (I/R/037/01), under the project ”Cosmologia Osservativa con XMM-Newton”.References
- (1) Akiyama, M., Ohta, K., Yamada, T., et al. 2000, ApJ, 532, 700
- (2) Alexander, D.M., Brandt, W.N., Hornschemeier, A.E., et al. 2001a, AJ, 122, 2156
- (3) Alexander, D.M., Vignali, C., Bauer, F.E., et al. 2001b, AJ, 123, 1149
- (4) Barger, A.J., Cowie, L.L., Mushotzky, R.F., & Richards, E.A. 2001, AJ, 121, 662
- (5) Bertin, E., & Arnouts, S. 1996, A&A Supplement, 117, 393
- (6) Bizenberger, P., McCaughrean, M.J., Birk, C., et al. 1998, in Omega Prime: the wide-field near-infrared camera for the 3.5 m telescope of the Calar Alto Observatory, ed. A.M. Fowler, Infrared astronomical instrumentation, SPIE 3354, 825
- (7) Brandt, W.N., Alexander, D.M., Hornschemeier, A.E., et al. 2001, AJ, 122, 2810
- (8) Brusa, M., Comastri, A., Daddi, E., et al. 2002, Proceedings of the Workshop ‘X-ray spectroscopy of AGN with Chandra and XMM-Newton’, MPE report, ed. Th. Boller, in press, astro-ph/0204251
- (9) Bruzual, G.A., & Charlot S. 1993, ApJ, 405, 538
- (10) Cimatti, A., Daddi, E., Mignoli, M., et al. 2002, A&A, 381, L68
- (11) Comastri, A., Setti, G, Zamorani, & G., Hasinger, G. 1995, A&A, 296, 1
- (12) Comastri, A., Brusa, M., Ciliegi, P., et al. 2002, Proceedings of the Symposium ‘New Visions of the X-ray Universe in the XMM-Newton and Chandra Era’, ESA SP-488, ed. F. Jansen, in press, astro-ph/0203019
- (13) Coleman, G.D., Wu, C.C., & Weedman, D.W. 1980, ApJS, 43, 393
- (14) Della Ceca, R., Castelli, G., Braito, V., et al. 1999a, ApJ, 524, 674
- (15) Della Ceca, R., Braito, V., Cagnoni, I., & Maccacaro, T., 1999b, Proceedings of the Conference “X-ray Astronomy’99: Stellar Endpoints, AGN and Diffuse Background”, 2001, American Institute of Physics, 599, 602
- (16) Fiore, F., Giommi, P., Vignali, C., et al. 2001, MNRAS, 327, 771
- (17) Giacconi, R., Rosati, P., Tozzi, P., et al. 2001 ApJ, 551 624
- (18) Gilli, R., Salvati, M., & Hasinger, G. 2001, A&A, 366, 407
- (19) Granato, G.L., Danese, & L., Franceschini, A. 1997, ApJ, 486, 147
- (20) Griffiths, R.E., Georgantopoulos, I., Boyle, B.J., Stewart, G.C., Shanks, T., & Della Ceca, R., 1995, MNRAS, 275, 77
- (21) Hasinger, G., Burg, R., Giacconi, R., et al. 1998, A&A, 329, 482
- (22) Hasinger, G., Lehmann, I., Giacconi, R., Schmidt, M., Trumper, J., & Zamorani, G. 1999 in Highlights in the X-ray Astronomy, eds. B. aschenbach & M.J.Freyberg, MPE Report 272, p 199 [astro-ph/9901103]
- (23) Hasinger, G., Altieri, B., Arnaud, M., et al. 2001, A&A 365, L45 (Paper I)
- (24) Hasinger, G. 2002, Proceedings of the Symposium ‘New Visions of the X-ray Universe in the XMM-Newton and Chandra Era’, ESA SP-488, ed. F. Jansen, in press, astro-ph/0202430
- (25) Hornschemeier, A.E., Brandt, W.N., Garmire, G.P., et al. 2001, ApJ, 554, 742
- (26) Lehmann, I., Hasinger, G., Schmidt, M., et al. 2000, A&A 354, 34
- (27) Lehmann, I., Hasinger, G., Schmidt, M., et al. 2001a, A&A, 371, 833
- (28) Lehmann, I., Hasinger, G., Murray, S.S., & Schmidt, M. 2001b, Proceedings for X-rays at Sharp Focus Chandra Science Symposium, in press
- (29) Lockman, F.J., Jahoda, K., & McCammon, D. 1986, ApJ, 302, 432
- (30) Mainieri, V., Bergeron, J., Rosati, P., et al. 2002, Proceedings of the Symposium ‘New Visions of the X-ray Universe in the XMM-Newton and Chandra Era’, ESA SP-488, ed. F. Jansen, in press, astro-ph/0202211
- (31) Maccacaro, T., Gioia, I.M., Wolter, A., et al. 1988, ApJ, 326, 680
- (32) Maiolino, R., Marconi, A., Salvati, M., et al. 2001a, A&A, 365, 28
- (33) Maiolino, R., Marconi, A., & Oliva, E. 2001b, A&A, 365, 37
- (34) Mittaz, J.P.D., Carrera, F.J., Romero-Colmenero, E., et al. 1999, MNRAS, 308, 233
- (35) Page, M.J., Mittaz, J.P.D., & Carrera, F.J. 2001, MNRAS, 325, 575
- (36) Reeves, J.N., & Turner, M.J.L. 2000, MNRAS, 316, 234
- (37) Risaliti, G., Marconi, A., Maiolino, R., et al. 2001, A&A, 371, 37
- (38) Rosati, P., Tozzi, P., Giacconi, R., et al. 2002, ApJ, 566, 667
- (39) Schmidt M., Hasinger G., Gunn J.E., et al. 1998, A&A, 329, 495
- (40) Tozzi, P., Rosati, P., Nonino, M., et al. 2001, ApJ, 562, 42
- (41) Vanden Berk, D.E., Richards G.T., Bauer A., et al. 2001, AJ, 122, 549
- (42) Veilleux, S., & Osterbrock, D.E. 1987, ApJS, 63, 295


| Table 2. X-ray catalogue | |||||||||||||||||
| XID | Rosat | Typea | RA | Dec | Off-axis | counts | Fluxb | Fluxb | Fluxb | R | K′ | R-K′ | z | LXe | LXe | ||
| anglef | [0.5-7] | [0.5-2] | [2-10] | [5-10] | [0.5-2] | [2-10] | |||||||||||
| 1 | 28 | 2 | 10 54 21.3 | +57 25 43 | 13.58 | 6071 | 11.06 | 20.31 | 9.30 | …. | …. | …. | 0.205 | 21.29 | 1.89 | 43.356 | 43.715 |
| 2 | 32 | 1 | 10 52 39.6 | +57 24 32 | 4.28 | 4440 | 5.87 | 6.02 | 2.97 | 17.9 | 16.1 | 1.8 | 1.113 | 0.00 | 2.49 | 44.911 | 44.745 |
| 3 | 6 | 1 | 10 53 16.8 | +57 35 52 | 8.40 | 3590 | 5.90 | 8.60 | 3.86 | 18.8 | 16.6 | 2.2 | 1.204 | 0.00 | 1.91 | 44.783 | 44.964 |
| 4 | 29 | 1 | 10 53 35.1 | +57 25 43 | 7.65 | 3164 | 4.73 | 6.45 | 2.62 | 19.5 | 17.2 | 2.3 | 0.784 | 0.00 | 2.02 | 44.276 | 44.366 |
| 5 | 8 | 5 | 10 51 30.9 | +57 34 39 | 11.30 | 1958 | 4.66 | 0.65 | 0.00 | …. | …. | …. | ….. | …… | …… | …… | …… |
| 6 | 16 | 1 | 10 53 39.7 | +57 31 05 | 7.95 | 1537 | 3.16 | 3.15 | 1.33 | 19.4 | 16.3 | 3.1 | 0.586 | 0.00 | 2.50 | 43.880 | 43.663 |
| 7 | 0 | 5 | 10 53 00.5 | +57 42 10 | 13.58 | 1271 | 3.58 | 0.00 | 0.00 | …. | …. | …. | ….. | …… | …… | …… | …… |
| 8 | 31 | 1 | 10 53 31.9 | +57 24 56 | 7.64 | 1208 | 1.84 | 2.21 | 1.16 | 20.5 | 17.7 | 2.8 | 1.956 | 0.00 | 1.93 | 44.882 | 45.088 |
| 9 | 232 | 5 | 10 53 36.3 | +57 38 01 | 11.67 | 962 | 2.42 | 0.00 | 0.00 | …. | …. | …. | ….. | …… | …… | …… | …… |
| 10 | 25 | 1 | 10 53 44.9 | +57 28 41 | 8.33 | 746 | 1.17 | 1.69 | 0.50 | 20.8 | 18.0 | 2.8 | 1.816 | 0.00 | 1.89 | 44.484 | 44.708 |
| 11 | 9 | 1 | 10 51 54.3 | +57 34 36 | 8.74 | 744 | 1.24 | 1.60 | 0.74 | 21.2 | 18.3 | 2.9 | 0.877 | 20.20 | 2.18 | 43.833 | 43.837 |
| 12 | 513 | 1 | 10 52 54.4 | +57 23 42 | 5.32 | 681 | 0.86 | 1.33 | 0.62 | 22.3 | 18.3 | 4.0 | 0.761 | 0.00 | 1.75 | 43.365 | 43.631 |
| 13 | 37 | 1 | 10 52 48.1 | +57 21 17 | 7.54 | 612 | 1.11 | 0.77 | 0.34 | 20.1 | 17.3 | 2.8 | 0.467 | 0.00 | 2.81 | 43.310 | 42.905 |
| 14 | 2 | 1 | 10 52 30.1 | +57 39 13 | 10.57 | 599 | 1.14 | 1.55 | 0.48 | …. | …. | …. | 1.437 | 21.03 | 2.03 | 44.127 | 44.352 |
| 15 | 12 | 2 | 10 51 48.6 | +57 32 47 | 8.32 | 570 | 0.41 | 3.29 | 2.17 | 22.9 | 18.0 | 4.9 | 0.990 | 23.50 | 2.02 | 42.922 | 44.239 |
| 16 | 77 | 1 | 10 52 59.1 | +57 30 29 | 2.75 | 516 | 0.62 | 1.15 | 0.70 | 22.1 | 18.8 | 3.3 | 1.676 | 0.00 | 1.56 | 44.100 | 44.528 |
| 17 | 0 | 9 | 10 54 07.1 | +57 35 27 | 13.09 | 511 | 1.35 | 1.44 | 0.63 | …. | …. | …. | ….. | 0.00 | 2.29 | …… | …… |
| 18 | 426 | 1 | 10 53 03.8 | +57 29 24 | 2.87 | 443 | 0.76 | 0.81 | 0.00 | 22.0 | 17.5 | 4.5 | 0.788 | 20.79 | 2.14 | 43.202 | 43.288 |
| 19 | 14 | 9 | 10 52 42.2 | +57 31 58 | 3.18 | 427 | 0.46 | 1.28 | 0.64 | 25.0 | 19.6 | 5.4 | 1.94 | 22.59 | 1.67 | 43.825 | 44.644 |
| 20 | 120 | 1 | 10 53 09.3 | +57 28 21 | 3.57 | 426 | 0.54 | 0.75 | 0.45 | 20.4 | 17.7 | 2.7 | 1.568 | 0.00 | 2.12 | 44.192 | 44.307 |
| 21 | 27 | 1 | 10 53 51.5 | +57 27 04 | 9.37 | 412 | 0.65 | 0.89 | 0.56 | 20.8 | 18.6 | 2.2 | 1.720 | 0.00 | 1.66 | 44.258 | 44.634 |
| 22 | 5 | 1 | 10 53 02.5 | +57 37 57 | 9.53 | 387 | 0.63 | 1.06 | 0.48 | 21.0 | 18.3 | 2.7 | 1.881 | 0.00 | 1.94 | 44.169 | 44.383 |
| 23 | 30 | 1 | 10 52 57.3 | +57 25 06 | 4.16 | 368 | 0.61 | 0.72 | 0.00 | 21.1 | 18.0 | 3.1 | 1.527 | 0.00 | 2.35 | 44.239 | 44.185 |
| 24 | 0 | 2 | 10 52 37.8 | +57 33 22 | 4.62 | 352 | 0.17 | 2.03 | 1.61 | 22.6 | 17.5 | 5.1 | 0.707 | 23.01 | 1.63 | 42.362 | 43.711 |
| 25 | 84 | 9 | 10 52 17.0 | +57 20 17 | 9.21 | 332 | 0.32 | 1.51 | 0.75 | 25.5 | 19.3 | 6.2 | 2.71 | 23.51 | 2.27 | …… | 44.903 |
| 26 | 117 | 2 | 10 53 48.6 | +57 30 35 | 8.99 | 321 | 0.34 | 1.27 | 1.02 | 22.9 | 19.5 | 3.4 | 0.780 | 22.27 | 1.50 | 42.327 | 43.572 |
| 27 | 45 | 2 | 10 53 19.2 | +57 18 52 | 11.06 | 287 | 0.47 | 0.52 | 0.00 | 21.2 | …. | …. | 0.711 | 20.32 | 1.77 | 43.018 | 43.284 |
| 28 | 23 | 1 | 10 52 24.6 | +57 30 10 | 2.83 | 286 | 0.35 | 0.64 | 0.00 | 22.4 | 18.0 | 4.4 | 1.009 | 20.94 | 1.95 | 43.248 | 43.485 |
| 29 | 13 | 1 | 10 52 13.1 | +57 32 22 | 5.36 | 277 | 0.39 | 0.50 | 0.00 | 22.0 | 19.5 | 2.5 | 1.872 | 20.73 | 1.81 | …… | 44.230 |
| 30 | 52 | 1 | 10 52 43.4 | +57 15 45 | 13.04 | 250 | 0.57 | 0.46 | 0.00 | …. | …. | …. | 2.144 | 0.00 | 2.29 | 44.555 | 44.552 |
| 31 | 104 | 2 | 10 52 41.3 | +57 36 50 | 8.05 | 224 | 0.28 | 0.81 | 0.49 | 18.8 | …. | …. | 0.137 | 22.26 | 1.95 | 41.209 | 41.862 |
| 32 | 491 | 9 | 10 52 25.3 | +57 25 50 | 3.79 | 216 | 0.16 | 0.72 | 0.49 | 24.6 | 18.3 | 6.3 | ….. | 22.04 | 2.17 | …… | …… |
| 33 | 123 | 9 | 10 51 28.3 | +57 27 37 | 10.11 | 209 | 0.16 | 1.24 | 0.60 | 23.6 | 20.0 | 3.6 | ….. | 22.15 | 1.90 | …… | …… |
| 34 | 80 | 1 | 10 51 44.6 | +57 28 07 | 7.87 | 207 | 0.30 | 0.45 | 0.00 | 21.2 | 19.2 | 2.0 | 3.409 | 21.08 | 1.75 | …… | 44.958 |
| 35 | 116 | 2 | 10 52 37.5 | +57 31 05 | 2.40 | 206 | 0.26 | 0.47 | 0.32 | 20.9 | 16.1 | 4.8 | 0.708 | 20.99 | 1.50 | 42.789 | 43.304 |
| 36 | 814 | 1 | 10 52 45.2 | +57 21 21 | 7.45 | 199 | 0.30 | 0.29 | 0.00 | 20.5 | 19.0 | 1.5 | 2.832 | 0.00 | 2.12 | 44.335 | 44.524 |
| 37 | 486 | 9 | 10 52 43.2 | +57 28 00 | 0.79 | 191 | 0.19 | 0.44 | 0.34 | 24.4 | 19.1 | 5.3 | 1.21 | 22.02 | 1.49 | 42.855 | 43.879 |
| 38 | 0 | 2 | 10 52 06.6 | +57 29 24 | 4.92 | 187 | 0.15 | 0.84 | 0.34 | 21.8 | 17.5 | 4.3 | 0.708 | 21.93 | 1.47 | …… | 43.072 |
| 39 | 0 | 9 | 10 54 04.5 | +57 20 36 | 13.72 | 179 | 0.44 | 0.00 | 0.00 | …. | …. | …. | ….. | 0.00 | 2.74 | …… | …… |
| 40 | 20 | 5 | 10 54 10.5 | +57 30 40 | 11.90 | 178 | 0.43 | 0.00 | 0.00 | …. | …. | …. | ….. | …… | …… | …… | …… |
| Table 2. (continued) | |||||||||||||||||
| XID | Rosat | Typea | RA | Dec | Off-axis | counts | Fluxb | Fluxb | Fluxb | R | K′ | R-K′ | z | LXe | LXe | ||
| anglef | [0.5-7] | [0.5-2] | [2-10] | [5-10] | [0.5-2] | [2-10] | |||||||||||
| 41 | 0 | 2 | 10 53 05.4 | +57 28 10 | 3.08 | 176 | 0.00 | 0.88 | 1.15 | 23.1 | 17.8 | 5.3 | 0.792 | 23.55 | 2.00 | 42.413 | 43.613 |
| 42 | 821 | 1 | 10 53 22.1 | +57 28 52 | 5.26 | 170 | 0.25 | 0.26 | 0.00 | 22.7 | 18.7 | 4.0 | 2.340 | 21.43 | 1.89 | 44.004 | 44.478 |
| 43 | 75 | 1 | 10 51 25.3 | +57 30 48 | 10.62 | 161 | 0.27 | 0.33 | 0.57 | 19.3 | 17.6 | 1.7 | 3.410 | 21.84 | 1.84 | …… | 45.000 |
| 44 | 477 | 1 | 10 53 05.6 | +57 34 25 | 6.39 | 159 | 0.22 | 0.26 | 0.00 | 20.3 | 18.4 | 1.9 | 2.949 | 0.00 | 2.21 | 44.439 | 44.651 |
| 45 | 430 | 9 | 10 53 15.3 | +57 26 30 | 4.91 | 158 | 0.14 | 0.64 | 0.00 | 24.3 | 19.0 | 5.3 | ….. | 21.95 | 1.75 | …… | …… |
| 46 | 0 | 1 | 10 52 36.7 | +57 34 02 | 5.31 | 149 | 0.14 | 0.52 | 0.42 | 24.2 | …. | …. | 0.164 | 21.85 | 1.51 | 41.020 | 41.831 |
| 47 | 0 | 9 | 10 53 48.1 | +57 28 16 | 8.77 | 148 | 0.18 | 0.42 | 0.00 | 25.5 | 18.5 | 7.0 | ….. | 21.88 | 1.83 | …… | …… |
| 48 | 607 | 9 | 10 52 20.2 | +57 23 06 | 6.46 | 147 | 0.19 | 0.28 | 0.00 | 24.1 | 19.8 | 4.3 | ….. | 20.52 | 1.91 | …… | …… |
| 49 | 0 | 9 | 10 51 11.8 | +57 26 35 | 12.47 | 142 | 0.25 | 0.36 | 0.00 | …. | …. | …. | ….. | 19.90 | 1.52 | …… | …… |
| 50 | 901 | 2 | 10 52 53.0 | +57 28 59 | 1.36 | 138 | 0.05 | 0.33 | 1.25 | 15.3 | 11.9 | 3.4 | 0.204 | 23.64 | 2.97 | 41.031 | 42.219 |
| 51 | 18 | 1 | 10 52 28.2 | +57 31 05 | 3.03 | 136 | 0.17 | 0.26 | 0.00 | 22.6 | 19.5 | 3.1 | 0.993 | 0.00 | 1.78 | 42.952 | 43.198 |
| 52 | 428 | 1 | 10 53 24.6 | +57 28 19 | 5.62 | 132 | 0.24 | 0.41 | 0.00 | 22.4 | 18.8 | 3.6 | 1.598 | 21.20 | 1.77 | 43.626 | 44.061 |
| 53 | 38 | 1 | 10 53 29.6 | +57 21 04 | 9.96 | 130 | 0.27 | 0.33 | 0.00 | 21.3 | …. | …. | 1.145 | 20.34 | 2.18 | 43.514 | 43.539 |
| 54 | 804 | 1 | 10 53 12.4 | +57 34 25 | 6.88 | 128 | 0.19 | 0.28 | 0.00 | 22.7 | 19.1 | 3.6 | 1.213 | 0.00 | 2.24 | 43.108 | 43.256 |
| 55 | 0 | 9 | 10 54 10.9 | +57 30 57 | 12.00 | 127 | 0.31 | 0.37 | 0.00 | …. | …. | …. | ….. | 19.92 | 2.34 | …… | …… |
| 56 | 0 | 2 | 10 52 51.6 | +57 32 00 | 3.41 | 125 | 0.16 | 0.28 | 0.00 | 21.3 | 16.8 | 4.5 | 0.664 | 21.41 | 1.81 | 42.538 | 42.996 |
| 57 | 36 | 1 | 10 52 25.7 | +57 23 02 | 6.22 | 125 | 0.22 | 0.27 | 0.00 | 22.5 | 18.6 | 3.9 | 1.524 | 21.34 | 2.56 | 43.604 | 43.640 |
| 58 | 802 | 5 | 10 52 21.9 | +57 37 34 | 9.22 | 123 | 0.28 | 0.00 | 0.00 | 15.9 | …. | …. | ….. | …… | …… | …… | …… |
| 59 | 54 | 1 | 10 53 07.7 | +57 15 05 | 14.11 | 122 | 0.21 | 0.28 | 0.00 | …. | …. | …. | 2.416 | 0.00 | 1.66 | 44.139 | 44.546 |
| 60 | 0 | 3 | 10 52 47.6 | +57 36 22 | 7.60 | 121 | 0.00 | 0.72 | 1.12 | 17.9 | …. | …. | 0.118 | 23.35 | 2.69 | 40.228 | 41.566 |
| 61 | 0 | 9 | 10 52 48.5 | +57 41 28 | 12.69 | 118 | 0.25 | 0.26 | 0.00 | …. | …. | …. | ….. | 20.51 | 2.08 | …… | …… |
| 62 | 0 | 9 | 10 53 01.8 | +57 15 00 | 14.03 | 113 | 0.18 | 0.28 | 0.00 | …. | …. | …. | ….. | 20.75 | 1.65 | …… | …… |
| 63 | 0 | 2 | 10 52 52.1 | +57 31 33 | 3.03 | 106 | 0.07 | 0.45 | 0.00 | 19.1 | 16.0 | 3.1 | ….. | 21.97 | 1.74 | …… | …… |
| 64 | 0 | 9 | 10 53 30.5 | +57 25 16 | 7.31 | 104 | 0.15 | 0.00 | 0.00 | 25.9 | 19.7 | 6.2 | ….. | 0.00 | 1.84 | …… | …… |
| 65 | 0 | 9 | 10 52 11.1 | +57 32 04 | 5.38 | 102 | 0.06 | 0.53 | 0.00 | 25.3 | 19.5 | 5.8 | ….. | 22.04 | 1.74 | …… | …… |
| 66 | 870 | 1 | 10 52 25.4 | +57 22 51 | 6.40 | 101 | 0.18 | 0.00 | 0.00 | 21.3 | 17.8 | 3.5 | 0.807 | 0.00 | 2.25 | 42.701 | 42.663 |
| 67 | 34 | 4 | 10 52 58.2 | +57 23 56 | 5.27 | 100 | 0.17 | 0.25 | 0.00 | 26.6 | …. | …. | 0.340 | …… | …… | 42.173 | 42.546 |
| 68 | 128 | 4 | 10 53 50.8 | +57 25 13 | 9.81 | 98 | 0.21 | 0.27 | 0.00 | 19.9 | …. | …. | 0.033 | …… | …… | 39.754 | 39.902 |
| 69 | 634 | 1 | 10 53 11.6 | +57 23 08 | 6.86 | 97 | 0.13 | 0.23 | 0.00 | 23.2 | …. | …. | 1.544 | 0.00 | 1.43 | …… | 43.715 |
| 70 | 0 | 9 | 10 53 15.5 | +57 24 51 | 5.90 | 95 | 0.04 | 0.53 | 0.00 | 24.5 | 19.4 | 5.1 | ….. | 22.12 | 1.77 | …… | …… |
| 71 | 82 | 1 | 10 53 12.3 | +57 25 06 | 5.41 | 94 | 0.14 | 0.00 | 0.00 | 22.8 | 19.0 | 3.8 | 0.960 | 0.00 | 1.64 | 43.022 | 43.471 |
| 72 | 0 | 9 | 10 52 31.8 | +57 24 30 | 4.55 | 94 | 0.00 | 0.49 | 0.34 | 24.1 | 19.6 | 4.5 | ….. | …… | …… | …… | …… |
| 73 | 19 | 1 | 10 51 37.3 | +57 30 42 | 9.02 | 92 | 0.13 | 0.34 | 0.00 | 22.2 | 19.0 | 3.2 | 0.894 | 20.20 | 1.68 | 42.521 | 42.843 |
| 74 | 0 | 9 | 10 52 43.4 | +57 35 46 | 6.97 | 91 | 0.14 | 0.00 | 0.00 | …. | …. | …. | ….. | 0.00 | 1.66 | …… | …… |
| 75 | 0 | 9 | 10 51 46.6 | +57 30 35 | 7.78 | 91 | 0.18 | 0.00 | 0.00 | 25.6 | 19.2 | 6.4 | ….. | 0.00 | 1.96 | …… | …… |
| 76 | 0 | 9 | 10 51 55.3 | +57 29 34 | 6.45 | 90 | 0.12 | 0.00 | 0.00 | 24.7 | 20.4 | 4.3 | ….. | 0.00 | 1.63 | …… | …… |
| 77 | 0 | 9 | 10 53 47.1 | +57 33 51 | 9.98 | 90 | 0.21 | 0.00 | 0.00 | …. | …. | …. | ….. | 0.00 | 1.91 | …… | …… |
| 78 | 861 | 1 | 10 53 58.3 | +57 29 23 | 10.14 | 89 | 0.15 | 0.00 | 0.00 | 22.5 | …. | …. | 1.843 | 0.00 | 1.84 | 43.725 | 44.007 |
| 79 | 228 | 4 | 10 53 39.8 | +57 35 18 | 10.01 | 88 | 0.20 | 0.42 | 0.00 | 22.8 | 17.2 | 5.6 | 1.250 | …… | …… | 43.843 | 44.022 |
| 80 | 0 | 9 | 10 52 07.2 | +57 34 12 | 7.23 | 87 | 0.12 | 0.27 | 0.00 | 23.1 | …. | …. | ….. | …… | …… | …… | …… |
| Table 2. (continued) | |||||||||||||||||
| XID | Rosat | Typea | RA | Dec | Off-axis | counts | Fluxb | Fluxb | Fluxb | R | K′ | R-K′ | z | LXe | LXe | ||
| anglef | [0.5-7] | [0.5-2] | [2-10] | [5-10] | [0.5-2] | [2-10] | |||||||||||
| 81 | 0 | 9 | 10 52 54.8 | +57 31 51 | 3.44 | 87 | 0.08 | 0.28 | 0.33 | 22.9 | …. | …. | ….. | 21.71 | 1.22 | …… | …… |
| 82 | 0 | 9 | 10 52 37.0 | +57 16 03 | 12.77 | 86 | 0.15 | 0.00 | 0.00 | …. | …. | …. | ….. | 0.00 | 1.98 | …… | …… |
| 83 | 0 | 9 | 10 53 30.9 | +57 39 23 | 12.39 | 81 | 0.00 | 0.64 | 0.61 | …. | …. | …. | ….. | 22.04 | 1.10 | …… | …… |
| 84 | 0 | 2 | 10 51 50.1 | +57 25 21 | 7.90 | 80 | 0.07 | 0.34 | 0.00 | 21.8 | 17.4 | 4.4 | 0.676 | 21.97 | 1.42 | 41.890 | 42.901 |
| 85 | 0 | 9 | 10 53 21.4 | +57 31 48 | 5.98 | 78 | 0.10 | 0.27 | 0.00 | 25.5 | 19.3 | 6.2 | ….. | 21.53 | 2.42 | …… | …… |
| 86 | 0 | 9 | 10 53 46.9 | +57 26 06 | 9.01 | 75 | 0.10 | 0.00 | 0.39 | 23.2 | 19.6 | 3.6 | ….. | 0.00 | 2.00 | …… | …… |
| 87 | 0 | 9 | 10 52 23.8 | +57 25 32 | 4.16 | 75 | 0.09 | 0.00 | 0.00 | 24.7 | 19.6 | 5.1 | ….. | 0.00 | 1.63 | …… | …… |
| 88 | 41 | 4 | 10 53 19.0 | +57 20 48 | 9.36 | 73 | 0.15 | 0.00 | 0.00 | 17.5 | …. | …. | 0.340 | …… | …… | 42.336 | 42.279 |
| 89 | 0 | 9 | 10 52 42.3 | +57 29 11 | 0.41 | 73 | 0.08 | 0.20 | 0.00 | 24.0 | 19.8 | 4.2 | ….. | 19.60 | 1.06 | …… | …… |
| 90 | 33 | 1 | 10 52 00.3 | +57 24 20 | 7.27 | 73 | 0.07 | 0.20 | 0.32 | 22.2 | 19.4 | 2.8 | 0.974 | 0.00 | 0.67 | 42.309 | 43.115 |
| 91 | 0 | 9 | 10 51 20.6 | +57 26 59 | 11.22 | 73 | 0.12 | 0.00 | 0.00 | …. | …. | …. | ….. | …… | …… | …… | …… |
| 92 | 0 | 3 | 10 52 58.6 | +57 33 35 | 5.24 | 72 | 0.10 | 0.00 | 0.00 | 24.3 | 19.0 | 5.3 | 0.417 | 20.97 | 1.61 | 41.853 | 42.282 |
| 93 | 21 | 9 | 10 51 55.1 | +57 30 43 | 6.70 | 72 | 0.09 | 0.00 | 0.00 | 24.2 | 20.1 | 4.1 | ….. | 0.00 | 1.89 | …… | …… |
| 94 | 434 | 2 | 10 52 58.4 | +57 22 51 | 6.30 | 71 | 0.13 | 0.00 | 0.00 | 22.2 | 18.0 | 4.2 | 0.762 | 21.36 | 2.12 | 42.862 | 43.123 |
| 95 | 0 | 9 | 10 52 31.5 | +57 25 03 | 4.05 | 71 | 0.00 | 0.23 | 0.38 | 24.8 | 19.8 | 5.0 | ….. | 22.28 | 1.13 | …… | …… |
| 96 | 39 | 1 | 10 52 09.7 | +57 21 04 | 8.94 | 71 | 0.14 | 0.00 | 0.00 | 21.7 | 20.6 | 1.1 | 3.281 | 22.69 | 2.55 | …… | 44.472 |
| 97 | 108 | 2 | 10 52 27.8 | +57 33 30 | 5.14 | 71 | 0.09 | 0.00 | 0.00 | 22.1 | 18.4 | 3.7 | 0.696 | 21.08 | 1.36 | 42.097 | 42.719 |
| 98 | 0 | 9 | 10 52 41.5 | +57 30 39 | 1.88 | 70 | 0.07 | 0.00 | 0.00 | 25.5 | 20.3 | 5.2 | ….. | 0.00 | 1.46 | …… | …… |
| a Optical classification: 1=Type1 AGN, 2=Type2 AGN, 3= galaxy, 4=group/cluster, 5=star, 9=unidentified source | |||||||||||||||||
| b In units of erg s-1. | |||||||||||||||||
| c Intrinsic absorption in excess to the Galactic ones ( ) and 90 confidence range. | |||||||||||||||||
| d Spectral Index and confidence range. | |||||||||||||||||
| e Log of observed luminosity in the rest-frame band, in units of erg s-1. | |||||||||||||||||
| f In arcmin. | |||||||||||||||||
| g Photometric redshifts (see Lehmann et al. 2001a ). | |||||||||||||||||