Abstract
We discuss Chandra results related to 1) cluster mergers and cold fronts and 2) interactions between relativistic plasma and hot cluster atmospheres. We describe the properties of cold fronts using NGC1404 in the Fornax cluster and A3667 as examples. We discuss multiple surface brightness discontinuities in the cooling flow cluster ZW3146. We review the supersonic merger underway in CL0657. Finally, we summarize the interaction between plasma bubbles produced by AGN and hot gas using M87 and NGC507 as examples.
Galaxy Clusters with Chandra111Contribution to XIII Rencontres de Blois 2001, ed. L. M. Celnikier
1) Smithsonian Astrophysical Observatory, Cambridge, MA, USA
2) MPI fur Astrophysik, Garching, Germany
3) Space Research Institute, Moscow, Russia
0.1 Cluster Formation at High Angular Resolution
For many years clusters were thought to be dynamically relaxed systems evolving slowly after an initial, short-lived episode of violent relaxation. However, while the dynamical timescale for the richest cluster cores is comfortably less than the Hubble time, other less dense clusters have dynamical timescales comparable to or longer than the age of the Universe [21]. X-ray images, starting with Einstein and continuing with ROSAT and ASCA, and now with Chandra and XMM-Newton, provide a powerful technique to “map” the structure in the gravitational potential of massive systems containing hot gaseous atmospheres.
The X-ray observations supported the now prevalent idea that structure in the Universe has grown through gravitational amplification of small scale instabilities or hierarchical clustering. At one extreme, some clusters grow, in their final phase, through mergers of nearly equal mass components. Such mergers can be spectacular events involving kinetic energies as large as ergs, the most energetic events since the Big Bang. More common are smaller mergers and accretion of material from large scale filaments. The ROSAT image of A85 shows the relationship between large scale structure and cluster merging where small groups are detected infalling along a filament into the main cluster [10]. Chandra and XMM with high angular resolution and high throughput provide new insights into cluster formation and evolution.
Cluster Cold Fronts
Prior to the launch of Chandra, sharp gas density discontinuities had been observed in the ROSAT images of A2142 and A3667 [26]. Since both clusters exhibited characteristics of major mergers, these features were expected to be shock fronts. However, the first Chandra observations showed that these were not shocks, but a new kind of structure – cold fronts [25]. Their study has provided new and detailed insights into the physics of the intracluster medium (ICM) [37, 38].
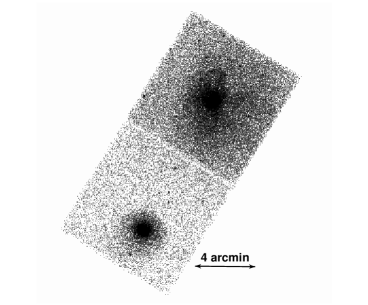
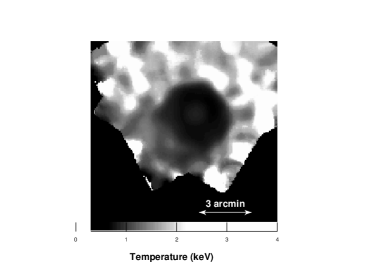
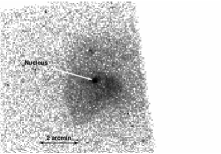
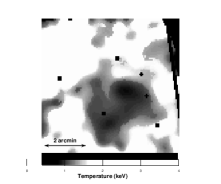
Fig. 1a shows a striking example of a cold front as NGC1404 and its gaseous corona approaches the cluster center (to the northwest) [9]. The image clearly shows the sharp edge of the surface brightness discontinuity, shaped by the ram pressure of the cluster gas. The temperature map (Fig. 1b) confirms that the infalling cloud is cold compared to the hotter Fornax ICM.
Physics of Cold Fronts
The best studied cold front is that in A3667 (). Although expected to exhibit a shock front based on its ROSAT image [26], the sharp feature observed in the Chandra observation is the boundary of a dense cold cloud, a merger remnant [37, 38]. The surface brightness profile, converted to gas density, and the gas temperature distribution yield the gas pressure on both sides of the cold front. The difference between the two pressures is a measure of the ram pressure of the ICM on the moving cold front. Hence, the precise measurement of the gas parameters yields the cloud velocity. The factor of two difference in pressures between the free streaming region and the region immediately inside the cold front yields a Mach number of the cloud of ( km s-1) [37].
In addition to the edge, a weak shock is detected. The distance between the cold front and the weak shock ( kpc) and the observed gas density jump at the shock (a factor of 1.1-1.2) yield the shock’s propagation velocity, km s-1, which is consistent with that derived independently from the pressure jump across the cold front [37].
The A3667 observation provides important information on the efficiency of transport processes in clusters. As the surface brightness profile shows (see [37]), the density “edge” is very sharp. Quantitatively, Vikhlinin et al. found that the width of the front was less than (5 kpc). This sharp edge requires that transport processes across the edge be suppressed, presumably by magnetic fields. Without such suppression, the edge should be broader since the electron Coulomb mean free path is about 13 kpc, several times the width of the cold front [37]. Furthermore, Vikhlinin et al. observed that the cold front appears sharp only over a sector of about centered on the direction of motion, while at larger angles, the sharp boundary disappears [38]. The disappearance can be explained by the onset of Kelvin-Helmholtz instabilities, as the ambient ICM gas flows past the moving cold front. To explain the observed extent of the sharp boundary, the instability must be partially suppressed, e.g., by a magnetic field parallel to the boundary with a strength of G with a corresponding pressure of only 10-20% of the thermal pressure [38].
ZW3146 – Multiple “Fronts”
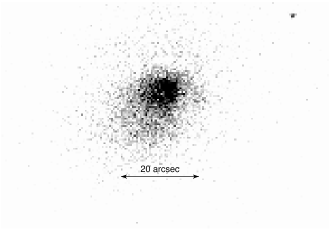
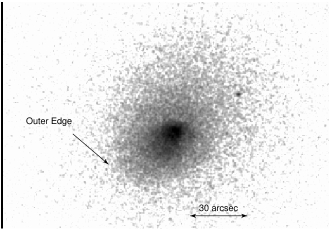
ZW3146 is a moderately distant (; 5.74 kpc per arcsec) cluster with a remarkably high mass deposition rate that was estimated to exceed 1000 M⊙ yr-1 [11]. The Chandra image further demonstrates the remarkable nature of this cluster – on scales from to ( kpc to 170 kpc), three separate X-ray surface brightness edges are detected (see Fig. 2 and Forman et al. [16]). At the smallest radii, two edges are seen to the northwest and north of the center (see Fig.2a). The first, at a radius of (17 kpc), spans an angle of nearly with a surface brightness drop of almost a factor of 2. The second edge, at a radius of (45 kpc) spans only but has a surface brightness drop of almost a factor of 4. The third edge (see Fig. 2b) lies to the southeast, about (200 kpc) from the cluster center, has a decrease of about a factor of 2, and, as with the first edge, extends over an angle of almost .
The variety of morphologies and scales exhibited by these sharp edges or cold fronts is quite remarkable. Possibly the edges may arise from moving cold gas clouds that are the remnants of merger activity as observed in A2142 and A3667 or as oscillations (or “sloshing”) of the cool gas at the center of the cluster potential as observed in A1795 [27]. The extremely regular morphology of ZW3146 on large linear scales seems to exclude a recent merger and, hence, “sloshing” of the gas seems the more likely explanation for the observed edges. High resolution, large scale structure simulations show that dense halos, formed at very early epochs, survive cluster collapse [19, 20]. While most of the dark matter halos, having galaxy size masses, are associated with the sites of galaxy formation, the larger mass halos also may survive (without their gas) or may have fallen into the cluster only recently. Hence, we might expect to find a range of halo mass distributions moving within the cluster potential. We speculate that, as these halos move, the varying gravitational potential could accelerate the cool dense gas that has accumulated in the cluster core and could produce the “sloshing” needed to give rise to the multiple surface brightness edges observed in some clusters.
CL0657 – A Prototypical Cluster Shock Front
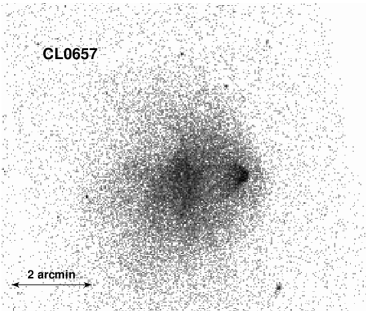
CL0657 () was discovered by Tucker et al. as part of a search for “failed” clusters, clusters that were X-ray bright but had few, if any, optical galaxies [35]. From ASCA observations, this cluster was found to have a remarkably hot gas temperature of about 17 keV, making it the hottest cluster known [36].
The Chandra image of CL0657 shows the classic properties of a supersonic merger (see Markevitch et al. for a detailed discussion of this cluster [28]). We see a dense (cold) core moving to the west after having traversed, and disrupted, the core of the main cluster. Leading the cold, dense core is a density discontinuity which appears as a shock front (Mach cone). The spectral data show that the gas to the east (trailing the shock) has been heated by the passage of the shock. The detailed gas density parameters confirm that the “bullet” is moving to the west with a velocity of 3000–4000 km sec-1, approximately 2-3 times the sound speed of the ambient gas. CL0657 is the first clear example of a relatively strong shock arising from cluster mergers.
0.2 The Radio—X-ray Connection – or Bubbles, Bubbles Everywhere
Prior to the launch of Chandra, ROSAT observations of NGC1275 and M87 provided hints of complex interactions between radio emitting plasmas ejected from AGN within the nuclei of dominant, central cluster galaxies [2, 3, 6, 7]. With the launch of Chandra, the interaction between relativistic plasma, with and without detected radio emission, and the hot intracluster medium (ICM) has been observed in many systems and is now a major area of investigation [12, 31, 13, 14, 39, 30, 23, 33, 32].
M87 and the Evolution of Buoyant Plasma Bubbles
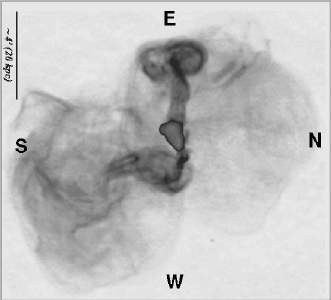
The 327 MHz high resolution, high dynamic range radio map (see Fig. 4) of M87 shows a well-defined torus-like eastern bubble and a less well-defined western bubble, both of which are connected to the central emission by a column, and two very faint almost circular emission regions northeast and southwest of the center [34]. The correlation between X–ray and radio emitting features has been remarked by several authors [15, 3, 22].
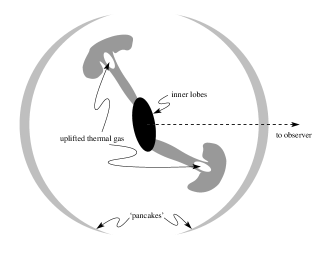
Motivated by the similarity in appearance between M87 and hot bubbles rising in a gaseous atmosphere, Churazov et al. developed a simple model of the M87 bubbles which is generally applicable to the many bubble-like systems seen in the Chandra observations [7]. Fig. 5 shows an initially buoyant bubble transform into a torus as it rises through a galaxy or cluster atmosphere.
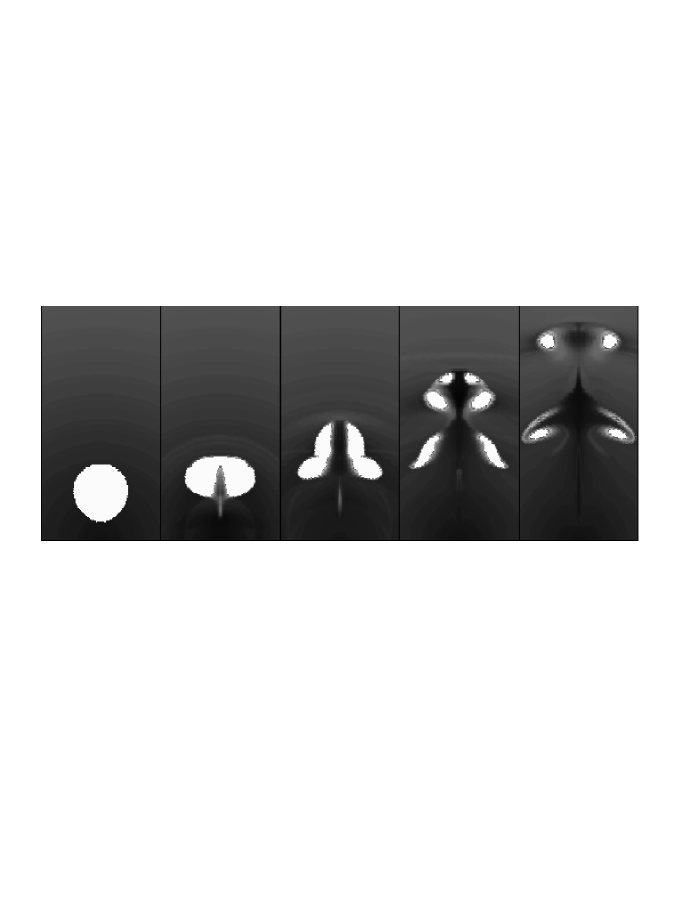
By entraining cool gas as it rises, the bubble produces a characteristic “mushroom” appearance, similar to an atmospheric nuclear explosion. This qualitatively explains the correlation of the radio and X–ray emitting plasmas and naturally accounts for the thermal nature of the X-ray emission associated with the rising torus [3, 4, 1]. Finally, in the last evolutionary phase, the bubble reaches a height at which the ambient gas density equals that of the bubble. The bubble then expands to form a thin layer (a “pancake”). The large low surface brightness features in the M87 radio map could be just such pancakes. In the simulations performed by Churazov et al. the buoyant bubbles behaved as expected and did produce the features observed in both X-rays and radio for M87. Although the exact form of the rising bubbles was sensitive to initial conditions, the toroidal structures were a common feature. Ambient gas was uplifted in the cluster atmosphere reducing the effects of cooling flows and producing the “stem” of the mushroom that is brighter than the surrounding regions [7]. Note that the XMM-Newton observation shows that the bright X-ray columns are cool, exactly as expected in the buoyant bubble scenario [1]. A sketch of the overall source structure of M87, based on the evolution of buoyant bubbles, is shown in Fig. 4 [7].
NGC507 - the central galaxy in a group
NGC507 is the central galaxy in a nearby () group that has been studied extensively in X-rays [24, 29, 5, 18]. The galaxy is the site of a weak B2 radio source (luminosity ergs s-1) [8]. The Chandra X-ray image, shown in Fig. 6a, covers only the central, high surface brightness emission of the group around NGC507. The 0.5-2.0 keV surface brightness distribution shows sharp edges to the southwest, southeast and north, reminiscent of those in the clusters A2142 and A3667. In addition to the edges, there are two X-ray peaks. The first, to the east, coincides with the nucleus of NGC507. A second peak, to the west has no optical counterpart. However, comparing the X-ray and the radio map (Fig. 6a, c) shows that the western radio lobe lies precisely in the surface brightness trough between the nucleus and the peak to the west. Thus, it seems likely that the radio lobe, probably a buoyant bubble, has displaced X-ray emitting gas generating a trough in the X-ray surface brightness distribution.
The origin of the peculiar sharp surface brightness discontinuities around NGC507 is unclear. The bright emission is well fit by a thermal model with gas temperatures near 1 keV, consistent with the mean ASCA temperature of keV [29]. Detailed spectroscopic analyses were complicated by unexpected high background at high energies. A second Chandra observation is planned to allow detailed spectroscopy. The emission from the central region is resolved and hence the contribution from a central AGN is relatively small (see Forman et al. [16] for additional discussion of NGC507). Perhaps the X-ray surface brightness features arise either from motion of NGC507 and its dark halo within the larger group potential as suggested for the multiple edges in clusters [27].
0.3 Conclusions
We did not expect the rich variety of new structures seen in the Chandra high angular resolution observations of clusters and early type galaxies. Instead of confirming our prejudices, Chandra has brought us a wealth of new information on the interaction of radio sources with the hot gas in both galaxy and cluster atmospheres. We see “edges” in many systems with hot and cold gas in close proximity and have been able to extract important new parameters of the ICM. We have only barely begun to digest the import of the Chandra cluster and galaxy observations. We can only expect the unexpected as Chandra observations continue and as our understanding of how best to use this new observatory matures.
We acknowledge support from NASA contract NAS8 39073, NASA grants NAG5-3065 and NAG5-6749 and the Smithsonian Institution.
Note Added on ZW3146
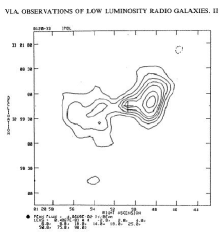
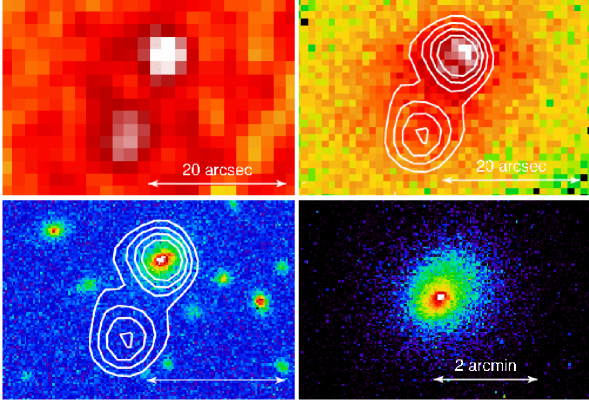
One of the puzzles relating to the X-ray observation of ZW3146 was the apparent misalignment by a few arcseconds between the X-ray brightness peak and the optical center of the central, dominant cD galaxy. The solution to this apparent misalignment was resolved by the FIRST radio image which shows two radio sources with flux densities of mJy separated by (see Fig. 7a). As Fig. 7b shows, the northern component of the pair of radio sources is precisely aligned with the optical cD galaxy at the cluster center. Fig. 7c shows that the radio source, and therefore the center of the cD galaxy, lies at the approximate center of irregular X-ray features. The bright X-ray structure northwest of the cD is elongated perpendicular to the direction to the galaxy center. A second X-ray bright feature lies southeast of the radio peak. We suggest that the radio emitting plasma formed a bubble that produced a trough in the X-ray surface brightness at the galaxy center. The bubble is surrounded by an irregular shell of X-ray emission. Thus, the brightest X-ray structures do not lie at the galaxy center, but instead form a partial shell surrounding the radio emitting plasma [17]. Such structures are similar to the X-ray surface brightness enhancements seen around radio plasma bubbles in nearby galaxies e.g., M84 [14].
Bibliography
- [1] Belsole et al.: A&A, 365, L188 (2001)
- [2] H. Bohringer et al.: MNRAS 264, L25 (1993)
- [3] H. Bohringer, P. Nulsen, R. Braun, A. Fabian: MNRAS 274, L67 (1995)
- [4] Bohringer et al.: A&A, 365, L181 (2001)
- [5] D. Buote & A. Fabian: MNRAS, 296, 977 (1998)
- [6] E. Churazov, W. Forman, C. Jones, H. Bohringer: A&A, 356, 788 (2000)
- [7] E. Churazov et al.: ApJ 554, 261 (2001)
- [8] H. R. de Ruiter, P. Parma, P., C. Fanti, R. Fanti: A&AS, 65, 111 (1986)
- [9] A. Dosaj, C. Jones, W. Forman, M. Markevitch, A. Vikhlinin: AAS Meeting Phoenix, 43.17, (2002)
- [10] F. Durret, F. et al.: A&A, 335, 41 (1998)
- [11] A. Edge et al.: MNRAS, 270, L1 (1994)
- [12] A. Fabian et al.: MNRAS 318, L65 (2000)
- [13] A. C. Fabian, A. Celotti, K.M. Blundell, N.E. Kassim, R.A. Perley: MNRAS in press, astro-ph/0111418 (2001)
- [14] A. Finoguenov, C. Jones: ApJL 547, L107 (2001)
- [15] E. Feigelson, P. Wood, E. Schreier, D. Harris, M. Reid: ApJ 312, 101 (1987)
- [16] W. Forman, M. Markevitch, C. Jones, A. Vikhlinin, E. Churazov, astro-ph/0110087 (2001)
- [17] W. Forman et al.: ApJ (2002)
- [18] Y. Fukazawa: PASJ, 50, 187 (1998)
- [19] S. Ghigna, B. Moore, F. Governato, G. Lake, T. Guinn, J. Stadel: MNRAS, 300, 146 (1998)
- [20] S. Ghigna, B. Moore, F. Governato, G. Lake, T. Guinn, J. Stadel: ApJ, 544, 616 (2000)
- [21] J. Gunn, & R. Gott: ApJ 176, 1 (1972)
- [22] D. Harris, F. N. Owen, J. A. Biretta, W. Junor: Diffuse Thermal and Relativistic Plasma in Galaxy Clusters eds. H. Böhringer, L.Feretti, P. Schuecker, MPE Report 271, 111 (1999)
- [23] C. Jones et al. ApJL in press, astro-ph/0108114 (2001)
- [24] D. Kim & G. Fabbiano: ApJ 441, 182 (1995)
- [25] M. Markevitch et al.: ApJ 541, 542 (2000)
- [26] M. Markevitch, C. Sarazin, A. Vikhlinin: ApJ 521, 526 (1999)
- [27] M. Markevitch, A. Vikhlinin, P. Mazzotta: ApJL 562, L153 (2001)
- [28] M. Markevitch et al.: ApJL in press, astro-ph/0110468 (2001)
- [29] H. Matsumoto et al.: ApJ 482, 133 (1997)
- [30] P. Mazzotta et al.: ApJL in press, astro-ph/0107557 (2001)
- [31] B. McNamara et al.: ApJL 534, 135 (2000)
- [32] B. McNamara et al.: ApJ in press, astro-ph/0110554 (2001)
- [33] P. Nulsen et al. ApJ in press, astro-ph/0110523 (2001)
- [34] F. Owen, J. Eilek, N. Kassim: ApJ 543, 611 (2000)
- [35] W. Tucker, H. Tananbaum, & R. Remillard: ApJ 444, 532 (1995)
- [36] W. Tucker et al.: ApJ 496, L5 (1998)
- [37] A. Vikhlinin, M. Markevitch, S. Murray: ApJ 551 160 (2000a)
- [38] A. Vikhlinin, M. Markevitch, S. Murray: ApJ 549, L47 (2000b)
- [39] J. Vrtilek et al. , in preparation and IAP 2000 Workshop (2001)