The Equatorial Outflow of SS433
Abstract
We present VLBI imaging results for SS433 from the period 1995–2000. An equatorial emission region is detected and confirmed in 7 experiments at 1.6 and 5 GHz. The structure of the region changes with time on scales of weeks to months. The nature of emission is unknown, but it is certainly non-thermal, maybe optically thin synchrotron. The spectrum however might be attenuated by a thermal population of electrons. There were previous indications for an equatorial outflow from the system. We do detect outward motion of a radio component, and estimate a speed of 1200/sin() km/s. Theoretical work and IR observations suggest that the mass-loss rate in SS433 is much higher in this region than in the jets. We suggest that the high-mass microquasars might all have equatorial outflows; in fact, it is the dominant form of mass-loss in these systems.
1 Introduction
Microquasars are Galactic X-ray binary systems harbouring a compact object (neutron star or black hole). They produce well collimated, relativistic jets in which energetic electrons are radiating via the synchrotron process. SS433 is the brightest permanent radio source of this class. Its precessing jets were first identified from the Doppler-shifted optical “moving” lines (Margon & Anderson [1989]), and subsequently imaged by MERLIN, VLA, and the EVN. In the 90s VLBI arrays became more sensitive, and their resolution and imaging fidelity improved significantly. This enabled us to study the SS433 radio beams at a level of unprecedented details.
The results presented here were observed in nine experiments, listed in Table 1. The paper briefly summarizes this work, focusing on the equatorial emission region, that is related to an outflow perpendicular to the well studied jets (Paragi et al. [1998],[1999]).
| Date of obs. | VLBI Array | Freq. [GHz] |
|---|---|---|
| 6 May 1995 | VLBA+Y1a | 1.6, 5, 15 |
| 26 March 1998 | VLBA+Y1 | 5, 8.4, 15, 22 |
| 18 April 1998 | VLBA+Y1 | 5, 8.4, 15, 22 |
| 22 May 1998 | VLBA+Y1 | 5, 8.4, 15, 22 |
| 6 June 1998 | EVN+MERLIN | 1.6 |
| +VLBA+Y1 | ||
| 16 June 1998 | VLBA+Y1 | 5, 8.4, 15, 22 |
| 13 Feb. 2000 | EVN+HartRAO+VLBA | 1.6 |
| 20 Feb. 2000 | EVN+HartRAO+VLBA | 1.6 |
| 27 May 2000 | EVN+HartRAO+VLBA | 1.6 |
-
a
a single element of the VLA


2 The Equatorial Emission Region
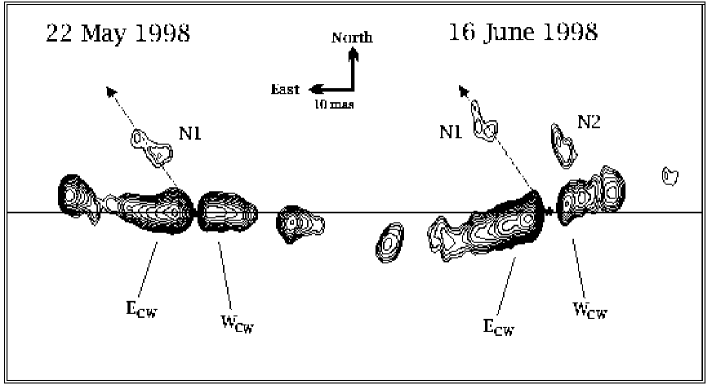
The SS433 jets have been studied for two decades. Their kinematic modell is very well established by optical and radio observations. However our data from 1995 observations showed two emission regions quasi-perpendicular to the beams. The emission was clearly identified at 1.6 GHz, and even at 5 GHz (apparent when convolving with the beam of the L-band image or larger). The spectral index of the emission was remarkably steep (). The follow-up global VLBI experiment in 1998 fully confirmed the existence of equatorial radio components with a similar disposition, but at a different distance from the centre and at a slightly different position angle (see Fig. 1). The emission spans about 100 mas, corresponding to several hundreds of Astronomical Units (1 mas=5 AU at a distance of 5 kpc). A brightness temperature of K is determined that is indicative of non-thermal emission (Paragi et al. [2001a, 2001b]).
3 Indications for outflow
Observations in other wavebands indicated the presence of an equatorial outflow in the system. Zwitter et al. ([1991]) invoked a disk-like outflow to explain the assymetric optical lightcurve, while Kotani et al. ([1996]) suggested a sprinkling disk in order to explain the X-ray line ratios of Fe xxv K red- and blueshifted lines. At the same time Chakrabarti and Matsuda ([1992]) showed by numerical simulations that a significant fraction of the accreted matter in SS433 may leave the system through the L2 Lagrangian point (for more details see Paragi et al. [1999], and references therein).
Recent work by King et al. ([2000]) indicates that SS433 can only avoid a common envelope evolutionary phase (i.e. no binary system, no jets) if most of the accreted matter is expelled by a high radiation pressure. This scenario invokes a massive equatorial outflow with a mass-loss rate of about M⊙/yr. Apart from the direct detection in the radio regime (Paragi et al. [1999]), there is other recent observational evidence supporting this idea. Gies et al. ([2001]) studied the UV spectrum with the Hubble Space Telescope. They detect H and He i stationary emission lines, sometimes showing P-Cygni profile. These lines originate in an expanding thick disk, embedding the central binary system. Fuchs et al. (in press) analyzed IR spectra of the source. They also invoke an expanding disk-wind scenario, and fit a 150 K free-free component to the spectrum (the IR emission certainly comes from a larger volume than the UV line emission). The estimated outflow rate is in the order of M⊙/yr. These results draw our attention to the fact that the mass-loss rate is about 100 times larger than what we observe in the radio beams!
4 Direct detection of the outflow?
In 1998 at two epochs of our multi-frequency VLBA monitoring of SS433, we identified component N1 at 5 GHz (Fig. 2), at 1.6 GHz detected as a bright region North to the centre (see Fig. 1b). Our higher resolution at 5 GHz enables us to trace the apparent motion of N1 from the central region. We estimate a motion of 1200/sin() km/s, where is the inclination of the velocity vector of N1 to the line of sight. Although this speed is fairly consistent with an early type stellar wind, and similar speeds have been reported in SS433 (Panferov & Fabrika [1997]), we are not yet fully convinced that this structural change really represents bulk motion of the outflow. Note that we could not find high velocity H i gas in the system with the Westerbork Synthesis Telescope. Note that on Fig 2b a new component (N2) appeared at a different position angle.
Observations in 2000 do not allow an accurate proper motion estimate, but clearly confirm outward motion from the centre (Fig. 3). At the first two epochs we see roughly the same structure — much smoother emission than in previous experiments. At the third epoch a new component appears, very close to the centre. So new components always show up close to the central region. It seems that the appearance of these features is related to the precessional cycle, and they move away from the central engine on a timescale of weeks/months.
5 Nature of emission
Blundell et al. ([2001]) recently confirmed the existence of the equatorial emission. They have observed a smooth structure with a global VLBI array of VLBA, MERLIN, and the phased VLA at 1.6 and 5 GHz. The spectral index of the region at the epoch of observation was flat. As we have shown above, the appearance of the emission is changing with time: sometimes it is blob-like, another time it is smoother. An interesting new result of their experiment is that the spectral index also changes. Blundell et al. explain the flat spectral index with thermal free-free emission. Because there is no other observational support for this idea (e.g. X-rays coming from the region), and because it is difficult to explain how the ISM could be heated up to K on hundreds of AU scales, we consider this scenario to be unlikely. In fact there are observations that directly contradict to this model, to mention only one, the observed steep spectral index in 1995.
There is a possibility that in fact we observe synchrotron radiation. Even the flat spectral index can be reconciled with this interpretation, if there is a mixed population of relativistic and thermal electrons (see White ([1985]) for details). The question is now how and where these energetic electrons are produced. Whether these particles are accelerated in shocks in the ISM or most of them originate from the vicinity of the central engine is an open question, but the latter seems to be more plausible.


6 Conclusions
We detect the equatorial outflow of SS433 that have already been envisaged by other groups based on optical and X-ray observations, and numerical simulations of the system. The outflow speed is estimated to be 1200/sin() km/s, but this result has not been confirmed yet.
Because there are indications for equatorial outflows in other systems as well, moreover theoretical work and numerical simulations suggest that there is a significant mass-loss in high-mass X-ray binary systems, we conclude that eqatorial outflows might be common in microquasars harbouring a massive normal star. In fact, the mass-loss rate could be much higher in these outflows than in the radio jets, as demonstrated for SS433.
Acknowledgements.
The European VLBI Network is a joint facility of European and Chinese radio astronomy institutes funded by their national research councils. The National Radio Astronomy Observatory is operated by Associated Universities, Inc. under a Cooperative Agreement with the National Science Foundation. We acknowledge partial financial support received from the Hungarian Space Office (MUI), the Netherlands Organization for Scientific Research (NWO), and the Hungarian Scientific Research Fund (OTKA) (grant No. N31721 & T031723). This research was supported by the European Commission’s TMR Programme “Access to Large-scale Facilities”, under contract No. ERBFMGECT950012. We acknowledge the support of the European Community - Access to Research Infrastructure and Infrastructure Cooperation Networks (RADIONET, contract No. HPRI-CT-1999-40003) action of the Improving Human Potential Programme.References
- [2001] Blundell K.M., Mioduszewski A.J., Muxlow T.W.B., Podsiadlowski P., Rupen M.P. 2001, ApJ 562, L79
- [1992] Chakrabarti S.M., Matsuda T. 1992, ApJ 390, 639
- [2000] King A.R., Taam R.E., Begelman M.C. 2000, ApJ 530, L25
- [2001] Gies D.R., McSwain M.V., Riddle R.L., Wang, Z., Wiita P.J., Wingert D.W. 2002, ApJ 566, 1069
- [1996] Kotani T., Kawai N., Matsuoka M., Brinkmann W. 1996, PASJ 48, 619
- [1989] Margon B., Anderson S.F. 1989, ApJ 347, 448
- [1997] Panferov A.A., Fabrika S.N. 1997, Soviet Astron. 41(4), 506
- [2000] Paragi Z. 2000, PhD thesis, Eötvös Loránd Univ., Budapest
-
[2001]
Paragi Z. 2001, PADEU 12, p. 53
(http://astro.elte.hu/phd2000/paragi.ps) - [2001a] Paragi Z., Fejes I., Vermeulen R.C., Schilizzi R.T., Spencer R.E., Stirling A.M. 2001a, in: Schilizzi R.T., Vogel S., Paresce F., Elvis M. (eds.) Proc. IAU Symposium 205 “Galaxies and their constituents at the highest angular resolutions”, p. 266, ASP
- [2001b] Paragi Z., Fejes I., Vermeulen R.C., Schilizzi R.T., Spencer R.E., Stirling A.M. 2001b, Astrophys. Sp. Sc. 276 (suppl.), p. 131, Kluwer Academic Publishers
- [1999] Paragi Z., Vermeulen R.C., Fejes I., Schilizzi R.T., Spencer R.E., Stirling A.M. 1999, A&A, 348, 910
- [1998] Paragi Z., Vermeulen R.C., Fejes I., Schilizzi R.T., Spencer R.E., Stirling A.M. 1998, NewAR, 42, 641
- [1985] White R.L. 1985, ApJ 289, 698
- [1991] Zwitter T., Calvani M., D’Odorico S. 1991, A&A 251, 92