HE 04351223: a wide separation quadruple QSO and gravitational lens ††thanks: Based in part on observations obtained with the Baade 6.5-m telescope of the Magellan Consortium. Also based in part on observations collected at the European Southern Observatory, La Silla, Chile.
We report the discovery of a new gravitationally lensed QSO, at a redshift , with four QSO components in a cross-shaped arrangement around a bright galaxy. The maximum separation between images is , enabling a reliable decomposition of the system. Three of the QSO components have , while component A is about 0.6 mag brighter. The four components have nearly identical colours, suggesting little if any dust extinction in the foreground galaxy. The lensing galaxy is prominent in the band, weaker in and not detected in . Its spatial profile is that of an elliptical galaxy with a scale length of kpc. Combining the measured colours and a mass model for the lens, we estimate a most likely redshift range of . Predicted time delays between the components are 10 days. The QSO shows evidence for variability, with total band magnitudes of 17.89 and 17.71 for two epochs separated by months. However, the relative fluxes of the components did not change, indicating that the variations are intrinsic to the QSO rather than induced by microlensing.
Key Words.:
Quasars: individual: HE 04351223 – Quasars: general – Gravitational lensing1 Introduction
The majority of known gravitationally lensed QSOs displays image splitting into two components. Such systems offer relatively few constraints for their mass distributions – usually just the two positions since the flux ratios might be changed by microlensing. Both for the purpose of studying lensing potentials (Keeton, Kochanek & Falco Keeton et al.1998 ) and for the purpose of measuring cosmological parameters (Schechter Schechter2001 ), quadruply imaged quasars are considerably more useful than their doubly imaged counterparts. The discovery of a new quadruply imaged is therefore welcomed by everyone except those who struggle to explain why their relative numbers are so high in radio lensing surveys (Rusin and Tegmark Rusin & Tegmark2001 ).
In this paper we report the discovery of a new gravitationally lensed QSO with quadruple image splitting. The object was found to be multiple as part of a new, ongoing imaging survey for lensed quasars using the Magellan Consortium’s 6.5 m Baade telescope on Cerro Las Campanas. We present the first spectrum of this QSO and analyse gri imaging data to establish a first suite of astrometric and photometric properties of the QSO components and the lensing galaxy. We then discuss the available constraints on the surface mass distribution in the lens and conclude with some prospects for future observations.
2 Observations
2.1 Identification and spectroscopy
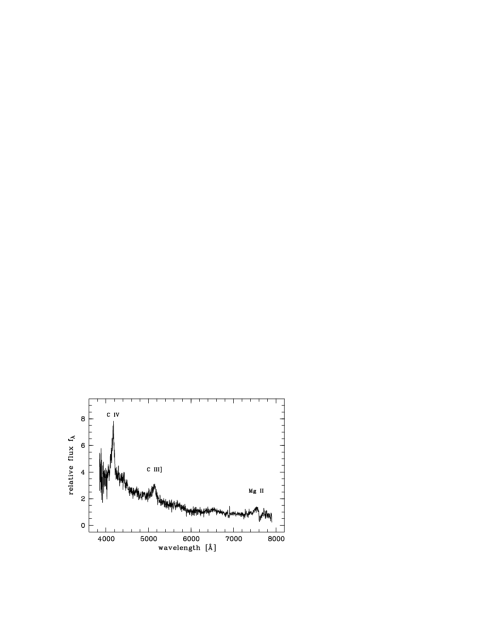
HE 04351223 was originally found as a high-probability QSO candidate, selected in the course of the Hamburg/ESO digital objective prism survey (Wisotzki et al. Wisotzki et al.2000 ). Subsequent low-resolution spectroscopy was performed in March 2000 using the ESO 1.52 m telescope on La Silla with its Boller & Chivens spectrograph. A 5 min exposure was enough to confirm the nature of this object as a bona fide QSO, and to determine its redshift (measured from the peak of the C iv emission line). The spectrum is displayed in Fig. 1 and reveals a fairly average QSO without obvious peculiarities. At that time, only a photographic sky survey image existed, showing the QSO as an unresolved single source. It is now clear that only a fraction of the quadruple image ensemble was located within the spectrograph slit, and the spectrum therefore constitutes an ill-defined blend of all four components. However, the very similar optical colours (see below) make it likely that Fig. 1 is representative for each of the QSO components.
2.2 Imaging
High resolution optical images were obtained at the 6.5 m Baade telescope on 14 Dec 2001, equipped with the Magellan Instant Camera (MagIC) and a 2k2k CCD. The image scale at the f/11 Nasmyth focus was approximately per pixel. A Shack-Hartmann wavefront sensor (Schechter et al. 2002, in preparation) was used to update the focus and translation of the secondary and the twelve most flexible elastic modes of the primary mirror at half minute intervals.
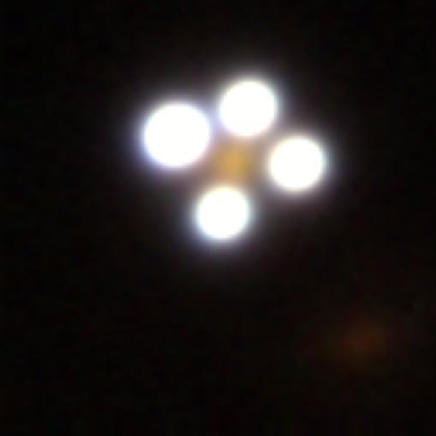
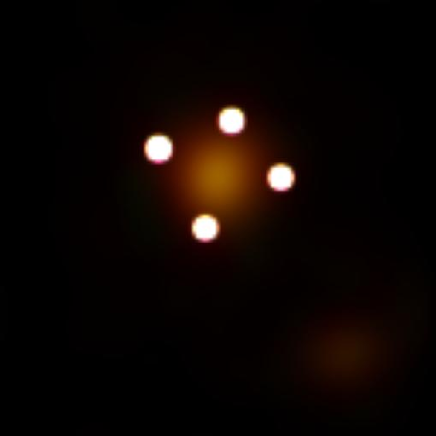
After a first band ‘snapshot’ of 30 sec which revealed the multiple nature of the QSO, five further images were obtained: One each in the SDSS and bands, and three in , of 300 sec exposure each (for simplicity, we shall refer to these bands as gri in the following). The effective seeing was between and (for the image). At the scale of /pixel, the images were highly oversampled. In Fig. 2 we show postage stamps of the QSO in the three bands. The symmetric configuration of four bright point sources plus a fuzzy object in the centre immediately recalls the famous ‘Einstein Cross’ Q 22370305 (Huchra et al. Huchra et al.1985 ), and the image alone leaves little doubt that HE 04351223 is another case of a quadruple gravitational mirage. Given the nearly textbook arrangement of the components in HE 04351223, we shall assume henceforth that there is no reasonable alternative to the lensing hypothesis in this object. A colour composite image is shown in Fig. 3.
Second epoch data was secured on 15 Feb 2002, using the same telescope and instrument configuration as above. Three 120 sec images in the band were taken at seeing under photometric conditions. The standard star sequence PG 1047+003 was observed to provide a zeropoint for the band.
| Component | ||||
|---|---|---|---|---|
| [arcsec] | [arcsec] | |||
| A | ||||
| B | ||||
| C | ||||
| D | ||||
| G | ||||
3 Analysis
3.1 PSF fitting and deconvolution
In order to decompose the observed images into four point sources plus an extended contribution from the lensing galaxy, we followed two independent approaches. First, we performed a straightforward PSF fitting analysis using DAOPHOT II (Stetson et al. Stetson1987 ). This confirmed the visual impression that components A–D (numbered clockwise starting from the brightest component) are indeed point-like, but the PSF-subtracted image looked less than satisfactory especially in the and bands. The point sources were oversubtracted, and the source positions were systematically shifted inwards, both clearly caused by the fact that the contribution of the lensing galaxy has not been taken into account in the fitting.
We have therefore chosen to apply a more sophisticated method. The algorithm devised by Magain, Courbin & Sohy (Magain et al.1998 ; hereafter MCS) combines multiple point source fitting with a locally regularised deconvolution of the smooth image component. The algorithm has been demonstrated to yield astrometrically and photometrically unbiased results (MCS; see also Burud et al. Burud et al.1998 ) and is thus well-suited to our case. We have used an ‘alpha release public version’ of the code to decompose each image into four point sources plus a smooth ‘background’ channel. The reconstructed images are shown in the right-hand panels of Fig. 2, adopting a final resolution of FWHM in and , and of in . The lensing galaxy is very prominent in the reconstructed band image, fainter but clearly detectable in , but swamped by PSF residuals in . The non-detection in is confirmed by the DAOPHOT analysis which also shows no significant galaxy residual at the expected location.
While the MCS method is probably close to optimal in its treatment of the point sources, we found that the exact shape of the reconstructed lensing galaxy depended critically on the local smoothing term which basically is a free parameter in the algorithm; slight variations of (by a factor of or so) led to significantly different scale lengths. We therefore reverted to a hybrid approach: Using the results of the MCS routine for the point source positions and fluxes, we went back to DAOPHOT and performed another PSF subtraction cycle. The resulting image of the lensing galaxy looks almost free of PSF residuals and certainly good enough to perform a first reliable morphological analysis of the lensing galaxy.
3.2 Astrometry
Rectangular positions of the four point source components were provided by the MCS PSF fitting/deconvolution code. Arbitrarily adopting the brightest component A as reference point, we list the relative positions of HE 04351223 B–D in Table 1. Errors were estimated from the rms deviations between individual frames as well as between individual deconvolution runs, which differ by adopting slightly different parameters for the smoothing scale. All measurements agree with each other extraordinarily well, with deviations from the mean of never more than a few milli-arcseconds, with no systematic effects visible between the different photometric bands.
The lensing galaxy had to be treated separately, as it is not modelled as an individual ‘object’ by the MCS code. However, in the and bands it has a well-defined centroid which we measured by fitting a Gaussian to the inner region. When expressed relative to image A, the galaxy centroid is shifted by between and . We estimate the uncertainty of the galaxy position to be at least of this order.
In order to relate the above relative astrometry to a commonly used reference system, we have tied the measurements to the Digitized Sky Survey (DSS) astrometric solution. The quasar itself is unresolved in the DSS images, but four nearby stars are found in all our CCD images as well as in the DSS. We computed simple bilinear solutions for each CCD image and obtained the following coordinates of Component A: R.A. = 04h 38m 14, Dec = 17′ (J2000.0), with errors defined entirely by the unknown systematics of the DSS solution in this area.
| Component | |||
|---|---|---|---|
| A | 1.10 | 1.10 | 1.11 |
| B | 1.61 | 1.61 | 1.59 |
| C | 1.70 | 1.67 | 1.63 |
| D | 1.74 | 1.78 | 1.82 |
| Component | |||||
|---|---|---|---|---|---|
| QSO total | 17.89 | 17.15 | 16.53 | 0.74 | 0.62 |
| A | 19.00 | 18.44 | 17.95 | 0.56 | 0.49 |
| B | 19.51 | 18.95 | 18.43 | 0.56 | 0.52 |
| C | 19.60 | 19.01 | 18.47 | 0.59 | 0.53 |
| D | 19.64 | 19.10 | 18.66 | 0.54 | 0.44 |
| G () | 19.16 | 18.05 | 1.11 | ||
| G () | 22.70 | 20.91 | 19.82 | 1.80 | 1.08 |
| Ref. star | 17.80 | 16.56 | 15.98 | 1.24 | 0.58 |
3.3 Photometry
Relative photometry of components A–D is directly provided on output by the MCS code. Even without any calibration it is clear that all components have very similar colours. In Table 2 we present the fractional contributions of each component to the total QSO flux (without lensing galaxy), expressed in magnitudes. Between the photometric bands, the contributions of components A and B show deviations of no more than mag, while components C and D show marginally significant deviations but are still very nearly independent of wavelength, within mag. Note that the numbers for the band are identical between first and second epoch to within mag.
For measuring the brightness of the lensing galaxy we constructed PSF-subtracted images with DAOPHOT, but using the relative astrometry of the QSO components from the MCS deconvolution. The resulting galaxy-only images look quite clean and devoid of strong PSF subtraction residuals, except for the band where we regard the lensing galaxy to be undetected, because of the significant PSF residuals in that image. We quote two values for the galaxy flux: one obtained by integrating to infinity and a second through a small aperture of 10 pixels radius (07). The small aperture was included because within this radius, residual PSF contamination should be close to negligible. While a significant fraction of the total galaxy flux will be missed this way, the galaxy colours should be rather reliable. For the colour, the formally measured band aperture flux of the galaxy is treated as an upper limit.
Since the first epoch data were obtained under nonphotometric conditions, we have tied the band photometry of the QSO to a nearby star, visible within the CCD field of view and located at R.A. = 04h 38m 12, Dec = 17′ (J2000.0). We found this star to have in the second epoch data. Assuming the star to be non-variable, the total (large aperture) magnitude of the QSO is a the first epoch and at the second epoch, with uncertainties of at most mag. There is thus evidence for significant variability of the QSO. However, as stated above, the fractional contributions of the individual QSO components to the total band flux are identical in first and second epoch data. We return to this issue below.
As the second epoch provided only calibrated ,
but no and data,
we have worked out at least approximate zeropoints for
these latter bands as follows.
We found that the above reference star has an entry
in the database of digital objective prism spectra of the
Hamburg/ESO Survey (Wisotzki et al. Wisotzki et al.2000 ).
Christlieb et al. (Christlieb et al.2001 ) showed that these
spectra can be used to obtain () colours of normal stars
with an accuracy of better than 0.1 mag. Following
their recipe, we estimate for our star
and then used a matching model atmosphere spectrum111obtained from R. Kurucz’ web site at
http://cfaku5.harvard.edu/
to estimate its colours in the SDSS system to
, and .
Combining the second epoch band calibration with
the estimated intrinsic colours of the reference star,
we could thus tie the first epoch and band data to
an external photometric system.
The uncertainty of this ‘calibration’ procedure
is considerable, leading to zeropoint errors of
mag for and mag for
(assuming a standard error of mag in
of the reference star).
However, the errors in and are strongly correlated,
and the zeropoint uncertainty in colour
is only mag.
Results for the final calibrated photometric results
are collated in Table 3.
4 Discussion
4.1 Properties of the lensing galaxy
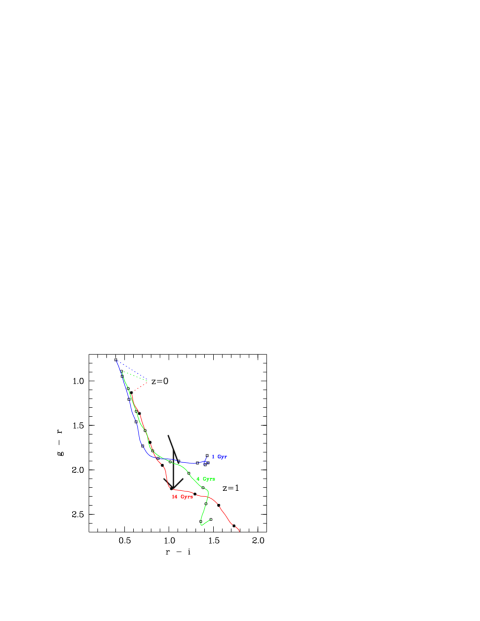
Lacking direct spectroscopic evidence, we have estimated the redshift of the lensing galaxy using its measured colours. Figure 4 shows the redshift-colour dependence of three simple galaxy models, represented as single stellar populations (SSPs) with ages of 1, 4, and 14 Gyrs, respectively. (For the limited redshift baseline covered, we ignored passive evolution.) We used the recent solar metallicity models from Jimenez et al. (Jimenez et al.2000 ), kindly provided by R. Jimenez. The bar+arrow symbol denotes the measurement of the galaxy inside the small () aperture, with the width and inclination of the bar reflecting chiefly the uncertain calibration (recall that the errors in and are correlated).
This plot suggests that the redshift is probably around –0.5, the best estimate depending on the unknown intrinsic spectrum of the galaxy. The youngest (1 Gyr) SSP model yields the highest redshift () and is only marginally consistent with our upper limit for the -band flux. With the more reasonable assumption of an old stellar population dominating the SED of the lensing galaxy, the best redshift estimate drops to for a 14 Gyrs old SSP. Because the 14 Gyrs track bends sharply in exactly this part of the colour-colour diagram, the corresponding formal error is highly asymmetric. Adopting a confidence limit, we predict a redshift in the interval ; other arguments detailed below will show that it is more likely to be near the lower end of that range. Of course, two colours are insufficient to distinguish an evolved population from a younger one that involves dust extinction, but a very dusty lensing galaxy can probably be ruled out from the fact that the four QSO images have such similar colours.
For the formally best redshift estimate of , the absolute magnitude of the lensing galaxy can be converted directly from the band measurement without any correction. We obtain for km s-1 Mpc-1, , , about a factor of 5 brighter than an field galaxy. This would drop to or for .
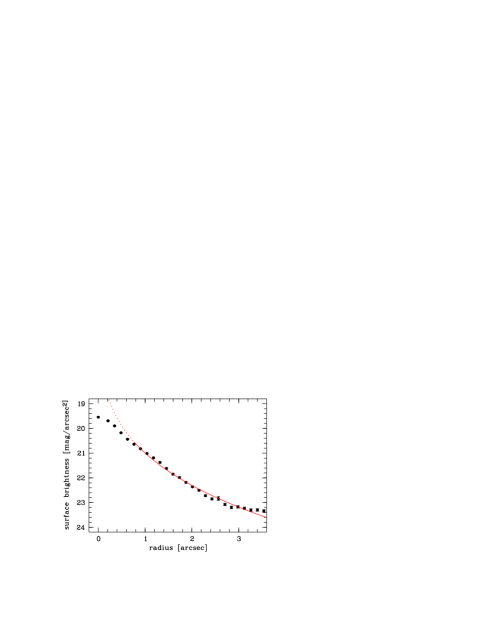
The reconstructed band image, without the point source components, allows us to investigate the gross morphological properties of the lens. Figure 5 shows the radial surface brightness profile, measured in concentric annulli of 2 pixels width (). Inside of , the profile is blurred by the seeing, but outside this radius it is clear that the galaxy follows approximately a de Vaucouleurs law. The best-fit scale length is corresponding to kpc at (redshift uncertainty not included in error estimate). Notice that the galaxy is nearly perfectly round, with isophotes having everywhere.
A possible companion is found to the SW of the lensing galaxy, at a position angle of . It is visible in all bands, although the detection in is only marginal. Its colours, measured over an aperture of radius 10 pixels or , are and (again with strongly correlated errors). The colours are thus consistent with the ‘companion’ being at the same redshift as the galaxy, but without spectroscopic confirmation this conclusion must remain speculative. The total magnitude of the companion is , corresponding to or for .
4.2 The lensing potential
4.2.1 Qualitative features
The image configuration is roughly diamond shaped (indicating perhaps a diamond in the rough), and nearly bilaterally symmetric with respect to the AC diameter. The AC diameter is a factor of 1.14 times larger than the BD diameter. Taking the potential of the lensing galaxy to be roughly isothermal, this implies that the source of the quadrupole moment, whether due to a bar or a tidal perturber, lies along the BD diameter (e.g. Witt, Mao and Schechter Witt et al.1995 ). The strength of the shear should be roughly half (AC – BD)/(AC + BD), or . The strength of the isothermal sphere model ought to be half the average of the two diameters, or 1.203 arcseconds.
4.2.2 Quantitative aspects
A model which works quite well for many lenses is a singular isothermal sphere with an external shear, as might be generated by the tide from a neighboring galaxy or cluster. The two dimensional projected potential (e.g. Kochanek Kochanek1991 ) is given by
| (1) |
where is the diameter of the isothermal sphere in arcseconds, and are the radial and angular parts, respectively, of the angular position on the sky with respect to the galaxy, and is the orientation of the shear on the sky, measured E of N. Given our sign convention, a bar or tidal perturber would be at right angles to . In addition to the three explicit parameters, the position of the source adds two more parameters.
Fitting this 5 parameter model to the positions (but not the fluxes) of the four images we find that the model gives rms errors of . The rms residuals improve considerably if we take the position of the lensing galaxy to be free, adding two additional parameters. The predicted galaxy position is then some from the observed position, consistent with our measurement errors. We find , and , with a source position () = (, ). The source of the tide is predicted to lie at P.A. or .
| observed | predicted | |||||
|---|---|---|---|---|---|---|
| A | 1.150 | 0.510 | 1.150 | 0.509 | 7.4 | 0.798 |
| B | 0.333 | 1.077 | 0.334 | 1.077 | 8.2 | 0.725 |
| C | 1.338 | 0.079 | 1.339 | 0.078 | 7.7 | 0.790 |
| D | 0.199 | 1.110 | 0.201 | 1.110 | 5.0 | 0.636 |
| G | 0.000 | 0.000 | 0.036 | 0.047 | ||
In Table 4 we give the observed and predicted positions for the four images, as well as the predicted magnifications, . Negative magnifications indicate the parity flip associated with saddlepoints of the time delay function. Components A and D are both observed to be brighter than predicted by mag relative to components B and C.
For an isothermal sphere, the lens strength (measured in radians) is given by
| (2) |
(Narayan and Bartelmann Narayan & Bartelmann1999 ) where is the line of sight velocity dispersion of the isothermal sphere and where and are angular diameter distances, from observer to source and lens to source, respectively. Taking we get km/s. The Faber-Jackson relation would predict a substantially larger dispersion for a galaxy. At , we get km/s, more nearly in line with the expectation for a galaxy.
The shear, , while not especially large for a quadruple lens, would call for an E3–E4 mass distribution if the flattening of the galaxy were the source of the quadrupole moment (Keeton et al. Keeton et al.1998 ). As the flattening of the light is unmeasurably small, this suggests that the quadrupole moment is indeed due to an external tide. In several quadruple systems the source of the tide, a cluster or group of galaxies, is clearly visible at right angles to (Kundic et al. Kundic et al.1997 ; Schechter et al. Schechter et al.1997 ; Kneib et al. Kneib et al.1998 ). In the present case the nearest galaxy, at P.A. , is not at the expected position angle. There are several more galaxies in the neighborhood, again with no obvious concentrations at the expected position angle.
4.2.3 Time delay
The gravitational time delay function, which gives the additional travel time for an image at position , is given by
| (3) |
where is the position of the source, and where we have explicitly included the transformation from arcseconds to radians. As the redshift of the lens is poorly known, in Table 4 we give only the square bracketted quantity, labelled , which has units of (arcsecond)2. We see that components A and C lead, followed by saddlepoints B and D. The longest delay, is for or for . Predicted time delays are quite sensitive to the position of the lensing galaxy for symmetric lenses. The time delays predicted using the observed position for the lensing galaxy are 15 % smaller.
4.3 Variability
In Sect. 3.3 we demonstrated that the total QSO flux in the band varied by almost 20 % within a timespan of 2 months. A comparison between our 2001/2002 CCD photometry and the original photographic discovery data reveals additional, albeit circumstantial, evidence for variability: On the UKST image of the Digitized Sky Survey, calibrated by photometric sequences taken in the course of the Hamburg/ESO Survey, we measure the QSO to have at epoch 1984.9. On the spectral discovery plate obtained with the ESO Schmidt telescope (epoch 1996.9), the object has only , calibrated against the same photometric sequence. While the HES photographic photometry is well-defined only for point sources (with a global rms accuracy of mag), which might lead to a photometric bias for multiply imaged QSOs, inspection of the scan data revealed the quasar to appear perfectly unresolved. We conclude that the differences between photographic and the more recent CCD measurements are most probably significant.
For the two Magellan epochs Dec 2001 and Feb 2002, we can state that the variability is almost certainly intrinsic to the QSO and not caused by microlensing. This is given by the fact that the flux ratios of the four components have remained unchanged to within 1 %, despite an almost 20 % variation of total flux. Microlensing-induced flux amplification would always affect each image differently, which is in contradiction to the observations. On the other hand, the short expected time delay means that intrinsic variations (assumed to be much slower) will show up quasi-simultaneously in all four images.
While we can exclude microlensing as the cause of variability between Dec 2001 and Feb 2002, this cannot be said about the origin of the much larger variations between 1986 and today. In fact, the amplitude of more than 1 mag might even favour microlensing, as such amplitudes are rare for intrinsic variations of normal, non-OVV QSOs (Hook et al. Hook et al.1994 ; Cristiani et al. Cristiani et al.1996 ). From the extensive monitoring campaigns of the Einstein Cross (Irwin et al. Irwin et al.1989 ; Wozniak et al. Woźniak et al.2000 ; OGLE web site), on the other hand, it is known that microlensing amplifications of more than one magnitude are possible and in fact happening.
5 Conclusion
The new quadruple QSO HE 04351223 is an almost textbook example for gravitational lensing, with its four nearly identical components arranged symmetrically around a luminous early-type galaxy. Unlike most other known quadruple systems, photometric monitoring of this object should be relatively easy even in mediocre seeing conditions, because of its wide image separations. Furthermore, its location in the sky makes it accessible to both Northern and Southern observatories.
Owing to its symmetry, the time delay is expected to be short, and accurate measurement of differential time delays might therefore be difficult unless the QSO should prove to be variable on very short timescales. This could limit the usefulness of the object for cosmological purposes, but at the same time it makes it an attractive target for microlensing studies, because of the relative ease to separate intrinsic and microlensing-induced variations. Notice that compared to the Einstein Cross Q 22370305, the higher lens redshift in HE 04351223 implies a lower projected transverse velocity and hence a much longer characteristic timescale for high-amplification event from microlensing It will therefore be easier to obtain a well-sampled lightcurve, but unfortunately events will be rarer and take much longer to get covered.
We have presented evidence that the QSO experiences substantial flux variations on time scales of months and years. Whether microlensing could have a contribution in these variations is not yet clear, but it can already be said with certainty that monitoring of HE 04351223 will be a promising task.
Acknowledgements.
The Hamburg/ESO Survey was supported as ESO key programme 02-009-45K (145.B-0009). MagIC was built with help from a gift by Raymond and Beverly Sackler to Harvard University and a US NSF grant, AST99-77535, to MIT. PLS gratefully acknowledges the support of a fellowship from the John Simon Guggenheim Foundation.References
- (1) Burud I., Stabell R., Magain P., Courbin F., Ostensen R., Refsdal S., Remy M., Teuber J., 1998, A&A 339, 701
- (2) Christlieb N., Wisotzki L., Homeier D., Koester D., Reimers D., Heber U., 2001, A&A 366, 898
- (3) Cristiani S., Trentini S., La Franca F., Aretxaga I., Andreani P., Vio R., Gemmo A., 1996, A&A 306, 395
- (4) Hook I. M., McMahon R. G., Boyle B. J., Irwin M. J., 1994, MNRAS 268, 305
- (5) Huchra J., Gorenstein M., Kent S., Shapiro I., Smith G., Horine E., Perley R., 1985, AJ 90, 691
- (6) Irwin M. J., Webster R. L., Hewett P. C., Corrigan R. T., Jedrzejewski R. I., 1989, AJ 98, 1989
- (7) Jimenez R., Padoan P., Dunlop J. S., Bowen D. V., Juvela M., Matteucci F., 2000, ApJ 532, 152
- (8) Keeton C. R., Kochanek C. S., Falco E. E., 1998, ApJ 509, 561
- (9) Kneib J.-P., Alloin D., Mellier Y., Guilloteau S., Barvainis R., Antonucci R., 1998, A&A 329, 827
- (10) Kochanek C. S., 1991, ApJ 373, 354
- (11) Kundic T., Turner E. L., Colley W. N., Gott J. R. I., Rhoads J. E., Wang Y., Bergeron L. E., Gloria K. A., Long D. C., Malhotra S., Wambsganss J., 1997, ApJ 482, 75
- (12) Magain P., Courbin F., Sohy S., 1998, ApJ 494, 472
- (13) Narayan R., Bartelmann M., 1999, Formation of Structure in the Universe, 360
- (14) Rusin D., Tegmark M., 2001, ApJ 553, 709
- (15) Schechter P., 2001, ASP Conf. Ser. 237: Gravitational Lensing: Recent Progress and Future Go, 427
- (16) Schechter P. L., Bailyn C. D., Barr R., Barvainis R., Becker C. M., Bernstein G. M., Blakeslee J. P., Bus S. J., Dressler A., Falco E. E., Fesen R. A., Fischer P., Gebhardt K., Harmer D., Hewitt J. N., Hjorth J., Hurt T., Jaunsen A. O., Mateo M., Mehlert D., Richstone D. O., Sparke L. S., Thorstensen J. R., Tonry J. L., Wegner G., Willmarth D. W., Worthey G., 1997, ApJl 475, L85
- (17) Stetson P. B., 1987, PASP 99, 191
- (18) Wisotzki L., Christlieb N., Bade N., Beckmann V., Köhler T., Vanelle C., Reimers D., 2000, A&A 358, 77
- (19) Witt H. J., Mao S., Schechter P. L., 1995, ApJ 443, 18
- (20) Woźniak P. R., Alard C., Udalski A., Szymański M., Kubiak M., Pietrzyński G., Zebruń K., 2000, ApJ 529, 88