ANOMALOUS RR LYRAE STARS(?). III. CM LEONIS ††thanks: E-mail: gisella@bo.astro.it (GC), angela@bo.astro.it (AB), merighi@bo.astro.it (RM), tosi@bo.astro.it (MT), difabrizio@tng.iac.es (LDF), ditomaso@tng.iac.es (SDT), marcella@na.astro.it (MM), carretta@pd.astro.it (EC), iivans@astro.as.utexas.edu (III), chris@verdi.as.utexas.edu (CS), smith@saucer.pa.msu.edu (HAS)
Abstract
Time series of B,V,I CCD photometry and radial velocity measurements from high resolution spectroscopy (R=30,000) covering the full pulsation cycle are presented for the field RR Lyrae star CM Leonis. The photometric data span a 6 year interval from 1994 to 1999, and allow us to firmly establish the pulsation mode and periodicity of the variable. The derived period P=0.361699 days () is very close to the value published in the Fourth Edition of the General Catalogue of Variable Stars (P=0.361732 days). However, contrary to what was previously found, the amplitude and shape of the light curve qualify CM Leo as a very regular first overtone pulsator with a prominent hump on the rising branch of its multicolour light curves. According to an abundace analysis performed on three spectra taken near minimum light (0.42 0.61), CM Leo is a metal-poor star with metal abundance [Fe/H]=. The photometric and radial velocity curves of CM Leo have been compared with the predictions of suitable pulsational models to infer tight constraints on the stellar mass, effective temperature, and distance modulus of the star. We derive a true distance modulus of CM Leo of =13.11 0.02 mag and a corresponding absolute magnitude of =0.470.04. This absolute magnitude, once corrected for evolutionary and metallicity effects, leads to a true distance modulus of the Large Magellanic Cloud of =18.43 0.06 mag, in better agreement with the long astronomical distance scale.
keywords:
stars: abundances – stars: fundamental parameters – stars: horizontal-branch – stars: individual (CM Leonis) – stars: oscillations – stars: variables: other1 Introduction
This is the third in a series of papers dealing with the detailed study of the pulsational properties of a sample of field RR Lyrae stars that were known to exhibit anomalous scatter and variations in the shape and amplitude of their light curves. In Clementini et al. (1995b; hereinafter Paper I) we reported results from a first photometric study of a sample of 8 field RR Lyrae stars which, according to the literature, were classified as fundamental mode pulsators (RRab) with short periods and located at large heights z from the Galactic plane (Castellani, Maceroni & Tosi 1983). The circumstance of being far from the disc but with a period that for RRab usually corresponds to roughly solar metallicity made these stars fairly anomalous. The photometry presented in Paper I demonstrated however that five out of the eight variables were more likely to pulsate in the first overtone mode, and that, therefore, the short period should not be taken as indicative of high metallicity. Furthermore, it showed that some of the stars in the sample (namely CM Leonis, CU, BS and BE Comae) exhibited irregularities in their light curves. In order to investigate the actual nature of these anomalies new observing campaigns were conducted on these four stars. In Clementini et al. (2000, Paper II) we reported the discovery that CU Comae is a double-mode RR Lyrae, the sixth detected in the field of our Galaxy and the most metal-poor ever found. The present paper is devoted to the discussion of the results obtained for CM Leonis (CM Leo) from the combination of its Paper I photometry with new data taken from 1995 to 1999, and from high resolution spectroscopy obtained in 1999. The observations and data sets are presented in Section 2. In Section 3 we discuss the results of the analysis of the complete photometric data set. In Section 4 we report the results of our spectroscopic analyses (derivation of a radial velocity curve over the full pulsation cycle and elemental abundance analysis of the spectra of CM Leo taken near minimum light). In section 5, we present results of the modeling of the observed light and radial velocity curves of CM Leo, based on nonlinear pulsation models, computed with the same physical and numerical assumptions as in Bono, Castellani & Marconi (2000), and derive an estimate of the stellar mass, effective temperature, and distance modulus of the star. Finally, in Section 6 we summarize the main derived quantities of CM Leo and discuss the absolute magnitude we derive for the star in the framework of the short and long distance scale dichotomy.
2 Observations and reductions
According to the fourth edition of the General Catalogue of Variable Stars (Kholopov et al. 1985, GCVS4) CM Leo (, ) is a fundamental mode RR Lyrae star (RRab) with a rather short pulsation period P=0.d361732 and 1.10 mag amplitude in the photographic light variation. Clementini et al. (1995b) obtained CCD V photometry of CM Leo in 1994. With a period P=0.d361479 they basically confirmed the periodicity of the GCVS4, but showed that the light curve has a sinusoidal shape with amplitude of 0.49 mag, and appears to be split in two well-separated subcurves with about 0.1 mag difference in amplitude (see figure 3a in Paper I). Clementini et al. (1995b) concluded that CM Leo is a c-type RR Lyrae with irregularities in its light curve. Three different causes were suggested to possibly explain the anomaly in the light curve, namely double-mode or non-radial mode pulsation (Olech et al. 1999), and the Blazhko effect (Blazhko 1907). Given the small number of data points (71) and the short time baseline (2 months), the 1994 observations were insufficient to pinpoint the actual source of the irregularities. New photometry of the star was obtained from 1995 to 1999 with the Loiano 1.52 m telescope operated by the Bologna Observatory, and the 60 cm of the Michigan State University (MSU). High resolution spectroscopy of the star was also obtained in 1999, with the 2.7 m telescope of the McDonald Observatory.
2.1 Photometric data
The new photometric data of CM Leo consist of B,V,I CCD observations in the Johnson-Cousins photometric system defined by Landolt (1983, 1992) standard stars, obtained with the Loiano 1.52 m telescope, on 27 nights from January 1995 to February 1999. They were complemented by 171 and 30 V frames obtained with the MSU 60 cm telescope in 1998 and on two consecutive nights in February 1999, respectively. At both telescopes, the 1998 campaign consisted of several consecutive nights (from 5 to 10) in three major runs about one month apart, to test both the possibility of double-mode or non-radial mode pulsation (which are both known to occur on cycle-to-cycle timescales), and of the Blazhko effect (whose periodic modulation of the light curve has typical timescales of tens of days). In addition, the 1999 campaign consisted of two nights of coordinated observations at the Loiano and MSU telescopes, which allowed us to obtain continuous photometry of CM Leo over 10.4 consecutive hours. This interval is larger than a full pulsation cycle of CM Leo (8.7 hours) thus permitting us to further check on the cycle-to-cycle nature of the irregularities in the light curve. On these same nights high resolution spectroscopy of the star was also secured with the 2.7 m telescope of the McDonald Observatory to obtain the radial velocity curve, and to perform a chemical abundance analysis. The journal of the photometric observations is given in Table 1.
| Year | N.of Observations | Observed intervals | Telescope | ||
|---|---|---|---|---|---|
| (HJD2452400000) | |||||
| 1995 | 17 | 28 | 15 | 49730 - 49756 | 1.52m |
| 1996 | 21 | 19 | 19 | 50122 - 50131 | 1.52m |
| 1997 | 12 | 23 | 11 | 50507 - 50508 | 1.52m |
| 1998 | 55 | 315 | 63 | 50841 - 50910 | 1.52m |
| 1998 | 171 | 50845 - 50921 | 0.6m | ||
| 1999 | 8 | 51223 | 1.52m | ||
| 1999 | 30 | 51223 - 51224 | 0.6m | ||
| Tot | 105 | 594 | 108 | ||
Observations at the 1.52 m telescope were obtained with BFOSC (Bologna Faint Object Spectrograph & Camera) mounting a Thomson 1k1k CCD (0.5 arcsec/pixel, field of view 9.6 arcmin2); filters in the Johnson-Cousins photometric system were used. The field of CM Leo, taken from a CCD image, is shown in Figure 1. Observations at the 60 cm MSU telescope were obtained with an Apogee Ap7 CCD, providing an 11 arcmin2 field of view.
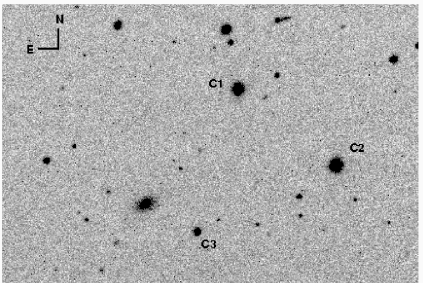
Three other objects are marked in Figure 1: the comparison stars C1, C2 and C3. Since only a small fraction of the observations of CM Leo were taken in truly photometric conditions, the light curve of the variable has been derived in terms of differential magnitude with respect to these comparison stars. Data were pre-reduced, and instrumental magnitudes of the variable and comparison stars were derived by direct photon counting using standard routines for aperture photometry in IRAF111 IRAF is distributed by the National Optical Astronomy Observatories, which is operated by the Association of Universities for Research in Astronomy, Inc., under cooperative agreement with the National Science Foundation.. The photometric data were tied to the standard photometric system through observations of 35 standard stars selected from Landolt (1983, 1992; for details on the calibration procedure see Di Fabrizio 1998).
2.1.1 The comparison stars
The choice of the best comparison star turned out to be a crucial point in the study of the variability of CM Leo. Of the three isolated stars falling in the CCD, C1 and C2 are of comparable luminosity (12.2-12.5 mag), while C3 is about 2.5 mag fainter and has a redder colour ( mag). C1 was used as comparison star in Paper I. Its stability was checked at the time against star C2. However, some doubts about the constancy of both C1 and C2 were present, due to small trends in the instrumental heliocentric Julian day (HJD) plots, leading to magnitude differences of the order of some hundredths of a magnitude from one run to the other. The significantly increased number of observations and the homogeneity and accuracy of the data reduction procedure of the present study have allowed us to look into this matter in more detail.

Figure 2 plots the differential instrumental magnitudes of CM Leo with respect to the comparison stars C1, C2 and C3 (top, middle and lower panels, respectively) as a function of the HJD of observation, for the 1994-1999 data-set. The top panel includes also the 1998 MSU observations (crosses, 171 data-points). With only the exception of the 1995 CM LeoC1 subset, in each year of observation data shown in the three panels cover the full light variation from maximum to minimum light. This permits to note a variation of about 0.05-0.1 mag both in the minimum and maximum values of and . No variation is instead present in the versus HJD plot. Furthermore, Figure 3 and Figure 4 show the differential instrumental and light curves of CM Leo with respect to the three comparison stars, with data folded according to the best fit period of the variable (P=0.361699, see Section 3).


The scatter in the light curve of CM Leo, measured by the r.m.s. from the best fit model, is reduced from 0.03 mag when using C1 and C2 as comparison stars, to 0.02 mag when using C3. A similar effect is seen for the light curve (scatter going from 0.05 down to 0.02 mag) while the effect is smaller in . The anomaly found in Paper I — a splitting of the light curve in two well-separated subcurves with about 0.1 mag difference in amplitude — is thus solved, and details of the light curve variation of CM Leo, as for instance the hump on the ascending branch, are better defined when star C3 is used as reference. This suggests that light variations may affect stars C1 and C2, as confirmed by the plots in Figure 5 where we show the instrumental differential , and magnitudes of stars C1 and C2 with respect to star C3, versus the HJD of observation, of the entire data set.

A variation of 0.05-0.20 mag is indeed present in these plots: the variation appears to be slightly larger for star C2 than for star C1, and in both cases is stronger in and and less detectable in . The two stars may be small amplitude, long period variable stars, or they could have faint red companions, however a conclusion on the actual cause of their light variation cannot be reached from the present data. In any case, we conclude that they cannot be used as references for CM Leo, whose light variation is better studied by comparison with star C3. Coordinates and calibrated magnitudes of the 3 stars in the field of CM Leo are given in Table 2, where the uncertainties include both the internal error contribution (about 0.02 mag in all three passbands) and the systematic errors in going to the standard system (0.02 mag in and , and 0.03 mag in ). The slightly larger error of the measurements, in spite of C3 being brighter in , is due to the larger uncertainty of the absolute photometric calibration (fewer standard stars were observed in I, see Di Fabrizio 1998). The stars are identified in column 2 of Table 2 by their number on the second version of the Hubble Space Telescope Guide Star Catalogue (GSC2). Magnitudes given for C1 and C2 have been derived as average of all available differential measurements with respect to star C3, tied to the standard system through the absolute calibration of star C3.
| Star | NGSC2 | |||||
|---|---|---|---|---|---|---|
| C3 | N2001000143 | 11 56 03.7 | 21 18 27.9 | 14.90 0.03 | 15.87 0.03 | 13.87 0.04 |
| C1 | N2001000131 | 11 55 59.9 | 21 21 31.0 | 12.50 | 13.12 | 11.86 |
| C2 | N2001000136 | 11 55 51.0 | 21 19 53.5 | 12.21 | 12.85 | 11.55 |
Note. - C1 and C2 are suspected variable stars with amplitude of the light variation of about 0.05-0.2 mag. Magnitudes given for them are the average of all the available differential values with respect to star C3, tied to the standard system through the absolute calibration of star C3.
The light variation of CM Leo was then studied from the differential photometry with respect to star C3. Photometry published for CM Leo in Paper I used star C1, so the 1994 data have all been remeasured. Unfortunately, star C3 was not sufficiently exposed in the 1998 MSU observations, so this photometry cannot be used in the study of the period. The and magnitudes of CM Leo relative to the comparison star C3 along with the Heliocentric Julian date at mid-exposure are listed in Table 3 (which will be provided in its entirety through the CDS). According to the errors quoted in Table 2 we estimate that the photometric accuracy of each individual data point is mag in and , and mag in , including both random and systematic uncertainties.
| HJD | HJD | HJD | |||
|---|---|---|---|---|---|
| (2400000) | (2400000) | (2400000) | |||
| 49755.474538 | 1.438 | 49755.463750 | 2.092 | 49755.482756 | 0.651 |
| 0.490685 | 1.456 | 0.502722 | 2.191 | 0.522006 | 0.686 |
| 0.513602 | 1.503 | 0.541092 | 2.241 | 0.560607 | 0.601 |
| 0.530212 | 1.499 | 0.579381 | 2.126 | 0.599440 | 0.622 |
| 0.552146 | 1.479 | 0.618828 | 1.962 | ||
| 0.568652 | 1.451 | ||||
| 0.590343 | 1.394 | ||||
| 0.607762 | 1.340 |
Note. - Table 3, which also includes updated Clementini et al. (1995b) photometry, is presented in its entirety at CDS, and a portion is shown here for guidance regarding its form and content.
2.2 Spectroscopic data
CM Leo was observed with the “2d-coudé” spectrograph (Tull et al. 1995) of the 2.7m telescope at the Mc Donald Observatory on UT 1999 February 14 and 15. The spectrograph mounted the E2 echelle grating (R=63 000), and a 20482048 thinned, grade 1 Textronix CCD. Seeing conditions during the nights varied from 1.5′′ to 1.7′′. Our total wavelength coverage extended from 3670 Å to 9900 Å. We employed the data from 3924 Å thorough 8263 Å in our metallicity determinations and restricted the radial velocity determinations to the best-suited orders, in a region from about 4400 Å to 5300 Å. Exposures of a Thorium-Argon lamp to obtain the wavelength calibration were taken at beginning, middle and end of each night. The radial velocity standard star HD 58923 (RV=+17.8 km s-1, Wilson 1953) was also observed, to be used as a template for the cross-correlation measure of the radial velocities of CM Leo and to set the radial velocity zero point.
Given the relative faintness of our target ( and 13.9 mag) and the severe constraints on the exposure length, which we limited to 20-30 min in order to avoid phase blurring on the pulsation cycle, we used a 1010 m slit (which projects to 2 arcsec on the sky) and a 22 binning in order to increase the S/N ratio. We obtained 12 high-resolution spectra of the star, covering a full pulsation cycle. The spectra have resolution R=30,000 and moderate S/N ratio (S/N 50 for a single spectrum). The FWHM measured from the ThAr comparison lamp lines is 0.2 Å (at 6300 Å).
Data were reduced using standard IRAF processing tools to subtract the bias level, trim images, identify and correct “bad” pixels by means of long exposure dark frames and flat fields, and divide by a scaled flat field image (comprised of 20 spectra taken with a quartz lamp through a blue-pass filter). The minimum order separation was 10 arcsec, leaving sufficient interorder background free of contamination from starlight in order to adequately remove the (small) scattered light contribution. Cosmic ray excision was performed using lineclean.
The individual orders were extracted from the two-dimensional data to obtain one-dimensional summed spectra of the stellar and comparison lamp frames. The dispersion relation to transform from pixel to wavelength was determined from the ThAr exposures, and applied to all stellar spectra, interpolating in time over shifts in the comparison line positions on the chip through the course of a night. We verified that the resulting wavelength solutions gave correct positions of known atmospheric emission and absorption features on each spectrum. Geocentric and heliocentric Julian dates were computed, and later used to compute the corrections to the observed radial velocity due to the diurnal, monthly, and yearly motions.
3 Analysis of the photometric data: period search
Period search was performed on the differential photometry of CM Leo with respect to the reference star C3 and the full 1994-1999 photometric data-set (94 , 442 and 102 useful data points) using GRATIS (GRaphycal Analyzer TIme Series), a code developed at the Bologna Observatory (see Di Fabrizio 1998, Paper II). We used the Lomb periodogram (Lomb 1976, Scargle 1982) on a wide period interval to derive a first guess of the periodicity, then a truncated Fourier series algorithm (Barning 1963) to refine the period definition and find the best fit model. The period search employed each of the complete and data-sets. Figure 6 shows the periodograms of CM Leo and differential magnitudes with respect to star C3, obtained using the Lomb algorithm to identify the most probable frequency of the data on a wide period interval of 0.23-0.80 day. A well defined peak is present in the plots at =2.76 (P0.d362), with two lower peaks at =1.76 and =3.76 respectively, which are aliases of the actual periodicity.
| Spectrum | HJD | Error | ||
|---|---|---|---|---|
| km s-1 | km s-1 | |||
| W1 | 51223.759995 | 0.227 | 22.83 | 1.59 |
| W2 | 0.781506 | 0.286 | 25.40 | 1.90 |
| W3 | 0.802912 | 0.345 | 27.96 | 1.18 |
| W4 | 0.830009 | 0.420 | 31.04 | 1.22 |
| W5 | 0.864014 | 0.514 | 33.65 | 2.12 |
| W6 | 1.727197 | 0.901 | 11.04 | 2.99 |
| W7 | 1.741795 | 0.941 | 12.38 | 3.07 |
| W8 | 1.756334 | 0.981 | 10.42 | 2.57 |
| W9 | 1.770790 | 0.021 | 11.32 | 2.42 |
| W10 | 1.984161 | 0.611 | 35.91 | 1.90 |
| W11 | 2.009543 | 0.681 | 36.91 | 1.41 |
| W12 | 2.024329 | 0.722 | 32.72 | 2.79 |

We then reduced the interval around the most likely periodicity using the Fourier algorithm to find the best fit. The period obtained using a twelve harmonics best-fitting Fourier series on the data, a 6 harmonics series on the data, and a 5 harmonics series on the data is P=0.d3616990.000001 and the epoch of maximum light is E=2450841.362285. Calibrated light curves for CM Leo in and , based on the full photometric data-set, and phased according to these ephemerides, are shown in Figure 7.

The r.m.s. deviation from the best-fitting model is mag in , mag in and mag in I. These residuals are well accounted for by random photometric uncertainties alone (about mag in all three photometric passbands, see Section 2.1.1). The derived period agrees fairly well with that published in the GCVS4 (P=0.d361732). The amplitude of the light variation is 0.498 mag in , 0.631 in , and 0.301 in . On the basis of these amplitudes and the shape of the light curve, CM Leo is classified as a very regular first overtone RR Lyrae star. We thus confirm Paper I classification of CM Leo as a c-type RR Lyrae, at variance with the GCVS4 original classification as an ab-type RR Lyr, with amplitude about twice the present value.
4 Analysis of the spectroscopic data
4.1 The radial velocity curve
Radial velocities were measured from the wavelength calibrated spectra of CM Leo using a cross correlation technique (fxcor in IRAF). Twelve orders containing weak metal lines (the best suited to measure radial velocities) in the region from about 4400 to 5300 Å were cross-correlated against the same orders in the spectra of the radial velocity standard star HD 58923. Table 4 lists the derived heliocentric radial velocities and corresponding errors. Average precision of the radial velocity measurements is about 2 km s-1. The heliocentric phases in Table 4 were computed according to the final adopted period of pulsation and the epoch of CM Leo (P=0.d361699 and E=2450841.362285). The resulting radial velocity curve is shown in Figure 8: it has amplitude of 26.55 km s-1, and the typical shape expected for a c type RR Lyr. The systemic velocity () of CM Leo was calculated by integration of the radial velocity curve on the full pulsation cycle and corresponds to 24.47 km s-1.

4.2 The metallicity of CM Leo
Three spectra of CM Leo taken at/near minimum light (0.420 0.611) were used to measure the metal abundance of the variable. They were aligned to the same radial velocity, then summed: the coadded spectrum has signal to noise ratio at order centres of about 50 to 100 [namely: about 40 at 8400, 90 at 6000 and 5000, and 50 at 4000 Å]. We derived temperatures Teff from the dereddened and colours of CM Leo at minimum light (with =0.031 mag, and =0.040 mag from Schlegel, Finkbeiner & Davis 1998 reddening maps). Table 5 lists the dereddened and photometric colours corresponding to the three exposures of CM Leo close to minimum light, along with the corresponding temperatures as estimated from Kurucz (1993a,b) model atmosphere at [Fe/H]=2.13 and =3.00.
| Spectrum | HJD(mid exp.) | Teff | Teff | |||
|---|---|---|---|---|---|---|
| W4 | 2451223.830009 | 0.420 | 0.353 | 0.396 | 6430 | 6878 |
| W5 | 2451223.864014 | 0.514 | 0.357 | 0.409 | 6405 | 6843 |
| W10 | 2451224.984161 | 0.611 | 0.338 | 0.403 | 6515 | 6858 |
The average photometric temperature of the three spectra is T 250 K using the colour-temperature calibration and procedure of Clementini et al. (1995a)222These authors found that Kurucz (1993a,b) synthetic colours systematically overestimate stellar temperatures. This effect is larger for the and colours while almost negligible for the colour-temperature calibration which is also less metallicity dependent (Fernley 1989 and references therein). In order to correct for this effect following Clementini et al. (1995a) procedure (see their par. 3.4.2) the mean temperature derived from individual ’s was lowered by 49 K, and that from the ’s was lowered by 97 K, before averaging them together, to tie them to the -temperature calibration for RR Lyrae stars.. In principle, as an alternative approach, temperatures can also be estimated by fitting the profile of Balmer lines. However, comparisons performed in Paper II show that the temperatures derived in this way are within 100 K from the photometric ones. Since the present approach allows a direct comparison with previous results on the same scale of Clementini et al (1995a) and by-passes problems arising from the determination of the continuum region near e.g. H (see Paper II), we prefer to adopt the photometric temperature, as given above.
We first measured equivalent widths (EWs) for a number of clean lines on the coadded spectrum, using special purpose routines (Gratton 1988). Final EWs were measured adopting a relation between EW and FWHM from clean lines and a Gaussian fitting routine with only one free parameter, as fully explained in Bragaglia et al (2001b).
Table 6 gives the linelist, the assumed ’s and the measured EWs.
| Element | E.P. | EW | ||
|---|---|---|---|---|
| Fe I | 4005.24 | 1.56 | –0.57 | 70.6 |
| Fe I | 4063.59 | 1.56 | –0.08 | 98.1 |
| Fe I | 4071.74 | 1.61 | –0.02 | 97.5 |
| Fe I | 4132.06 | 1.61 | –0.63 | 65.0 |
| Fe I | 4143.87 | 1.56 | –0.44 | 83.3 |
| Fe I | 4235.95 | 2.43 | –0.34 | 42.8 |
| Fe I | 4271.77 | 1.49 | –0.16 | 97.9 |
| Fe I | 4375.94 | 0.00 | –3.03 | 35.0 |
| Fe I | 4415.13 | 1.61 | –0.61 | 73.3 |
| Fe I | 4427.32 | 0.05 | –3.04 | 18.9 |
| Fe I | 4447.73 | 2.22 | –1.34 | 17.7 |
Note - Table 6 is presented in its entirety at the CDS. A portion is shown here for guidance regarding its form and content.
Standard spectroscopic abundance constraints (abundance results from Fe I lines which show no trends with either expected line strength or excitation or ionization state), were easily satisfied in the analysis, confirming the adopted photometric temperature and surface gravity, and providing the microturbulent velocity. We obtained average abundances of [Fe/H]= (=0.12 dex) from 21 Fe I lines, and [Fe/H]= (=0.21 dex) from 10 Fe II lines, using a stellar atmosphere model with the following parameters: T K, a surface gravity of , and a microturbulent velocity of km s-1.
Figure 9 shows the comparison of the spectrum of CM Leo, near the Mg b lines, to the spectrum of CU Com, a double mode RR Lyr observed on the same run (Paper II), with [Fe/H]=2.38, and whose lines appear, indeed, shallower.

Uncertainties in the derived abundances are mainly due to possible errors in the atmospheric parameters ( 100 K in Teff, 0.3 dex in , 0.5 km s-1 in Vt, and 0.2 dex in [A/H]) and on the adopted model atmospheres (Kurucz 1993a,b). Our estimate of the random error contribution (including errors in measuring individual lines) is 0.15 dex. Thus, our conservative estimate of the metallicity and of the total error for CM Leo is [Fe/H]=. This metallicity is on the same scale of Carretta & Gratton (1997) and Clementini et al. (1995a) for RR Lyrae variables. Table 7 shows the abundance ratios with respect to iron derived for a few other elements. O, Na, and Al abundances include corrections for departure from LTE, and Mn and Ba abundances include effects of the hyperfine structure. We find a large deficiency of Mn and Ba with respect to iron, and an overabundance of -elements ranging from about 0.3 up to 0.8 dex for oxygen which appears to be particularly overabundant in this star. We point out that large oxygen overabundances were found by Clementini et al. (1995a) for three other RR Lyrae stars with [Fe/H] dex.
| Element | (log n)⊙ | Nr | ||
| FeI | 7.50 | 21 | -1.94 | 0.12 |
| FeII | 7.44 | 10 | -1.92 | 0.21 |
| Element | (log n)⊙ | Nr | ||
| 8.73 | 2 | 0.82 | 0.03 | |
| 6.23 | 1 | -0.13 | 0.12 | |
| 7.48 | 4 | 0.58 | 0.09 | |
| 6.23 | 2 | 0.42 | 0.12 | |
| 6.18 | 4 | 0.40 | 0.19 | |
| 3.10 | 5 | 0.41 | 0.26 | |
| 5.14 | 11 | 0.36 | 0.23 | |
| 5.63 | 3 | 0.13 | 0.10 | |
| 5.29 | 3 | -0.40 | 0.20 | |
| 2.88 | 2 | 0.34 | 0.07 | |
| 2.34 | 2 | -0.71 | 0.19 |
5 The modeling of the light and radial velocity curves
We have compared the observed periodic variations of light and radial velocity with the theoretical predictions of models based on the solution of the nonlinear hydrodynamical equations, including a non local and time dependent treatment of convective transfer (Bono et al. 1997, Bono, Castellani & Marconi 2000, hereinafter BCM). These models not only reproduce the complete topology of the RR Lyrae instability strip but also predict the detailed morphology of light and radial velocity curves. As recently shown by BCM in the case of the RRc U Comae, the predictive capability of current models has been tested by reproducing the luminosity variations of the pulsator along a full pulsation cycle. This approach, due to the sensitivity of the predicted period and light curve morphology to stellar parameters, supplies tight constraints on stellar mass, effective temperature, intrinsic luminosity and, in turn, distance modulus. To this aim we have applied a similar analysis to the observed multiband light curve and radial velocity curve of CM Leo. We built pulsation models based on the same physical and numerical assumptions as in BCM but for the observed metal abundance Z=0.0002 and an assumed helium content Y=0.24. The input mass, luminosity and effective temperature were varied in order to simultaneously reproduce the observed period (P=0.d3617), the band amplitude (A0.5 mag) and light curve morphology. As extensively discussed by Bono & Stellingwerf (1994), Bono, Caputo, Castellani & Marconi (1997), at fixed metallicity the details of predicted light variations along a pulsation cycle mainly depend on the adopted luminosity and effective temperature with a marginal sensitivity to the input stellar mass. In particular for Z in the range 0.0001-0.001 the double maximum, almost sinusoidal shape characterizing both CM Leo and U Comae, is typical of hot (6800 K 7100 K) high luminosity (1.7 ) first overtone models. Moreover the amplitude of first overtone models increases with the stellar mass, at fixed effective temperature (see also BCM). Finally, as simply inferred by Ritter’s equation between the pulsation period and the mean density , combined with Stephan-Boltzman’s law, and more accurately predicted by nonlinear convective pulsation models (Bono et al. 1997), the period is correlated with the luminosity and anticorrelated with both the effective temperature and the stellar mass. All these dependencies significantly restrict the parameter space and allow us to single out the model that best reproduces the observed behaviour of CM Leo. Such a best fit model is overplotted to the observed band light curve in Figure 10 (top right panel).
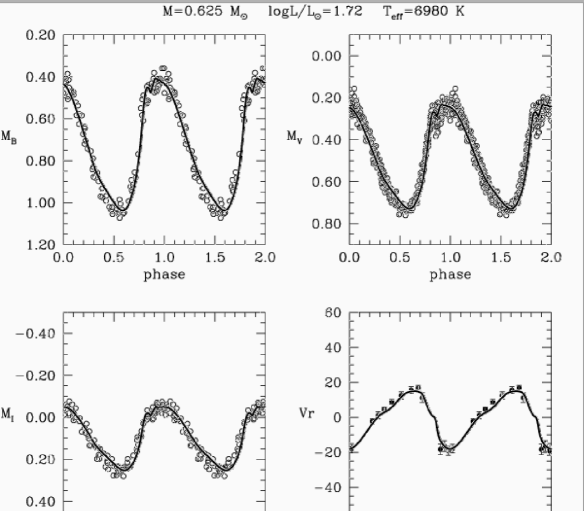
The intrinsic stellar parameters are labeled and the corresponding apparent distance modulus is mag. By assuming =0.03 mag and (Schlegel et al. 1998), we obtain a true distance modulus mag. The same model also reproduces the (top left panel) and (bottom left panel) light curves for the same , at least within the photometric uncertainties (). The agreement in different bands testifies that the colours of the best fit model well reproduce the intrinsic colours of CM Leo. The bottom right panel of Figure 10 shows the comparison between the observed and predicted radial velocity curves when a baricenter velocity of 24.47 Km/s velocity and a projection factor333The projection factor is the conversion term from radial to effective pulsation velocity, taking into account the geometrical projection of stellar velocity fields corrected for limb darkening effects. of 1.36 are adopted. The agreement is remarkable within the uncertainties on individual data points. As discussed by BCM, the morphology of radial velocity curves is more sensitive than the light variations to the details of the coupling between dynamical and convective motions within a pulsating star. Therefore the agreement found in Figure 10 confirms the high predictive capability of current pulsation theory.
6 Discussion and conclusions
CM Leo is a very regular first overtone RR Lyrae (RRc) with period P=0.d361699, epoch E=2450841.d362285, a prominent hump on the raising branch of its light curves, and metal abundance [Fe/H]=1.93 . Final results as well as the average quantities derived for the star from our photometric, pulsational and spectroscopic analyses are summarized in Table 8.
We have shown that the irregularities found by Clementini et al. (1995b) in the light curve of CM Leo disappear when star C3 is used as comparison star, since they were in fact produced by variations of about 0.1 mag in the light of the reference star used in Paper I (star C1). The true distance modulus 0.02 mag we derive for CM Leo leads to a distance from the Galactic disc444The distance from the galactic plane almost coincides with the distance from the Sun since CM Leo is located in the direction of the Galactic pole. of kpc. This distance is fully consistent with the rather low metallicity we found for the star, thus removing the previously reported metallicity-distance anomaly of CM Leo. We recall that a similar result was found also for CU Com (see Paper II).
RR Lyrae stars are known to be powerful standard candles through their absolute magnitude that is only slightly dependent on metal abundance. A pulsational estimate of the absolute magnitude of an RR Lyrae star provides an independent calibration of these standard candles and can thus be used to infer the distance of any other stellar system where RR Lyrae’s are found, the Large Magellanic Cloud in particular. The absolute magnitude we derive for CM Leo from the modeling of the multicolour light and radial velocity curves is MV=0.470.04 mag, where the error includes the random uncertainty contributions of the photometry (0.03 mag), and of the fitting with the theoretical pulsational models (0.02 mag in distance modulus and 0.01 mag in , respectively).
| Type | RRc |
|---|---|
| Epoch | 2450841.d362285 |
| P | 0.d361699 0.000001 |
| 13.66 | |
| 13.97 | |
| 13.32 | |
| 0.31 | |
| 0.34 | |
| 0.498 | |
| 0.631 | |
| 0.301 | |
| 26.55 km s-1 | |
| 24.47 km s-1 | |
| MV | 0.47 |
| 13.11 |
Allowing for an evolution of about 0.08 mag off the Zero Age Horizontal Branch for the RR Lyrae stars, as suggested by Caputo & Degl’Innocenti (1995), and Caloi, D’Antona & Mazzitelli (1997), and a slope of 0.2 mag/dex for the luminosity-metallicity relation of RR Lyrae’s to correct CM Leo absolute magnitude to the average metal abundance of the RR Lyrae in the Large Magellanic Cloud ([Fe/H]=1.50: Alcock et al. 1996, Bragaglia et al. 2001a), the absolute magnitude we derive for CM Leo implies a value for the true distance modulus of the LMC of (LMC) = 18.430.06 mag, for an average dereddened luminosity of the RR Lyrae in the LMC bar =19.070.05 (Clementini et al. 2001), in better agreement with the long astronomical distance scale.
ACKNOWLEDGEMENTS
This paper is based on observations obtained with the 1.52 m telescope of the Bologna Observatory in Loiano, the Michigan State University 60 cm telescope, and the 2.7 m telescope of the McDonald Observatory. This work was partially funded by MURST-Cofin00 under the project “Stellar Observables of Cosmological Relevance”. SDT was partially supported with an Italian CNAA fellowship at the University of Texas at Austin. She thanks all the Texas Staff for the warm hospitality. III gratefully acknowledges support from Continuing Fellowships at the University of Texas at Austin. HAS thanks C. Wilkinson for assistance in obtaining the 1998 MSU observations and thanks the US National Science Foundation for support under grant AST9986943. CS is happy to acknowledge that this research was partially funded by NSF grants, most recently AST9987162.
We warmly thank Raffaele Gratton for interesting suggestions and support.
References
- [1] Alcock et al. (The MACHO collaboration) 1996, AJ, 111, 1146
- [2] Barning, F.J.M. 1963, Bull. Astron. Inst. Netherlands, 17, 22
- [3] Blazhko, S. 1907, Astron. Nachr., 175, 325
- [4] Bono, G., Caputo, F., Castellani, V., Marconi M. 1997, A&AS, 121, 327
- [5] Bono, G., Stellingwerf, R.F. 1994, ApJS, 93, 233
- [6] Bono, G., Castellani, V., Marconi M. 2000, ApJ, 532, L129 (BCM)
- [7] Bragaglia, A., Gratton, R.G., Carretta, E., Clementini, G., Di Fabrizio, L. 2001a, AJ, 122, 219
- [8] Bragaglia, A., et al. 2001b, AJ, 121, 327
- [9] Caloi, V., D’Antona, F., Mazzitelli, I. 1997, A&A, 320, 823
- [10] Caputo, F., Degl’Innocenti, S. 1995, A&A, 298, 833
- [11] Carretta, E., Gratton R.G. 1997, A&AS, 121, 95
- [12] Castellani, V., Maceroni, C., Tosi, M. 1983, A&A, 128, 64
- [13] Clementini, G., Carretta, E., Gratton, R.G., Merighi, R., Mould, J.R., McCarthy, J.K. 1995a, AJ, 110, 2319
- [14] Clementini, G., Tosi, M., Bragaglia, A., Merighi, R., Maceroni, C. 1995b, MNRAS, 275, 929 (Paper I)
- [15] Clementini, G., Gratton, R.G., Bragaglia, A., Carretta, E., Di Fabrizio, L., Maio, M., 2001, AJ, submitted, astro-ph/0007471
- [16] Clementini, G., Di Tomaso, S., Di Fabrizio, L., Bragaglia, A., Merighi, R., Tosi, M., Carretta, E., Gratton, R.G., Ivans, I.I., Kinard, A., Marconi, M., Smith, H.A., Wilhelm, R., Woodruff, T., Sneden, C. 2000, AJ, 120, 2054 (Paper II)
- [17] Di Fabrizio, L. 1998, Laurea thesis, Univ. Bologna
- [18] Fernley, J.A. 1989, MNRAS, 239, 905
- [19] Gratton, R.G. 1988, Rome Obs. Prepr. Ser. 29
- [20] Kholopov, P.N., et al. 1985, General Catalog of Variable Stars, IV ed. (Moscow; GCVS4)
- [21] Kurucz, R.L. 1993a, CD-ROM 13, ATLAS9 Stellar Atmosphere Programs and 2 km/s Grid (Cambridge: Smithsonian Astrophys. Obs.)
- [22] Kurucz, R.L. 1993b, CD-ROM 18, SYNTHE Spectrum Synthesys Progams and Line Data (Cambridge: Smithsonian Astrophys. Obs.)
- [23] Landolt, A.U. 1983, AJ, 88, 439
- [24] Landolt, A.U. 1992, AJ, 104, 340
- [25] Lomb, N.R. 1976, Ap&SS, 39, 447
- [26] Olech, A,. Kaluzny, J., Thompson, I.B., Pych, W., Krzeminski, W. Shwarzenberg-Czerny, A. 1999, AJ, 118, 442
- [27] Scargle, J.D. 1982, ApJ, 263, 835
- [28] Schlegel, D.J., Finkbeiner, D.P., Davis, M. 1998, ApJ, 500, 525
- [29] Tull, R.G., MacQueen, P.J., Sneden, C., Lambert, D.L. 1995, PASP, 107, 251
- [30] Wilson, R.F. 1953, General Catalogue of Stellar radial velocities, Carnegie Institution of Washington Publ. 601, Washington D.C.