Young massive stars in the ISOGAL survey ††thanks: This is paper no. 11 in a refereed journal based on data from the ISOGAL project,††thanks: Based on observations with ISO, an ESA project with instruments funded by ESA Member States (especially the PI countries: France, Germany, the Netherlands and the United Kingdom) and with the participation of ISAS and NASA,††thanks: Table 3 is only available in electronic form at the CDS via anonymous ftp to cdsarc.u-strasbg.fr (130.79.128.5) or via http://cdsweb.u-strasbg.fr/cgi-bin/qcat?J/A+A/
The 7 and 15 m observations of selected fields in the Galactic Plane obtained with ISOCAM during the ISOGAL program offer an unique possibility to search for previously unknown YSOs, undetected by IRAS because of lower sensitivity or confusion problems. In a previous paper (Felli et al. FCTOS00 (2000)) we established criteria of general validity to select YSOs from the much larger population of Post Main Sequence (Post-MS) stars present in the ISOGAL fields by comparing radio and IR observations of five fields located at l+45∘. The selection was based primarily on the position of the point sources in the [15] - [7]–[15] diagram, which involves only ISOGAL data and allows to find possible YSOs using the survey data alone. In the present work we revise the adopted criteria by comparing radio-identified UC HII regions and ISOGAL observations over a much larger region. The main indications of the previous analysis are confirmed, but the criteria for selecting YSO candidates had to be revised to select only bright objects, in order to limit the contamination of the sample by Post-MS stars. The revised criteria ([15]4.5, [7]–[15]1.8) are then used to extract YSO candidates from the ISOGAL Point Source Catalogue in preparation. We select a total of 715 YSO candidates, corresponding to 2% of the sources with good detections at 7 and 15 m. The results are presented in a table form that provides an unique input list of small diameter, ″, Galactic YSO candidates. The global properties of the sample of YSO candidates are briefly discussed.
Key Words.:
Stars:formation - HII regions - Galaxy:structure - Infrared:stars1 Introduction
The first steps of star formation are the pre-stellar and proto-stellar phases, corresponding to the fragmentation and the gravitational collapse of a dense core in a molecular cloud, before a formed star appears. The IR spectrum of pre- and proto-stellar cloud cores originates from a very cool dust envelope, and they are observed in absorption against the diffuse background at 7 and 15 m (Molinari et al. MTBCP (1998), Bacmann et al. BAPABW (2000)). Some of the infrared dark clouds detected by the ISOGAL and MSX surveys may indeed be the same type of objects (Pérault et al. Pea96 (1996); Carey et al. Cea98 (1998)).
The next step is commonly referred to as Young Stellar Object (YSO), to indicate the phase when the formed star is deeply embedded in a thick dusty envelope, or when it is hidden by an optically thick disk, remnants of the molecular cloud from which it was formed. This envelope or disk absorbs all the stellar radiation, making the YSO undetectable in the visible range, and re-emits in the IR, thus making it shine as a bright IR source.
YSOs may have widely different luminosities and masses, ranging from a fraction of a solar mass to 100 solar masses. The YSOs associated with the earliest spectral type stars (earlier than B3) can be searched both in the radio continuum, where the ionised gas of the Ultra Compact HII region (UC HII) produces free-free emission, and in the Middle and Far IR (MIR and FIR, respectively), where the dust emits. Very bright UC HII regions have been extensively studied (see e.g. Churchwell C91 (1991) for a review) and models have been developed to explain the Spectral Energy Distribution (SED) and the spatial morphology of the emission at different wavelengths (Scoville & Kwan SK76 (1976), Rowan-Robinson RR80 (1980), Churchwell et al. CWW90 (1990), Ivezić & Elitzur IE97 (1997), Faison et al. FCHHLR98 (1998), Miroshnichenko et al. MIVE (1999), Feldt et al. Fea99 (1999)).
YSOs associated with later spectral type stars (later than B3) can only be detected in the FIR (and sub-mm) thanks to dust emission, as the radio emission decreases sharply since the star doesn’t supply enough Lyman continuum photons. When the YSO becomes visible in the optical range, with a luminosity in the range 10 to 103 L⊙, it is called Herbig Ae/Be star. The IR excess comes from a disk, an envelope or a combination of the two (see e.g. Berrilli et al. BCILNS92 (1992), Hillenbrand et al. HSVK92 (1992), Pezzuto et al. PSL97 (1997)). At lower luminosity (of the order of one L⊙) an evolutionary track is now well established, going from Class I objects, with considerable IR emission, to class II, when a T Tauri star becomes visible in the optical range but is still surrounded by a disk, and finally to class III when the stellar photosphere becomes visible (André et al. AWTB93 (1993); Lada & Wilking LW84 (1984); Lada LADA87 (1987); Lada Lada99 (1999) and Natta Natta99 (1999) for recent review papers).
Finally, YSOs with masses in the brown dwarf range have now been detected in the MIR (Olofsson et al. Olofsson99 (1999); Persi et al. Pea00 (2000); Comerón et al. CNK00 (2000)). The IR properties of these objects are similar to those of more massive YSOs, suggesting that also in these cases the MIR emission is produced by a circumstellar disk (Natta & Testi NT01 (2001), Testi et al. Tea02 (2002)). Indeed, even though the spread of luminosities is very large, all these types of YSOs show rather similar SEDs in the IR range, because both the emission mechanism (re-radiation at lower temperature of the stellar emission absorbed by the dust) and the geometry of the dust components are similar. Thus the colours depend mainly on the overall optical depth in the dust but not on the stellar luminosity (Ivezić & Elitzur IE97 (1997)). In particular, the systematic study of nearby star forming regions in the frame of the ISOCAM guaranteed time program (Nordh et al. Nordh96 (1996), Bontemps et al. Bont01 (2001) and references therein) have shown that, especially for low mass YSOs, there is a clear cut between dusty YSOs of class I and II and the young stars without much dust (class III) at Log10[S15/S7] = –0.2, i.e. [7]–[15] = 1.1.
The ISOCAM observations of the Galactic Plane carried out during the ISOGAL program offer an unique opportunity for an unbiased search of YSOs. However, their identification requires to be able to separate them from the much larger population of Post-MS stars in the Galactic Plane, which also have some IR excess due to dust in a circumstellar envelope produced by mass loss, but are in an entirely different evolutionary stage.
In a previous work (Felli et al. FCTOS00 (2000), hereafter Paper II) a comparison between Very Large Array 3.6 and 6 cm radio continuum observations (Testi et al. TFT99 (1999), hereafter Paper I) and ISOGAL observations of five Galactic fields at l +45∘, in the two broad band filters LW2 (5.5-8.5 m) and LW3 (12-18 m) was used to establish general criteria that allow the identification of YSOs. These criteria were then used to extract the YSOs from the preliminary lists of ISOGAL sources in those fields.
In the present paper we extend the comparison between UC HII regions (or massive YSOs) identified in the radio continuum and ISOGAL observations to a much larger region of the Galactic Plane covered uniformly with the Very Large Array at 6 cm by the BWHZ survey (Becker et al. bec94 (1994)). The much larger sample of radio-identified YSOs allows a better refinement of the identification criteria. In Section 6 the revised criteria are then used to extract the YSOs from the ISOGAL Point Source Catalogue (Omont et al. in preparation, Schuller et al. in preparation). Finally, the galactic distribution and global properties of this sample are briefly discussed.
2 The ISOGAL Catalogue
2.1 The ISOGAL Data
The ISOGAL survey (Omont et al. in preparation) is a large set of Mid-IR images, which have been observed with the ISOCAM camera on board the European satellite ISO, using filters centred at 7 m (LW2, LW5 and LW6) and 15 m (LW3 and LW9), with a pixel scale of usually 6″ and sometimes 3″ field of view. The spatial resolution of the ISO satellite was 3″ at 7 m and 6″ at 15 m. In total, more than 15 square degrees of sky have been mapped, mostly in the Galactic disk, with galactic latitude in the 1∘ range. A few fields at high galactic latitude were also included in the survey. Since we don’t expect many YSOs in these regions far from the Galactic Plane, they will be used in the present analysis mainly as checks of the results on identification of YSOs in the Galactic Plane.
A point spread function (PSF) fitting algorithm has been used to extract the sources from the images (see the ISOGAL Explanatory Supplement, Schuller et al. in preparation for details on the used procedures and on the quality checks that have been achieved). Crowding and blending effects can become significant and result in misleading photometry for relatively faint sources in fields with high source density, therefore strong photometric cuts have been applied to the initial catalogue of extracted sources, primarily based on the results of artificial stars simulations (see Schuller et al. in preparation). Then, a cross-identification between 7 m and 15 m positions has been done using a correlation radius of two pixels, to avoid missing identifications for slightly extended sources, as can be the case for strong YSOs, for which the 7 m and 15 m ISOGAL positions may refer to different peaks.
The internal consistency of the photometry is guaranteed by the use of a fixed PSF to extract all the sources with a given observational setup (filter and pixel size), and an absolute flux density calibration has then been performed by comparing the extracted fluxes with the predicted ones (M. Cohen, private communication) for four stars in the Hipparcos catalogue with known spectral types and luminosities, and by comparison between the ISOGAL and MSX (Price et al. MSX (2001)) magnitudes for a large number of point sources. As a result, the photometry should not be biased by more than 0.1 magnitude, except maybe 0.2 magnitude for the faintest sources in the catalogue, with a typical standard deviation of 0.15–0.2 magnitude, and the completeness level should remain above 50% down to the used limit magnitudes (see Section 2.4.3 and Schuller et al. in preparation for details). This limit ranges from magnitude 8.2 near the Galactic Centre to 10.1 in low-density fields at 7 m, and from 7.0 to 8.8 at 15 m. The corresponding limit flux densities, using the zero point fluxes as reported in Paper II, range from 6 mJy to 28 mJy at 15 m, and from 8 mJy to 35 mJy at 7 m, where the effects of crowding are more severe.
The total area covered by ISOGAL is divided into three types of fields: 1) fields of type A observed only at 7 m, 2) fields of type B observed only at 15 m, 3) fields of type C observed at 7 and 15 m; only in this case a non-detection in either band can be used as an upper limit, with the exception of extended sources as explained in Section 2.3. The area covered only at 7 (2.1 deg2) or only at 15 m (2.7 deg2) is non-negligible with respect to that covered at both wavelengths (10.7 deg2). In the A and B fields the [7]–[15] colour criterion cannot be used. Considering that only the reddest sources are good YSO candidates, we will retain only the C fields where the red and bright at 15 m sources might be YSOs in our analysis. The regions of the Galactic Plane covered by ISOGAL are located in a randomly sampled strip with latitude extension of about 1∘ and extending from l = -60∘ to l = 140∘. The distribution in galactic coordinates of the observed fields of type C is shown in Fig. 1.
2.2 The DENIS Data
The sources in the +2∘ range have also been associated with the DENIS database (Epchtein et al. DENIS (1994)) with a search radius roughly equal to one ISOCAM pixel. The DENIS source density has been limited by cuts based on the Ks magnitudes, in order to limit the fraction of spurious associations to a few percents. Most of the DENIS data come from special dedicated DENIS observations, for which the source extraction has been performed by the ISOGAL team at Observatoire de Paris (G. Simon, private communication), and the astrometry has been matched with the USNO-A2.0 catalogue, which has an accuracy of typically 0.25” (Stone et al. USNO (1999)). As the internal astrometric accuracy of the DENIS catalogue is better than 0.5” (Epchtein et al. DENIS2 (1999)), the resulting uncertainty of the DENIS positions should be at most 0.7”. For the ISOGAL fields within the DENIS coverage, the mid-infrared astrometry has been tied to the more accurate near infrared survey. Nevertheless, the cross-identification between ISOGAL and DENIS sources has shown that the offset between the two databases can reach 10″, mainly due to the uncertainty in the position of the filter wheel in ISOCAM, so that the astrometric uncertainty in fields without DENIS counterpart (in galactic coordinates, this corresponds roughly to l+35∘) can reach this value. The associations with DENIS data may also be limited for the brightest sources, because of saturation problems, which occurs at K6. Such strong sources could not be properly extracted and included in the DENIS catalogue.
2.3 Intrinsic limitation of the ISOGAL-PSC
One basic limitation to the list of YSO candidates that we shall present comes from the ISOCAM observations themselves: in order to avoid saturation effects, the ISOGAL fields were designed to exclude strong IRAS sources. No IRAS source with F12μm 6 Jy should be present in the ISOGAL fields observed with broad band filters LW2 and LW3 (however, such a condition has been relaxed in a few regions of star formation and in the vicinity of the Galactic Centre, observed with the narrower band filters: LW5, LW6 and LW9). Consequently, the input lists will contain only sources with relatively low flux densities, not accessible by IRAS, namely from the 10 mJy limit of the ISOGAL data at 15 m to the upper limit quoted above, and only a few brighter sources (up to 35 Jy at 15 m) in the ISOGAL fields which were observed with narrow filters.
Another intrinsic limitation of the PSC is that by definition it contains only point sources and sources with small extension, while YSOs might also be significantly extended, as it will be discussed in Section 4.2 and 4.3 from the inspection of ISOGAL images of radio identified YSOs. This may introduce an error on the 7 and 15 m flux densities of extended YSOs, and aperture photometry on slightly extended sources has shown that the PSF extracted magnitude can be underestimated by about one magnitude. Moreover, sources that cannot be properly modelled with an unresolved component (i.e. extended sources) are rejected by the source extraction algorithm and don’t appear in the PSC.

2.4 Differences in the ISOGAL data used in Paper II
In this section we want to stress the main differences in the ISOGAL PSC with respect to the preliminary version that we used in Paper II. Two main improvements have been achieved, concerning the photometric calibration and the reliability of the sources, which is related to the applied photometric and geometric cuts.
2.4.1 Photometric calibration
A careful analysis of the biases in the extracted fluxes, mainly due to a non complete stabilisation of the signal because of short integration times, and to an incomplete recovery of the flux density inherent to PSF fitting procedures, as well as an absolute calibration with standard stars and with other MIR surveys resulted in a correction of all extracted magnitudes by a constant -0.45 magnitude offset (see Schuller et al. in preparation). This means that the colour criterion that we derived in Paper II is still relevant, but the magnitudes from the present ISOGAL PSC are 0.45 mag brighter than in the preliminary version. As we also decided to limit our analysis to bright YSO candidates, in order to reduce the contamination of our sample by evolved stars, we will derive new criteria based on the [7]–[15] colour and on the 15 m magnitude, the latter one being not directly comparable with the results of Paper II.
2.4.2 Geometric cuts
The ISO observed rasters have saw-tooth shaped edges due to the different orientations of the raster (along the galactic axis) and of the individual ISOCAM images (aligned with the satellite axis, which match the equatorial referential). Additionally, the 7 and 15 m observations of a given field do not perfectly match. Moreover, the source extraction procedure cannot work properly for a source too close to the edge of the image, because it needs a frame of pixels at least as large as the PSF representation. Therefore, conservative limits have been derived for each field, given the constraints that the retained area must be completely observed and at least at 2 pixels from the edges at both wavelengths, and should be rectangular regions aligned along the galactic coordinates. The public version of the ISOGAL PSC contains all the sources inside and outside these limits, but as the colour criterion cannot be trustfully applied in the outside region, we will limit our analysis to the formal field limits.
2.4.3 Photometric cuts
The other drastic difference in the ISOGAL PSC comes from the results of artificial source simulations (details can be read in Schuller et al. in preparation) whose purpose was to limit the published catalogue to reliable sources (this means, to discard spurious sources and sources with too much biased photometry) and to provide a catalogue about 50% complete down to its faint end. The net result is that about 25% of the extracted sources have been discarded from the catalogues before the cross identification between 7 and 15 m took place, this fraction being highly dependent on the source density in the field and ranging between zero and almost 50%.
3 The BWHZ sample and its FIR properties
3.1 The 6 cm BWHZ Galactic Plane radio survey
BWHZ observed the inner Galaxy (b 0.4∘, l = 350∘-40∘) at 5 GHz with the VLA down to a limiting sensitivity of 2.5 mJy and with an angular resolution of 4″. Extended structures (greater than 100″) were filtered out by the instrument and reduction procedure. The same region had also been observed at 1.4 GHz by Zoonematkermani et al. ZHB90 (1990), Becker et al. BWMHZ90 (1990), White, Becker & Helfand WBH91 (1991) and Helfand et al. HZBW92 (1992) with a maximum angular resolution of 5″.
The 5 GHz survey resulted in a catalogue of 1272 small diameter discrete sources of which 450 were tentatively classified as UC HII regions using different classification criteria.
The largest and most reliable number of identifications are 291 radio sources matching 246 IRAS sources with UC HII regions colours (Wood & Churchwell WC89 (1989), hereafter WC89) plus 17 radio-IR matches with similar colours, slightly outside the formal survey boundaries, for a total of 308 small diameter radio sources (and 263 IRAS sources). The strict WC89 colour-colour criteria were used for “secure” identification (Log10(F60μm/F 1.3 and Log10(F25μm/F 0.57) and slightly larger criteria for “candidate” HII regions (Log10(F60μm/F 1.05 and Log10(F25μm/F 0.25). Also sources that satisfy the WC89 colour-colour criteria as well as that for planetary nebulae but have F 60 Jy (or F 100 Jy using the “candidate” criteria) were classified as UC HII regions. The situation is summarised in Fig. 2 where the [25–12]-[60–12] and [25–12]-[60–25] colours of the 263 IRAS sources with one or more radio components are reported.

Most of the 263 IRAS sources (74%) are in the WC89 box, a consistent fraction (18%) in the “candidate” region and a minor fraction (8%) outside. In this last case all sources have at least an upper limit in one IRAS band. However, we note that only 159 IRAS sources of the BWHZ sample fully satisfy the WC89 criteria, i.e. no upper limits at 25 and 60 m and colours within the WC89 box.
The fact that more than one compact radio component is associated with a single IRAS source is not a new finding. HII regions are usually very structured and often have several small diameter components all clustered in an area of few tens of arcsec, i.e. well within the resolution of the IRAS beam. In some cases they are indeed independent HII regions and in VLA radio surveys of HII regions (Wood & Churchwell WC89s (1989) and Kurtz, Churchwell & Wood KCW (1994)) the percentage of irregular or multiple-peaked sources is 18%, in very good agreement with the present situation: (308 -263)/263 = 17%.
Two other criteria are used by BWHZ to reach the 450 putable HII regions: the radio spectral index and the galactic latitude distribution. There are 84 sources which were observed both at 5 and 1.4 GHz and which have a thermal spectral index but do not have an IRAS counterpart (out of 220 detected at both wavelengths and with a thermal spectral index). Their galactic latitude distribution peaks toward the Galactic Plane and further supports their Galactic nature.
Finally, the galactic latitude distribution of all the remaining unidentified radio sources (i.e. without an IRAS counterpart or with no spectral index information) still shows a clear excess toward the Galactic Plane and cannot be background extragalactic sources. This leads to an estimated 90 additional thermal Galactic sources, which however cannot be identified individually with only the BWHZ observations.
3.2 Relation Fradio-FFIR
In the present section we examine the expected relation between radio and MIR flux densities for UC HII regions, both from observations and theory. This relationship will be needed in the following as an additional tool to discriminate between late type stars and YSO candidates in the ISOGAL PSC. For this purpose we shall use the 263 IRAS sources in the BWHZ list of UC HII regions. When more than one radio component is associated with the same IRAS source, we simply added up the radio flux densities.
Fig. 3 shows F5GHz versus FFIR for the 263 IRAS selected UC HII regions of the BWHZ sample. The spread of the points is very large and comes from the fact that we are mixing stars of different spectral types, but a general correlation between the two fluxes can be noted. In two plots, the 12 m and 100 m, a clear deviation from a linear correlation can also be noted. In Table 1 we give the mean value at each IRAS band of the FIR over the radio emission (both in Jy), which shows a very rapid increase with wavelength up to a maximum at 100 m (more than four orders of magnitude). The linear interpolation at 15 m indicates that F15μm is about two orders of magnitude greater than F5GHz. A similar value was derived by Churchwell et al. CWW90 (1990) from a model fit of the SED of G5.89-0.39, a dust cocoon surrounding an O6 ZAMS star. While this flux ratio is amply compensated by the lower sensitivity of IRAS with respect to radio surveys, with ISO, which has a sensitivity comparable to that of radio surveys, we should be able to observe many YSOs which are undetected in the radio.
| /m | LogFFIR - LogF5GHz | |
|---|---|---|
| 12 | 1.86 | 0.52 |
| 25 | 2.62 | 0.53 |
| 60 | 3.70 | 0.51 |
| 100 | 4.05 | 0.57 |

The radio emission from a spherical, homogeneous, optically thin HII region is proportional to the stellar ionising photon flux NL. At 5 GHz, assuming an electron temperature of 104 K, we have:
F5GHz/Jy = 1.1285 10-47 NL [D/kpc]-2
where is the fraction of NL that goes into ionization of the gas (in an ionization bounded dusty HII region (1 - )NL photons are absorbed by dust), and D is the distance. According to WC89, is, on the average, very small, about 16% for a sub-sample of 19 sources for which was estimated. Such a small value of is explained by WC89 as an evolutionary effect, i.e. the sample selects preferentially young HII regions ionised by stars with very early spectral type. In fact, dust absorption in the Lyman continuum increases with electron density (hence with youth of the region) and is stronger for earlier spectral type stars (see e.g Figure 2 of Felli felli (1979)). However, a more simple alternative solution for such small values of could be the result of missing radio flux density, i.e. that of extended envelopes surrounding the more compact structures, which are filtered out in the interferometric observations. This is probably the most plausible explanation, as also pointed out by Kim and Koo (kk (2001)) from a comparison of radio flux densities of UC HII regions obtained with high and low resolution. For our purposes we shall use .
The FIR emission is proportional to the total stellar luminosity L. In order to derive the constant of proportionality between FFIR and L we use the mean value of the ratio L/(FFIRD2) for the sources of the WC89 sample that do not have upper limits in the IRAS bands. The values of L/(FFIR D2) in the four IRAS bands are given in Table 2. At 10 m Walsh et al. (wbbn (2001)) from 5 UC HII regions find L/(FFIR D2) = 2080 L⊙ Jy-1 for D = 1 kpc, with a rather large uncertainty. A linear fit to all these values gives L/(FFIR D2) 300 L⊙ Jy-1 kpc-2 at 15 m.
The expected values of F5GHz and FFIR for UC HII regions ionised by single stars of different spectral type can be derived from the tabulation of Panagia pan (1973) which gives NL and L for stars of early spectral type (from O4 to B3); ZAMS values were used. Ionization of the UC HII region by a stellar cluster rather than by a single star have also been considered (Walsh et al. wbbn (2001)) and the relationships between F5GHz and FFIR are slightly different.
| /m | L/(FFIR D2) /L⊙ Jy-1 kpc-2 | |
|---|---|---|
| 12 | 332.2 | 444.0 |
| 25 | 32.47 | 22.86 |
| 60 | 3.339 | 0.439 |
| 100 | 1.691 | 0.368 |
In Fig. 3 we show for the four IRAS bands the expected relation between the 5 GHz flux density and the FIR flux for single stars, overlaid on the observed points for the BWHZ sample. The match with the observations is satisfactory. The three curves are for Log(D2/kpc2) = 0, 1 and 2 from top to bottom. The lower curve (10 kpc) delimits well the lower distribution of points, an effect due to a combination of the edge of our galaxy and the sensitivity limits of radio observations. In the single-star approximation, points above the upper curve should be closer than 1 kpc.
It is clear from this figure that the observed spread of points and the shape of the correlation are due to a combination of different distances, which moves the points along the bottom-left top-right diagonal, and of the presence of stars of different spectral type and luminosity, which moves the points along the drawn lines. These lines become steeper and closer to the diagonal, and hence the two effect are indistinguishable for very early spectral types (earlier than O7).
4 ISOGAL counterparts to BWHZ sources
In this section we will use the comparison of the ISOGAL-PSC data with the radio continuum 5 GHz survey of BWHZ to check the criteria developed in papers I and II to separate in the ISOGAL-PSC the YSOs from the much larger population of Post-MS stars. The comparison with the radio survey will allow to refine the criteria to select relatively luminous YSOs, those capable to ionise the surrounding material, and to produce a detectable radio continuum flux.
The design of the Galactic Plane coverage in the BWHZ and ISOGAL surveys were bound to very different instrumental and scientific constraints. The radio survey was aimed at the complete, and uniform coverage of a large longitude and narrow latitude range of the portion of the inner Galactic Plane visible from the Very Large Array, with the aim of detecting a complete sample of young massive stars, through the radio continuum emission of the surrounding ionised gas. As a byproduct, a significant number of planetary nebulae, supernova remnant and a minor fraction of radio stars and background radio sources were detected. The ISOGAL survey was mainly designed to study the galactic distribution and properties of late type, Post-MS stars, exploring a large longitude range, but with non-continuous, non-uniform and uneven sampling of the plane. Additionally, saturation limits of the ISO detectors forced to systematically avoid bright MIR sources (see Sect. 2.3). The different area coverage of the two surveys is exemplified in Figure 1. A comparison of the two samples should check that no bias is introduced by the different sampling, except for the obvious note that bright sources will be absent from the ISOGAL dataset.
4.1 BWHZ sources within ISOGAL fields
Of the 1272 sources in the BWHZ sample 138 fall within the boundaries of the ISOGAL fields considered in this paper (see Sect. 2). Most of these radio sources are unclassified, except for 3 supernova remnants (SNR) or candidate SNR, 34 sources with a high probability of being associated with IRAS sources, and 4 additional lower probability IRAS associations (BWHZ). Most (29) of the sources associated with IRAS sources are classified as UC HII or candidates UC HII by BWHZ, one is a planetary nebula (PN) and only 4 could not be classified. Among the radio sources not associated with IRAS counterparts (hence unclassified), the majority is expected to be UC HII without far infrared counterpart due to the incompleteness of the IRAS-PSC in the Galactic Plane (BWHZ). Following the discussion of BWHZ and the survey of Fomalont et al. (Fea91 (1991)) at the sensitivity limits of the radio survey we expect a contamination of background extragalactic radio sources of 23%, and 1–2% of unclassified non-UC HII Galactic objects (radio stars, pulsars, planetary nebulae, etc.). Thus, among the 138 radio sources within ISOGAL fields, 35 of the 100 that are unclassified are not expected to be YSOs (UC HII regions).
In Figure 4 we show the IRAS colour-colour plots of the IRAS sources associated to BWHZ sources and within the ISOGAL fields. Here we just point out that it appears an unbiased random subsample of the total shown in Figure 2. The numbers of sources in the various classes are not significantly different from what expected by scaling the original sample to the area in common between the two surveys.

4.2 Comparison of BWHZ sources with the ISOGAL PSC
In order to identify possible mid-infrared counterparts of the BWHZ sources, we decided to use the criterion of positional coincidence. Given the large number densities of ISOGAL sources, especially in the inner regions of the Galaxy, the result of this correlation and the reliability of the radio-ISOGAL source association, or, alternatively, the number of spurious associations is expected to be a strong function of the tolerance in the positional coincidence. The approach we decided to follow is to define a tolerance, or searching radius, based on the characteristics of the radio sources we are interested in, UC HII and candidates, which also constitute the vast majority of the radio sample. Formal positional uncertainties in the radio and ISOGAL source lists are rather small, generally less than 2″, however, source physical properties, rather than positional uncertainties need to be used to set the association criteria. UC HII regions in the 5 GHz sample are generally extended (see BWHZ), with typical sizes up to 15″. Moreover, the radio continuum and MIR observations of UC HII regions are not expected to trace exactly the same material, the latter being sensitive to the YSOs circumstellar dust as opposed to the ionised gas of the former. The comparison of near infrared and radio continuum studies of compact HII regions has shown that at the resolution of a few arcsec the radio continuum and infrared peaks may be separated by several arcseconds (Testi et al. Tea95 (1995); TFPR98 (1998); Watson et al. Wea97 (1997); Feldt et al. Fea98 (1998); Walsh et al. Wea99 (1999); wbbn (2001)). For these reasons we decided to use a rather large association distance (15″) and to check the reliability of the associations by comparing the properties of the real BWHZ/ISOGAL-PSC matches with the results of extensive random simulations.
The details of the random samples realizations and analysis are discussed in Appendix A. The main results of this analysis are that, with the association radius we adopted, we could expect a fraction of false associations that can be up to . This probability, however is a strong function of not only the association distance, but also of the mid-infrared brightness and colour of the associated sources. In practice the vast majority of the “real” radio sources are found to be associated with sources that have mid-infrared properties clearly different from those of ISOGAL sources associated to the random samples. More quantitatively, only a relatively small fraction () of the ISOGAL sources that we have associated with BWHZ sources do not meet at least one of the high reliability criteria discussed in Appendix A.
Of the 138 BWHZ sources within ISOGAL fields 96 can be associated with ISOGAL-PSC sources within the adopted association distance. Of the classified radio sources 26 out of the 29 UC HII regions (or candidate) and the only PN in the sample are associated with an ISOGAL source. None of the radio sources classified as SNR is found to be associated with an ISOGAL point source. In Figure 5a we show the ISOGAL ([7][15],[15]) colour magnitude diagram for the ISOGAL sources with good detection in both filters (65 of 96 sources). Filled circles represent UC HII or candidate UC HII; the triangle marks the only PN in the sample; small open circles are unclassified radio sources, either non associated with IRAS sources, low probability associations or with ambiguous FIR fluxes and colours (see BWHZ). Sources with association distance greater than 8″ are marked with a cross. We note that the filled source in the lower-left of Figure 5a has also IRAS colours well outside the WC89 box, its classification as candidate UC HII (BWHZ) is rather dubious.

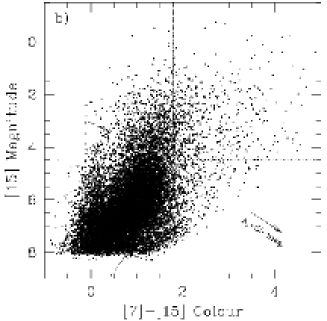

In Figures 5b and 5c we also show the colour-magnitude diagram of all the ISOGAL sources within the BWHZ survey region and of all ISOGAL sources with (excluding those in the Magellanic Cloud). The high latitude fields were chosen because we do not expect that they contain a significant number of young stellar objects (if any at all). In the figure we also show the lines defining the criteria devised in Paper II to select YSO candidates (dashed lines) as well as the revised criteria that we will adopt in this paper (see Sect. 5).
With respect to Paper II, an important additional constraint that is available with the public version of the ISOGAL catalogue is the near infrared photometry from the DENIS survey (Epchtein et al. DENIS (1994)), for all ISOGAL fields in the southern hemisphere (see Sect. 2.2). In Figure 6a we show the (K–[7],[7]) colour-magnitude diagram for all the ISOGAL sources with good detections at K and [7], and associated with BWHZ sources. The symbols have the same meaning as in Figure 5a, the PN does not have a DENIS counterpart, even if it is within the fields with DENIS data, so the triangle is missing from the figure. Sources with upper limit at K (including the PN) are shown with arrows. In Figures 6b and 6c we show similar diagrams for all the ISOGAL sources within the BWHZ survey area and all the high latitude ISOGAL fields (excluding the Magellanic Cloud).

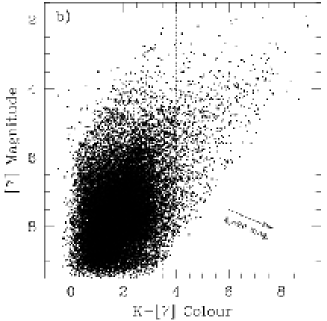

As shown by the comparison between Figure 5a and Figures 5b, 5c, the radio selected UC HII fall preferentially in the top-right part of the ([7]–[15],[15]) plane and form a subsample of ISOGAL sources with distinctly different colour-magnitude properties with respect to the much larger population of Post-MS stars, which are overwhelmingly concentrated in the lower-left region of the plane. As a countercheck, in the high latitude fields (Figure 5c), where no UC HII are expected, almost all ISOGAL sources are located in the lower-left part of the plot. Sources marked with crosses in Fig.5a, which, as discussed in the Appendix, have a lower probability of being true radio-ISOGAL associations, populate uniformly the colour-magnitude diagram, supporting the hypothesis that a good fraction of these sources are not UC HII. Similar conclusions can be drawn from a comparison between Figure 6a and Figures 6b and 6c. Also in the (K–[7],[7]) colour-magnitude plot, the well identified UC HII populate a distinct part of the plot with respect to most of the ISOGAL sources.
As an additional check on the reliability of the UC HII region nature of the ISOGAL sources associated with BWHZ sources, we can check whether the [15] magnitudes are consistent with those predicted for UC HII of a given radio flux. In Figure 7 we show the radio flux-[15] relation for the BWHZ sources associated with ISOGAL sources with good 15 m detections. In the same figure we also show the expected relation for optically thin, spherical and homogeneous UC HII, derived in Sect. 3.2. The theoretical expectation is shown for several distances ranging from 1 (dotted) to 30 kpc (solid). The vast majority of BWHZ radio sources classified as UC HII or candidate UC HII (black circles in Figure 7) are in good agreement with model predictions, as opposite to the unclassified radio sources associated with faint ISOGAL sources which fall well below the 15 m brightness expected for UC HII. These sources would be consistent with the models assuming large extinction values (exceeding 150 mags in the visual), which are not unreasonable for star forming regions, but would imply [7]–[15] colours much larger than observed (see Figure 5b). We believe that in most of these cases either the radio source is not an UC HII or the ISOGAL source associated with the radio source is not physically related with it (i.e. is a spurious association). In sect. 4.1 we estimated that 35 of the BWHZ radio sources are not YSOs, thus it is not surprising that a fraction of ISOGAL sources associated with BWHZ sources show infrared properties inconsistent with those expected for YSOs. These sources should be disregarded when defining the selection criteria to identify YSO candidates in the ISOGAL database.

4.3 MIR morphology of UC HII
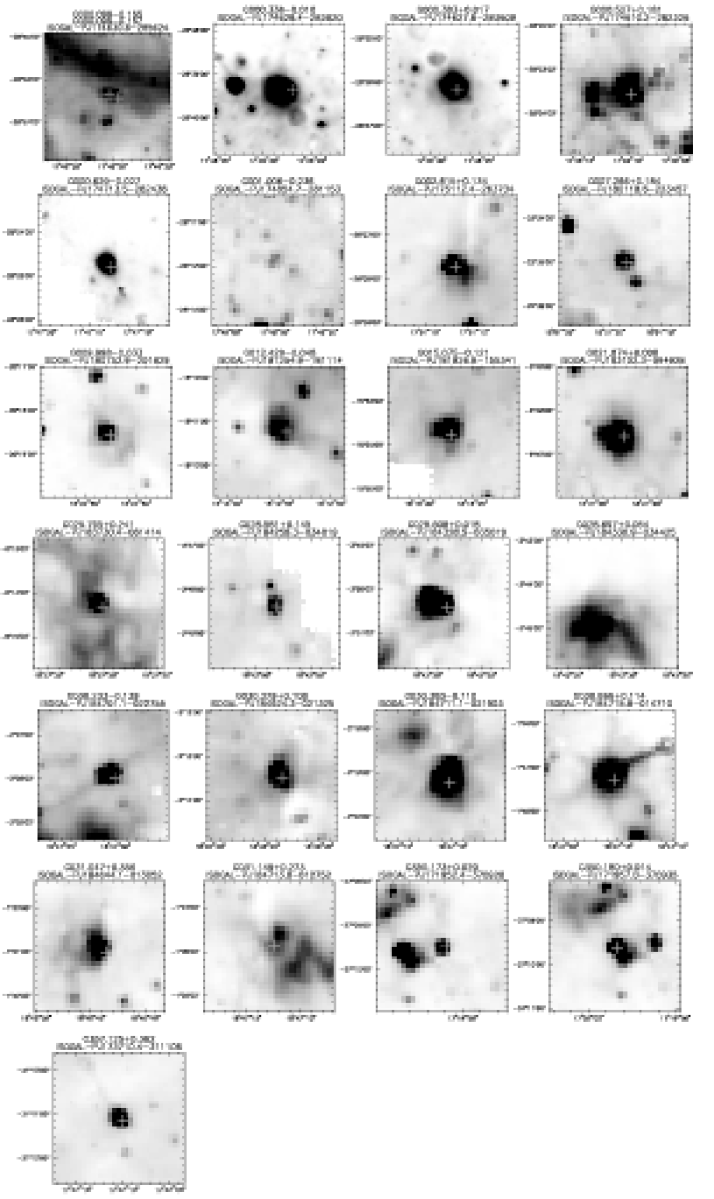
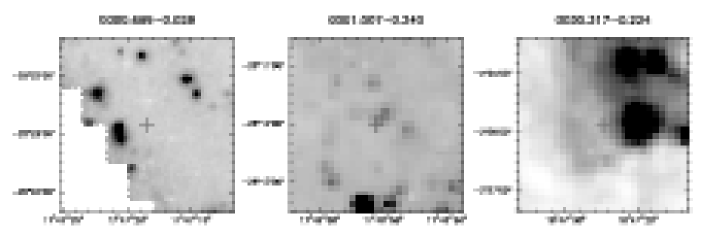
In Figure 8 and 9 we show the 15 m images of the UC HII and candidate UC HII (BWHZ) with (26 sources) and without (3 sources) an associated ISOGAL-PSC source. In each panel the cross marks the position of the radio peak (from BWHZ). Almost always the 15 m image reveals a slightly extended nebulosity, in agreement with the resolved radio structure of the UC HII regions.
As discussed earlier, the slightly extended MIR and radio structure of the YSOs amply justifies the choice of a relatively large association distance. In Figure 10 we show, for the 26 UC HII regions associated with an ISOGAL source, the distance between the radio and MIR positions as a function of the radio size. Radio sources with large diameter all have larger association distances compared with the small diameter sources.

In Figure 11, the 15 m flux density of the 26 UC HII are compared with those at 12 m from IRAS. There is a generally good correlation between the two values, but, on the average, the 15 m flux densities are smaller than the 12 m ones. This effect could be produced by nearby point sources, unresolved in the IRAS beam, and/or by the extended nature of the YSO, that could be partly filtered out by the ISOGAL point source reconstruction routines.

5 The selection criteria
In Section 4 and Appendix A we have shown that radio-IRAS selected UC HII and candidate UC HII regions are reliably associated with a class of ISOGAL sources that occupy a well defined region of the ([7]–[15],[15]) and (K–[7],[7]) colour magnitude diagrams. This in itself does not guarantee that all ISOGAL sources with the same colour-magnitude characteristics are YSOs. In Paper II, also using the results from Paper I and from Testi et al. (TFOPSCG97 (1997)), we showed that all the three sources with [7]–[15]1.8 and [15]4.5 (after correcting for the offset discussed in Sect. 2.4.1) were bright YSOs. In Paper II we also used theoretical and empirical arguments to show that the region of the ([7]–[15],[15]) colour-magnitude plane to the right of the dashed line drawn in Figure 5 is expected to suffer by a very low contamination from Post-MS stars. Unfortunately, if we wish to extract a list of YSO candidates from the entire ISOGAL database, the criteria developed in Paper II will have to be revised. Compared to the =45∘ field discussed in our previous studies, the ISOGAL fields close to the Galactic Centre are affected by a much larger line-of-sight extinction, which has the effect of moving sources toward fainter [15] magnitudes and slightly larger [7]–[15] colours (see the extinction vector shown in Fig. 5b), with the net effect of contaminating the region expected to be occupied by low flux density YSOs with heavily reddened Post-MS stars. For this reason we decided to restrict the search for YSOs only to the high flux density sources, i.e sources with [15]4.5 mag (S 330 mJy) and [7]–[15]. Let us stress that such ISOGAL sources are much more luminous than all YSOs studied by the ISOCAM Team group in nearby star forming regions. For instance, a source with S 330 mJy, even at the moderate distance for ISOGAL of 1.6 kpc, is more luminous than all sources detected with ISOCAM in Oph (d=160 pc) by Bontemps et al. (Bont01 (2001)).
For the fields with DENIS observations it is possible to use the near infrared magnitudes to add confidence to the identification of the sources as probable YSOs. As shown in Testi et al. (TFOPSCG97 (1997)), such YSOs are expected to have K–[15]9, and, consequently, K–[7] larger than 4–7 (depending on the value of [7]–[15], see Figure 5a). Since most of the K-band sources associated with radio sources are probably fake associations (see Appendix A), and even for reliable associations the interpretation of the near-infrared data is complicated by the effect of extinction, we will not use the constraint based on DENIS data to select the YSO candidates. In the final YSO candidates table (Table 3) we will report whether the field has been observed at K and if the source has a K–[7] colour exceeding 4 and [7]6. The flag SD is set equal to “1” for sources satisfying these ISOGAL-DENIS confidence criteria, to “0” for sources not satisfying the criteria, and to “–1” for sources within fields not covered by the DENIS survey. Since bright, saturated stars cannot be extracted from the DENIS survey (see also Sect. 2.2), we have checked the original DENIS images for all the ISOGAL sources with [7]6 without a DENIS counterpart in the catalogue. Indeed, for seven sources we either found a very bright, saturated counterpart (in 4 cases) or an extended near infrared source (3 cases). For these peculiar sources, in Table 3 instead of the DENIS magnitudes we report an “S” (for saturated sources) or an “E” (for extended sources).
To check the reliability of the selection criteria and the contamination from non-YSOs, we compare with the colours of sources in the high galactic latitude fields and with the near-infrared spectroscopic survey of Schultheis et al. (Sea01 (2002)). In high galactic latitude fields, we only find one object falling in the candidate selection boxes. Since in these fields we do not expect to find a significant number of luminous YSOs, but we still expect late type Post-MS stars, they provide indirect evidence that the number of evolved stars selected by our criteria should be small. This is also confirmed by recent near-infrared spectroscopic observations of ISOGAL YSO candidates toward the inner regions of the Galaxy by Schultheis et al. Sea01 (2002), who found strong contamination from Post-MS stars at faint [15] magnitudes and bright K magnitude, but not within our revised selection boxes shown in Figures 5 and 6. However, these spectroscopic observations did not address the reddest OH/IR stars which contaminate the YSO box, as discussed in Section 6.1.
The selection criteria have been defined to avoid as much as possible the contamination from Post-MS stars. This necessary requirement has important implications on the efficiency of the selection criteria. As shown in Figure 5 a non-negligible fraction of the ISOGAL sources associated with radio-BWHZ identified YSOs to the left of the [7]–[15]=1.8 line is rejected from our selection criteria. As discussed in Sect 4.2 a fraction of these are expected to be false associations, especially those with blue colour and high [15] magnitude. Considering as good only the ISOGAL-BWHZ matches with [15]4.5 and rejecting only the BWHZ source known to be associated with a PN, our selection criteria reject 30% of the bona fide radio selected YSOs.
The region to the right of the dashed line in Figure 5a and below [15]=4.5, which was used in Paper II to select low flux density YSOs in the l=+45 fields, suffers from a contamination of reddened post-MS stars that is too large to allow a reliable identification of YSOs towards the inner regions of the Galactic Plane. For this reason we will not use it for the purpose of this paper. With this choice we loose the low flux-density non-radio emitting YSOs (corresponding to 90% of the YSOs selected in Paper II).
In Paper II we have also included as possible YSOs those sources without detection at 7 m for which the lower limit to the [7]–[15] colour would select them as YSO candidates. The vast majority of these sources (called “candidate YSOs” in Paper II) had [15]4.5. To increase the reliability of the identification only sources with good detections at 7 and 15 m are considered in the present paper.
6 The catalogue of bright YSO candidates
The selection criteria that we derived in the previous section imply that we will restrict to the bright ([15]4.5) YSO candidates. This is necessary to reduce to the minimum the number of spurious Post-MS sources in the catalogue, but implies that we will limit the catalogue to high mass YSO candidates plus a fraction of nearby intermediate mass YSOs.
The catalogue is presented in Table 3 (available only in electronic form). All sources are detected at 7 and 15 m and satisfy the selection criteria based on the [15] magnitude and [7]–[15] colour defined in Sect. 5. For each source we also report the DENIS magnitudes and the ISOGAL–DENIS association quality flag (aID), from the ISOGAL catalogue if the field has been observed by DENIS or “–1” otherwise (see Omont et al. in preparation and Schuller et al. in preparation for details). We also report a flag (SD) that specifies whether the source satisfies the ([7],K-[7]) confidence criteria (see Sect. 5), the flag is set to “1” if the source satisfies the criteria, to “0” if it does not satisfy the criteria, or to “–1” if the field is not covered by the DENIS survey.
6.1 Contamination from post-MS stars
As noted in section 5 and Appendix A, the colour cutoff [7]–[15]1.8 has been introduced to avoid the contamination by the overwhelmingly large population of post-MS stars in the YSO candidates catalogue. Clearly, the sharp cutoff used represent a trade-off between low-contamination and high-efficiency in selecting YSO candidates. Following the discussion in Glass et al. (Gea99 (1999)) and Alard et al. (Aea01 (2001)), all the post-MS stars brighter than our [15] selection threshold are expected to be high mass-losing AGB stars (with perhaps a few post-AGB stars). The vast majority of AGB stars in our Galaxy are oxygen-rich, and practically all of them are O-rich in the inner Galaxy where are located most of the ISOGAL fields. Most of the reddest and more extincted of these are expected to be OH/IR stars (Pottasch P93 (1993)). Thus, to obtain an evaluation of the contamination from post-MS stars in our YSO candidates catalogue, we can compare our selection criteria against OH/IR stars surveys. We can also use the longer wavelengths information provided by the MSX mission (Price et al. MSX (2001)) for the brightest ISOGAL sources.


Two catalogues of OH/IR stars in the central degree around the Galactic Centre are given by Lindqvist et al. Lindq (1992) and by Sjouwerman et al. Sjouwer (1998). In Figure 12a, we show the positions of the ISOGAL associated (with a 9” search radius; Ortiz et al. Oea02 (2002)) OH/IR stars in the [15] vs. [7]–[15] diagram (open circles) superimposed on the distribution of all ISOGAL sources within the limits of both OH/IR surveys. As can be seen in this figure, nearly one half of the OH/IR stars fall within our YSO candidate selection criteria. Nevertheless, it should be noted that the variability of this kind of stars and the non simultaneity of the 7 m and 15 m observations can increase or reduce the observed [7]–[15] colour (for instance, the variability can account for one magnitude in [7]–[15] for the reddest OH/IR sources). As opposite, only 17% of the ISOGAL YSO candidates within the OH/IR stars survey area are associated with an identified OH/IR star. Of course, the OH surveys cannot be complete, and it is known that some post-MS sources with infrared colours similar to OH/IR stars do not display OH emission, so that this fraction is probably underestimated, allowing that 20-25% of the selected YSO candidates are probably very red post-MS stars.
Finally, additional information can be provided by the MSX survey (Price et al. MSX (2001)), which has a sensitivity about 3 magnitudes less deep than ISOGAL, but goes to longer wavelength, with bands D and E, centred at 14.65 and 21.34 m respectively. A detailed analysis of the MSX counterparts of ISOGAL sources will be the object of a forthcoming paper, but we can already show in Figures 12b and 12c the different locations in the D–E vs. [7]–[15] colour-colour diagram of the ISOGAL selected YSO candidates and the MSX and ISOGAL associated OH/IR stars. Only a small fraction (29%) of the OH/IR stars have a D–E colour greater than 1.3 (4 of these 7 sources have a bad quality detection in one or the other band), and none of these stars has [7]–[15] greater than 1.8. An association with MSX sources with a 10” search radius of the 715 ISOGAL selected YSO candidates results in 433 associations. Then, only 222 MSX sources have been detected in the D and E bands, 129 of which (58%) have a D–E colour greater than 1.3. It seems from Figure 12c that about 50% of the ISOGAL YSO candidates with D–E lesser than 1.3 are proved post-MS stars; then, we find that about 20%, and maybe 30-35%, of our sample should be contaminated by post-MS stars.
This comparison shows that a lower contamination, in the direction of the Galactic Centre, could be obtained using a more conservative [7]–[15] cutoff, at the price of a reduced efficiency in YSO candidates selection. For example, a cutoff of [7]–[15]2.5, would result in a lower efficiency in recovering the bona fide radio selected YSOs (see sect 5 and Fig. 5a), but the expected contamination in the Galactic Centre region would drop to 10%.
6.2 Global properties of the YSOs for the entire ISOGAL survey
Using our selection criteria, we extracted a total of 715 YSO candidates from the ISOGAL-PSC, corresponding to 1% of all entries in the PSC or 2% of the sources with good detections at 7 and 15 m. From our sample of 715 YSO candidates, 525 (73%) have a DENIS K counterparts, and 78 (15%) have K–158. Since most K non-detections should have K–15 greater than 6-8 (depending on the exact limiting magnitude for DENIS-ISOGAL association), we can estimate that 30-35% of the YSO candidates have K–158.
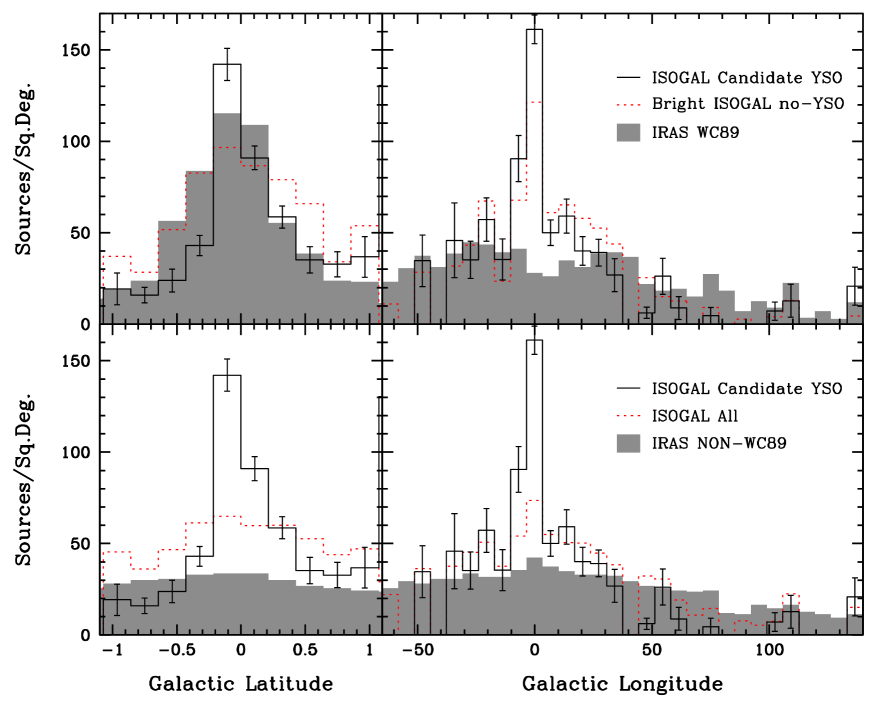
In Figure 13 we show the galactic distribution of the sample of YSO candidates (solid histograms with error bars), selected with the criteria discussed above. The histograms have been corrected for the uneven sampling of the ISOGAL survey (see Sect. 2), i.e. the counts in each latitude or longitude bin have been corrected for the area effectively observed in that bin by ISOGAL. The error bars are poissonian errors on the source counts in each bin corrected for the same area factor. The area covered in each bin ranges from 2.8 to 0.02 sq.deg., bins with smaller coverage are set to null values.
In the top panels of Figure 13, the histograms for the YSO candidates are compared with the distribution of bright ([15]4.5) ISOGAL sources with [7]–[15]1.8 (i.e. rejected from our selection criteria), corrected for the observed area in the same way as the YSOs, and with the distribution of IRAS sources satisfying the WC89 colour criteria for UC HII. The latitude histogram shows that the selected YSO candidates have a distribution highly peaked on the Galactic Plane (as expected for young sources), and very similar to the distribution of IRAS-selected UC HII regions (grey full histogram). The bright ISOGAL sources rejected by our colour selection criterion (dotted histogram) show a broader latitude distribution, confirming our expectation of a substantial contamination from evolved stars. The longitude distributions show a clear peak of the YSO candidates toward the Galactic Centre, a similar peak is missing in the IRAS-selected UC HII because of confusion problems in the densest regions of the Galaxy. The incompleteness of the IRAS sample of UC HII was also noted by BWHZ.
The bottom panels of Figure 13 show the comparison between the distribution of ISOGAL YSO candidates and the distributions of all the ISOGAL sources (including sources detected only at 7 m, dotted histogram) and of all IRAS-PSC sources on the Galactic Plane that do not satisfy the WC89 criteria for UC HII regions. The comparison shows that while the YSO candidates are highly concentrated on the Galactic Plane and towards the Galactic Centre, the other two samples show a much broader distribution, as expected for evolved objects.
As a word of caution, we wish to stress that the ISOGAL database suffer of potential biases induced by the observational strategy. As already noted above, the survey deliberately avoids bright IRAS sources, and bright star forming regions, in a non-uniform way: close to the Galactic Centre, narrow band filters were used, and the IRAS flux limit criterion to avoid saturation was relaxed. Moreover, given the patchy coverage of the Plane out of the immediate surroundings of the Galactic Centre, small features in the l and b distributions of Figure 13, such as the slight asymmetry of the b distribution or the small peaks in the l distribution, are not reliable. Some of these features may be caused by the sparse sampling of the ISOGAL survey, for instance, the small peak at l15∘ may be related to the M16 star forming region, which was deliberately covered by one of the ISOGAL rasters.
7 Conclusions
In this work we have extended and brought to its conclusion the problem, already approached in Paper II, of identifying YSO candidates from the much larger population of MIR sources (predominantly Post-MS stars) found during the ISOGAL mapping at 7 and 15 m of selected regions of the Galactic Plane with ISOCAM.
The selection criteria proposed in Paper II, and verified there from the coincidence of ISOGAL selected bright YSOs with thermal radio continuum sources, have now been tested against a much larger sample of radio-IRAS identified YSOs in the Galactic Plane, by cross-correlating ISOGAL sources detected at 7 and 15 m with the list of UC HII regions from the VLA 5 GHz Galactic Plane survey of BWHZ. A statistical simulation has been implemented to establish the reliability of the radio-ISOGAL cross-correlation as a function of various parameters. The results confirm that ISOGAL sources with an associated radio-loud YSO occupy a well defined region of the ([7]–[15],[15]) colour-magnitude diagram and that this region is relatively well separated from that occupied by the much larger population of Post-MS stars. A similar segregation of the radio identified YSOs detected also at K-band occurs in the (K–[7],[7]) colour-magnitude diagram. However, the near infrared criteria cannot be used for the entire ISOGAL catalogue since the DENIS observations only cover the fields located at . Additionally, most of the K-band sources associated with radio sources are probably fake associations (see sect. 5 and Appendix A), and even for reliable associations the interpretation of the near-infrared data is complicated by the effect of extinction. Therefore we retained the near infrared information only as “confidence criteria” for the sources for which there are available data.
With the aim of providing a more reliable list of YSO candidates throughout the Galactic Plane observations of ISOGAL, following the indications of the comparison with the large sample of radio identified YSOs, we have revised the selection criteria adopted in Paper II, which have been restricted to [15]4.5 and [7]–[15], with the additional confidence criteria of [7]6 and K–[7]4. This choice is motivated by the fact that for larger [15] magnitudes, toward the inner regions of the Galactic Plane, the contamination from reddened Post-MS stars becomes too large to obtain a reasonable list of candidates. The application of those criteria to the entire ISOGAL catalogue (only fields observed both at 7 and 15 m were considered) has produced a list of 715 YSO candidates, which represent 2% of the total number of ISOGAL point sources detected at both wavelengths. All the three bright, point-like YSOs identified in Paper II are reselected using our new criteria (and the revised ISOGAL-PSC). The galactic distribution of the selected sources is strongly peaked on the Galactic Plane, as expected for very young sources, and show a clear peak close to the Galactic Centre. Our results confirm previous suggestions by BWHZ that the IRAS sample of massive YSOs selected using the WC89 criteria is severely limited by confusion in the inner regions of the Galaxy.
Since the separation between YSOs and Post-MS stars in the colour-magnitude plane uses by necessity a sharp function, we expect a contamination of non-YSOs in our list of candidates of at least 20%, as well as we expect that we may have missed some YSOs. Using our selection criteria we recover 70% of the radio-identified YSOs. The limitation to bright YSOs ([15]4.5) is particularly needed in the ISOGAL fields close to the Galactic Centre, where large line-of-sight extinction is expected, and the contamination from reddened Post-MS stars at high [15] magnitudes is particularly high. This restriction could be released in less extincted regions, such as the l=+45∘ fields discussed in Paper II. In high-extinction fields, a lower contamination fraction could be obtained by increasing the [7]–[15] cutoff limit, at the price of a lower YSO selection efficiency.
Acknowledgements.
We thank the survey preparation, observations planning, data reduction and calibration ISOGAL team for the excellent, dedicated work culminated in the production of the Point Source Catalogue. Support from CNR-ASI grant 1/R/27/00 to the Osservatorio Astrofisico di Arcetri is gratefully acknowledged.Appendix A Reliability of the ISOGAL-BWHZ samples association
In order to quantitatively estimate the reliability of the association between ISOGAL point sources and BWHZ radio continuum sources, we performed a detailed test of ISOGAL sources associated with random samples. The random samples were designed to mimic the galactic distribution of the BWHZ sample. For this purpose we limited the BWHZ sample to the formal survey boundaries ( and ), which implies a reduction of the BWHZ sample to a total of 1171 sources. The galactic distribution has been approximated by a constant function of the longitude and a combination of a constant plus a Gaussian in latitude. The parameters of the Gaussian and constant distribution were chosen to fit the observed sources distribution. Using a long periodicity pseudo-random number generator (Press et al. Pea92 (1992)) we generated 10000 samples of 1171 sources distributed within the boundaries of the BWHZ formal survey. The random samples were then correlated with the ISOGAL database following the same criteria as for the real BWHZ sample and using an association radius of 15″.
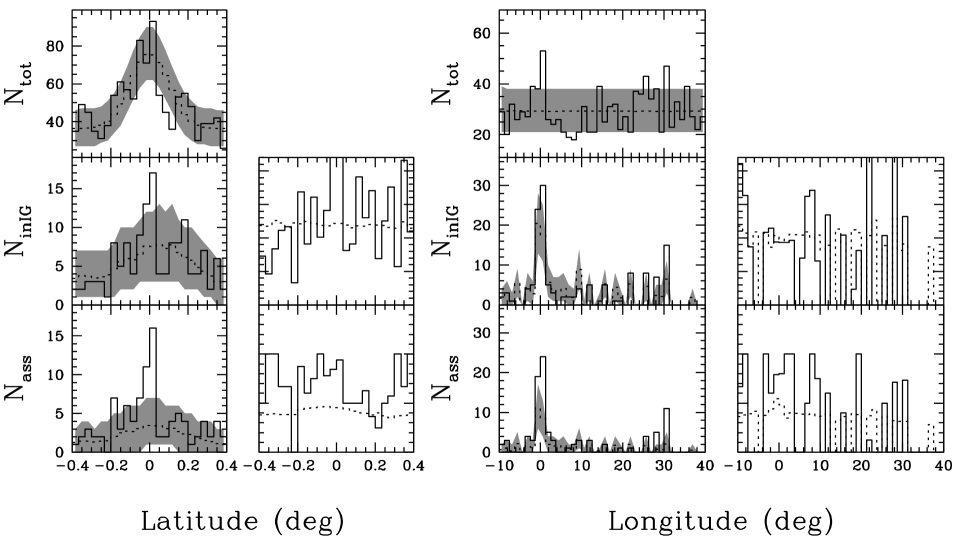
In Figure 14 we show the galactic distribution of the BWHZ sample (solid histograms) the average distribution of the random samples (dotted histograms) and, for each bin, the shaded region represent the range covered by 90% of the random realizations. The top panels show the distributions for all sources within the formal survey boundaries, the middle panels for the sources within the ISOGAL fields, and the bottom ones the distributions for the sources associated with ISOGAL sources. The histograms illustrate that the simple functions used to describe the galactic distribution of the BWHZ sample represent a reasonably accurate approximation. Nevertheless, one should note two features in the BWHZ distributions that are not represented in the random samples: a five peaks modulation in the latitude distribution and a small, narrow peak at l0∘ in the longitude distribution. The five peaks in the latitude distributions at b0.0∘,0.16∘,0.32∘ correspond to the five centre positions of the BWHZ pointing rasters, where the sensitivity of their observations is higher, while the peak at the Galactic Centre is probably a real feature of the radio sources distribution. For the purpose of the random simulations we decided to ignore these two features, as a proper reproduction of the latitude and longitude distributions would require a proper modelling of the BWHZ sensitivity throughout their observed region (see their Figure 1), the modelling of the radio sources luminosity function and their longitude distribution. The complexity and uncertainties of such detailed modelling go far beyond what is needed for our purpose. A possible effect of the neglected features combined with the uneven distribution of the ISOGAL fields is a moderately higher number of radio sources within ISOGAL fields in the real BWHZ sample with respect to the random samples, due to the crowding of ISOGAL fields near the Galactic Centre position (see Figure 1). The histograms of the galactic distribution of sources within ISOGAL fields and of sources associated with ISOGAL sources show a number of features which are probably related to the peculiar distribution of radio (and random) sources and the uneven sampling of the Plane by ISOGAL observations. To check whether the number of sources within ISOGAL fields and the number of sources associated with ISOGAL sources are a function of galactic position one has to properly correct for the number of radio (and random) sources per coordinate bin and for the area covered by the ISOGAL survey in each particular bin. These corrected “rates” of sources within ISOGAL fields and of sources associated with an ISOGAL source are also shown in Figure 14 (the histograms have null values in longitude bins not covered by ISOGAL fields). These histograms show that, within the noise and once appropriately corrected, the rates are constant as a function of galactic position. A clear feature is that the rate of BWHZ sources associated with ISOGAL sources is higher than the average rate for the random samples.
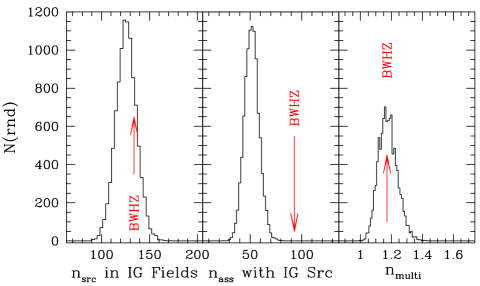
In Figure 15 we present, for the 10000 random samples, the distributions of the number of sources within ISOGAL fields (left), number of sources associated with at least one ISOGAL source (middle), and number of ISOGAL sources which can be associated with each BWHZ (or random) source using an association radius of 15″ (right). The corresponding values for the BWHZ sample are also shown. As expected, due to the effect of the uneven ISOGAL sampling and the small peak at 0∘ in the BWHZ sample, the number of BWHZ sources within ISOGAL fields is marginally higher than for the random samples. Quantitatively, the number of BWHZ sources within ISOGAL fields is 134, 7% more than the median and barely within the third quartile of the random realizations. The higher rate of ISOGAL sources associated with BWHZ with respect to the random sources shown in Figure 14 and noted above is also clearly visible in the second panel of Figure 15, the association rate with the real sources is almost double than with the random sources. Finally, the third panel of Figure 15 shows that, within the selected association radius (15″), as much as 15% of the radio sources can be associated with more than one ISOGAL source. The fraction of multiple associations in the BWHZ sample is consistent with the random simulations suggesting that multiple associations are not real ones, or that there is no crowding of ISOGAL sources close to the radio positions on the association radius scale.
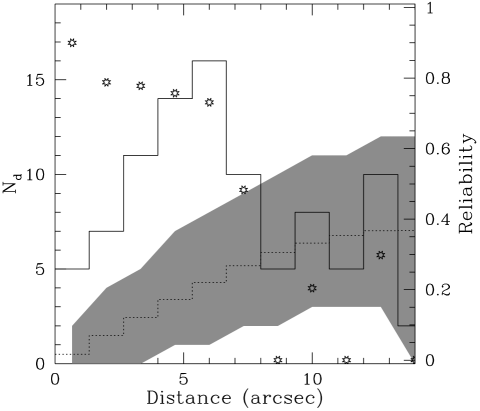
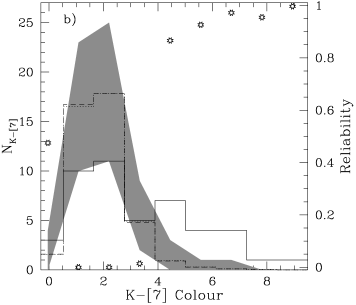
The distribution of the distances between the radio source and associated ISOGAL source is reported in Figure 16. The BWHZ sample is shown as a solid histogram, the average of the random samples as a dotted histogram and, for each bin, the grey region shows the location of 90% of the random realizations. The figure shows, as expected, that the number of random associations increases steadily with the association distance. The BWHZ sample has most of the associations for distances less than 7 arcsec, where, in each bin, it clearly displays an excess of associations with respect to the random samples. For larger distances the association rate of the BWHZ sample is essentially indistinguishable with the expectations from the random samples. To quantify the excess of associations in the BWHZ sample with respect to the random expectations, for each distance bin we defined a reliability figure as the difference between the number of BWHZ sources and the average of the random realizations normalised to the number of BWHZ sources in that bin (the figure is set to zero if the random associations are more than the BWHZ ones). With this definition, for each bin the reliability figure gives the expected fraction of “real” (i.e. non-random) associations in the BWHZ sample. The reliability is plotted in Figure 16 as open stars, and shows that for distances less than approximately 7″ the contamination from random associations is always expected to be less than 25%, above 8″ the number of associations in the BWHZ sample is indistinguishable from those of the random realizations. These results are consistent with simple association probability calculations based on the average densities of ISOGAL sources reported in the ancillary tables of the ISOGAL public catalogue (Omont et al. in preparation, Schuller et al. in preparation).
As discussed in Sect. 4.2, the above conclusions consider only one aspect and may be misleading if taken alone: the chosen association distance should also take into account the physics of the sources.
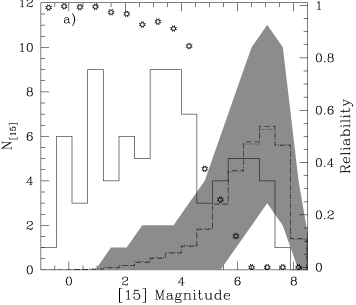
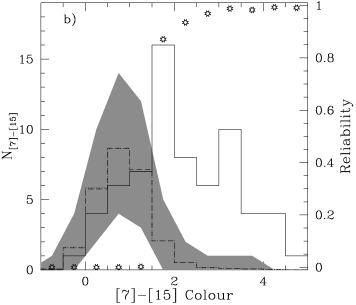
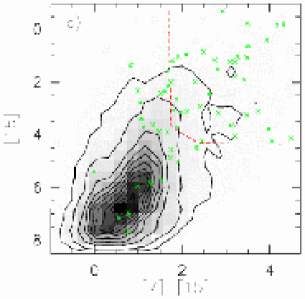
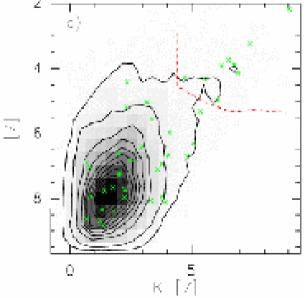
A better test can be performed on the brightnesses and colours of the ISOGAL sources associated with the BWHZ and the random samples. In Figures 17a and 17b we show the distributions of the ISOGAL 15 m magnitudes and [7][15] colours. The definition of the symbols is the same as for Figure 16. In this figures we also show, as a dashed line, the histogram of the magnitudes and colours of all the ISOGAL sources within the formal BWHZ survey region, normalised to the total number of sources in the average of the random samples. As expected, the dotted and dashed histograms are nearly identical. In summary, the BWHZ sources are mostly associated with bright and red sources, which are a minority of the ISOGAL sources, while the random samples are mostly associated with the much larger population of faint bluer sources. As a consequence, the reliability figures show a sharp transition in both plots, suggesting a very high probability of non-random associations for sources brighter than [15]5 and redder than [7][15]1.5 and a comparably low probability for fainter and bluer sources. The same result is shown in a different graphical form in Figure 17c, where the average colour-magnitude diagram produced from the sources associated with the random simulations is compared with the position of the sources associated with the BWHZ sample. Most of the ISOGAL sources associated with the BWHZ sample fall in a region of the diagram where one would expect very few random associations, confirming that most of the associations between ISOGAL sources and BWHZ radio sources are not chance coincidences.
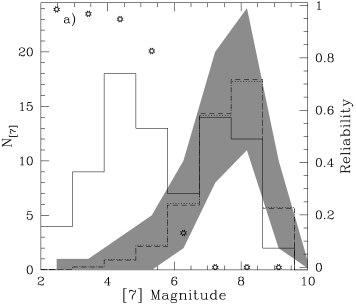
In Figure 18 we show similar figures for the [7] magnitude, K–[7] colour, and (K–[7],[7]) colour magnitude diagram. While the [7] magnitude shows a similar trend as the [15] or [7]–[15] colour, with most of the ISOGAL sources associated with the BWHZ sources populating the low-probability region of the plot, the situation is less clear for the K–[7] colour. Most of the sources with a good K magnitude in the catalogue populate the region expected for random associations, and a few sources populate the region of the plot with high reliability of being non-random associations. As discussed in Sect. 4.2, we believe that this is a consequence of the nature of the infrared sources reliably associated with BWHZ sources: these are characterised by very red colours, and in many case are not detectable at K by the DENIS survey. Consequently, most of the ISOGAL sources with a good K magnitude plotted in Figure 18 are probably fake ISOGAL-BWHZ associations, as confirmed by the high value of the [7] magnitude and the large association distance (see Sect. 4.2).
Combining all the results of our simulations, we conclude that the ISOGAL sources with the highest probability of being reliably associated with a radio source are those with bright [15] magnitudes and large [7]–[15] colours. The (K–[7],[7]) colour-magnitude diagram can be used as an additional indication of a good association if the particular ISOGAL field has been observed by DENIS and if the source is not detected or is very faint at K. To offer a more quantitative estimate for these reliability criteria, in Figures 17c and 18c we mark with a dashed line the region of the colour-magnitude diagrams where the product of the reliability figures for both magnitude and colour exceeds 80%. ISOGAL sources associated with BWHZ sources above and to the right of the lines have the highest reliability of being true associations, and should be used to derive the infrared properties of radio sources.
References
- (1) Alard C., et al. 2001, ApJ 552, 289
- (2) André P., Ward-Thompson D., Barsony M., 1993, ApJ 406, 122
- (3) Andrè P., Ward-Thompson D., Barsony M., 1999, in Protostars and Planets IV, eds. S. Mannings, A. Boss, and S. Russell (Tucson: Univ. Arizona Press), p. 59
- (4) Bacmann A., Andrè P., Puget J.-L., Abergel A., Bontemps S., Ward-Thompson D., 2000, A&A 361, 555
- (5) Becker R.H., White R.L., Helfand D.J., Zoonematkermani S. 1994, ApJS 91, 347
- (6) Becker R.H., White R.L., McLean B.J., Helfand D. J., Zoonematkermani S., 1990, ApJ 358, 485
- (7) Berrilli F., Corciulo G., Ingrosso G., Lorenzetti D., Nisini B., Strafella F., 1992, ApJ 398, 254
- (8) Bontemps S., André P., Kaas A.A. et al., 2001, A&A 372, 173
- (9) Carey S. J., Clark F. O., Egan M. P. et al. 1998, ApJ 508, 721
- (10) Churchwell E., 1991, in The Physics of Star Formation and Early Stellar Evolution, C.J. Lada and N.D. Kylafis eds., Kluwer Academic Publishers, 221
- (11) Churchwell E., Wolfire M. G., Wood D.O.S., 1990, ApJ 354, 247
- (12) Comerón F., Neuhäuser R., Kaas A.A. 2000, A&A 359, 269
- (13) Eder J., Lewis B.M., Terzian Y., 1988, ApJS 66, 183
- (14) Epchtein N., de Batz B., Copet E., et al., 1994, Ap&SS, 217, 3
- (15) Epchtein N., Deul E., Derriere S., et al., 1999, A&A, 349, 236
- (16) Faison M., Churchwell E., Hofner P., Hackwell J., Lynch D.K., Russel R.W., 1998, ApJ 500, 280
- (17) Feldt M., Stecklum B., Henning Th., Hayward T.L., Lehmann Th., Klein R. 1998, A&A 339, 759
- (18) Feldt M., Stecklum B., Henning Th., Launhardt R., Hayward T.L. 1999, A&A 346, 243
- (19) Felli M., 1979, in Stars and Stellar Systems, Bengt E. Westerlund Ed.
- (20) Felli M., Comoretto G., Testi L., Omont A., Schuller F. 2000, A&A 362, 199 (Paper II)
- (21) Fomalont, E.B., Windhorst, R.A., Kristian, J.A., Kellerman, K.I. 1991, AJ 102, 1258
- (22) Glass I.S., Ganesh S., Alard C., Blommaert J.A.D.L., Gilmore G., et al. 1999, MNRAS 308, 127
- (23) Helfand D. J., Zoonematkermani S., Becker R.H., White, R.L., 1992, ApJS 80, 211
- (24) Hillenbrand L.A., Strom S.E., Vrba F.J., Keene J., 1992, ApJ 397, 613
- (25) Ivezić Z., Elitzur M., 1997, MNRAS 287, 799
- (26) Kim K.T., Koo B.C., 2001, ApJ 549, 979
- (27) Kurtz S., Churchwell E., Wood D.O.S., 1994, ApJS 91, 659
- (28) Lada C.J., 1987, in “Star Forming Regions”, IAU 115, p. 1
- (29) Lada C.J., 1999, The Origin of Stars and Planetary System, C J. Lada and N.D. Kylafis eds., NATO Science Series vol. C-540 (Dordrecht: Kluwer), p. 143
- (30) Lada C.J. & Wilking B.A., 1984, ApJ 287, 610
- (31) Lindqvist M., Winnberg A., Habing H.J., Matthews H.E., 1992, A&ASS 92, 43
- (32) Miroshnichenko A., Ivezsić Z., Vinkovic D., Elitzur M., 1999, ApJ 520, L115
- (33) Molinari S., Testi L., Brand J., Cesaroni R., Palla F., 1998, ApJ 505, L39.
- (34) Natta A., 1999, Infrared space astronomy, to-day and to-morrow, F. Casoli, F. David and J. Lequeux eds., EDP-Sciences, Springer-Verlag
- (35) Natta A. & Testi L. 2001, A&A 376, L22
- (36) Nordh L., Olofsson G., Abergel A. et al., 1996, A&A 315, L185
- (37) Olofsson G., Huldtgren M., Kaas A.A. et al., 1999, A&A 350, 883
- (38) Ortiz R., Blommaert J.A.D.L., Copet E., Ganesh S., Habing H.J., Messineo M., Omont A., Schultheis M., Schuller F. 2002, A&A 388, 279
- (39) Persi P., Marenzi A.R., Olofsson G., Kaas A.A., Nordh L., et al. 2000, A&A 357, 219
- (40) Panagia N., 1973, AJ 78, 929
- (41) Pérault M., Omont A., Simon G., Séguin P., Ojha D., et al. 1996, A&A 315, L165
- (42) Pezzuto S., Strafella F., Lorenzetti D., 1997, ApJ 485, 290
- (43) Pottasch S.R. 1993, in Infrared Astronomy, A. Manpaso, M. Prieto and F. Sánchez Eds. (Cambridge University Press: Cambridge, UK), p. 63
- (44) Pottasch S.R., Bignell C., Olling R., Zijlstra A.A., 1988, A&A 205, 248
- (45) Press W.H., Teukolsky S.A., Vetterling W.T., Flannery B.P., 1992, “Numerical Recipes in C”, Second Edition, Cambridge University Press
- (46) Price S.D., Egan M.P., Carey S.J., Mizuno D.R., Kuchar T.A., 2001, AJ 121, 2819
- (47) Rieke G.H. & Lebofsky M.J. 1985, ApJ 288, 618
- (48) Rowan-Robinson M., 1980, ApJS 44, 403
- (49) Schultheis M., Parthasarathy M., Omont A., Cohen M., Ganesh S., Sevre F., Simon G. 2002, A&A 386, 899
- (50) Scoville N.Z., Kwan J., 1976, ApJ 206, 718
- (51) Sjouwerman L.O., van Langevelde H.J., Winnberg A., Habing H.J., 1998, A&ASS 128, 35
- (52) Stone R. C., Pier J. R., Monet D. G., 1999, AJ, 118, 2488
- (53) Testi L., Felli M., Persi P., Roth M., 1998, A&A 329, 233
- (54) Testi L., Felli M., Pérault M., Séguin P., Omont A., Comoretto G., Gilmore G., 1997, A&A 318, L13
- (55) Testi L., Felli M., Taylor G. 1999, A&AS 138, 71 (Paper I)
- (56) Testi L., Natta A., Oliva E., D’Antona F., Comerón F., Baffa C., Comoretto G., Gennari S. 2002, ApJ 571, L155
- (57) Testi L., Olmi L., Hunt L., Tofani G., Felli M., Goldsmith P. 1995, A&A 302, 249
- (58) Watson A.M., Coil A.L., Shepherd D.S., Hofner P., Churchwell E. 1997, ApJ 487, 818
- (59) Walsh A.J., Burton M.G., Hyland A.R., Robinson G. 1999, MNRAS 309, 905
- (60) Walsh A.J., Bertoldi F., Burton M.G., Nikola T., 2001, MNRAS 326, 36
- (61) White R.L., Becker R.H., Helfand, D. J., 1991, ApJ 371, 148
- (62) Wood, D.O.S., Churchwell, E. 1989, ApJ 340, 265, (WC89)
- (63) Wood, D.O.S., Churchwell, E. 1989, ApJS 69,831
- (64) Zoonematkermani S., Helfand D.J., Becker R.H., White R.L., Perley R.A., 1990, ApJS 74, 181