Discovery of a Second Millisecond Accreting Pulsar: XTE J1751–305
Abstract
We report the discovery by the RXTE PCA of a second transient accreting millisecond pulsar, XTE J1751–305, during regular monitoring observations of the galactic bulge region. The pulsar has a spin frequency of 435 Hz, making it one of the fastest pulsars. The pulsations contain the signature of orbital Doppler modulation, which implies an orbital period of 42 minutes, the shortest orbital period of any known radio or X-ray millisecond pulsar. The mass function, , yields a minimum mass for the companion of between 0.013 and 0.017 , depending on the mass of the neutron star. No eclipses were detected. A previous X-ray outburst in June, 1998, was discovered in archival All-Sky Monitor data. Assuming mass transfer in this binary system is driven by gravitational radiation, we constrain the orbital inclination to be in the range 30°–85°, and the companion mass to be 0.013–0.035 . The companion is most likely a heated helium dwarf. We also present results from the Chandra HRC-S observations which provide the best known position of XTE J1751–305.
1 Introduction
Accreting neutron stars in low mass X-ray binaries (LMXBs) are conventionally thought to be the progenitors of millisecond or “recycled” radio pulsars (Alpar et al., 1982). Firm evidence supporting this theory remained elusive until the launch of NASA’s Rossi X-ray Timing Explorer (RXTE) in December, 1995. The discovery of 300–600 Hz nearly coherent oscillations during thermonuclear X-ray bursts (e.g., Strohmayer, Zhang, & Swank, 1997) was a first solid indicator that neutron stars in LMXBs rotate rapidly. This was followed by the discovery in April, 1998, of the first accreting millisecond pulsar, SAX J1808.4–3658, with a spin period of 2.5 ms and orbital period of 2.1 hr (Wijnands & van der Klis, 1998; Chakrabarty & Morgan, 1998). This discovery convincingly established a link between accreting neutron stars and recycled pulsars. The presence of quasi-periodic oscillations in the range 300–1300 Hz in many LMXBs has also been used to infer rapid neutron star spin (e.g., van der Klis, 2000).
Binary evolution models are becoming more sophisticated (Podsiadlowski, Rappaport, & Pfahl, 2002), but still involve significant assumptions about mass transfer and the effects of magnetic fields. Kulkarni & Narayan (1988) have questioned whether the birthrate of LMXBs can account for the number of millisecond radio pulsars. On the other hand, there have been speculations that there should be a significant number of low-luminosity transient LMXBs in the galaxy (Heise, J. et al., 1999; King, 2000), whose mass transfer and binary separation are driven primarily by the emission of gravitational radiation. Although the discovery of SAX J1808.4–3658 provided convincing evidence that recycled pulsars can form in LMXBs, it is difficult to draw inferences on binary and stellar evolution based on a single case.
In this paper we report the discovery of an accreting millisecond pulsar, XTE J1751–305, which was discovered by RXTE in regular monitoring of the galactic center region. This is the fastest known accreting pulsar and the second of its kind to be found. Recently, a third pulsar XTE J0929314, was discovered (Remillard, 2002; Galloway et al., 2002). Interestingly, all three systems have very low mass companions. In §2 and §3, we present the discovery by RXTE, and results of a short Chandra observation to determine the source position. In §4 we develop a pulsar timing solution, and in §5 we present basic spectral results. §6 contains a discussion of the binary system properties. In this paper we focus on the pulsar timing properties, and defer more detailed analyses of other issues to future work.
2 RXTE Observations
XTE J1751–305 was discovered using the RXTE Proportional Counter Array (PCA) in a monitoring program of the galactic bulge region (Swank & Markwardt, 2001). The PCA instrument has an effective area of 6500 cm2, and is sensitive to 2–60 keV X-rays within a collimated field of view, which has a triangular profile and a full width at half-maximum (FWHM) of 1°. A region of approximately 250 square degrees around the galactic center region has been scanned by the PCA twice weekly since February 1999, except for several months when sun constraints interfere. The nominal sensitivity of the scans to variations is approximately 0.5–1 mCrab, but the sensitivity is degraded somewhat within a few degrees of the galactic center, where source confusion becomes important.
In a bulge scan on 2002 April 3.62, we detected a source whose identification was not previously known (Markwardt & Swank, 2002). Subsequently, detections were made and positions were determined by the BeppoSAX WFC and XMM-Newton (in ’t Zand et al., 2002; Ehle et al., 2002). All of the positions are essentially consistent with a previously unknown source situated 2.1 degrees from the galactic center.
Follow-up RXTE pointed observations continued from April 4.6–30.9 on an essentially daily basis, for a total good exposure time of 398 ks. X-ray pulsations at a frequency of 435 Hz were discovered in the first 200 seconds of the pointed observation on April 4.6, with a semi-amplitude of (Markwardt & Swank, 2002). This makes XTE J1751–305 only the second accreting millisecond pulsar to be discovered.
The PCA can be configured in a variety of data modes to optimize the usage of telemetry and science return. The primary PCA data modes for timing were GoodXenon and E_125us_64M_0_1s, which provide 1 and 125 s temporal resolutions, respectively. Spectroscopy was performed using the Standard2 mode. For light curves and spectroscopy, the PCU0 detector was excluded, because of a missing propane layer which increases the background level. For high resolution timing, all PCU detectors were used.
3 Chandra Observations
We obtained Chandra HRC-S target of opportunity observations of XTE J1751–305 on April 10.7 (Markwardt & Dobrzycki, 2002). The HRC-S is a micro-channel plate instrument sensitive to 0.1–10 keV X-rays, which can be placed at the Chandra focal plane. Due to a problem in the assignment of event times in the on-board electronics, the HRC must be operated in a special “Imaging” mode with background reducing filters disabled. Event timestamps are then corrected in the ground software. The total exposure was 2969 s. A correction for spacecraft bore sight offset was also applied. A source of 16000 counts was clearly detected at a position consistent with those of BeppoSAX and XMM-Newton (Table 1). The nominal position error for Chandra is dominated by uncertainties in the spacecraft aspect solution111http://cxc.harvard.edu/cal/ASPECT/celmon/ (Aldcroft et al., 2000), whose 90% confidence uncertainty is quoted in Table 1. No other sources were detected in the HRC-S field of view, which might have helped to refine the position further. To date, this is the best known position of XTE J1751–305.
4 X-ray Timing
An X-ray light curve of both scanning and pointed data is shown in Figure 1. Throughout this paper, particle background subtraction was performed using the “CMVLE” model available from the RXTE Guest Observer Facility. In addition to particle backgrounds, there is also a significant astrophysical background component due to nearby sources and galactic diffuse emission, which affects the baseline determination. The mean quiescent flux levels in the scan and pointing data (2.4 ct s-1 and 5.63 ct s-1 per PCU respectively) were subtracted.
Figure 1 shows that the X-ray peak flux probably occurred around April 4.5, and thereafter the light curve exhibits a nearly exponential decay, , where d (compare to the same fit for SAX J1808.4–3658, which yields d). A sudden turn-off occurs around April 13, which is very similar to the turn-off of SAX J1808.4–3658. The rise time is less than four days. The figure also shows that there was a detection of a small outburst of mCrab around April 27–30, and an X-ray burst on April 30.9. Given the large PCA field of view, the source identification must be done with care. A preliminary analysis of the burst indicates that it is not from XTE J1751–305, but that the low-level flux may be.
When a more complete set of data were available, a sinusoidal variation in the centroid frequency became apparent. To systematically investigate this effect, we first corrected the X-ray event arrival times at the satellite to the solar system barycenter using the JPL planetary ephemeris DE405, the definitive RXTE orbit ephemeris, and the best known source position. We also applied a fine clock correction, which has a magnitude of 53–78 s. Next, we divided the data into 100 s segments and computed the Rayleigh or statistic (Buccheri et al., 1983), which is defined as
| (1) |
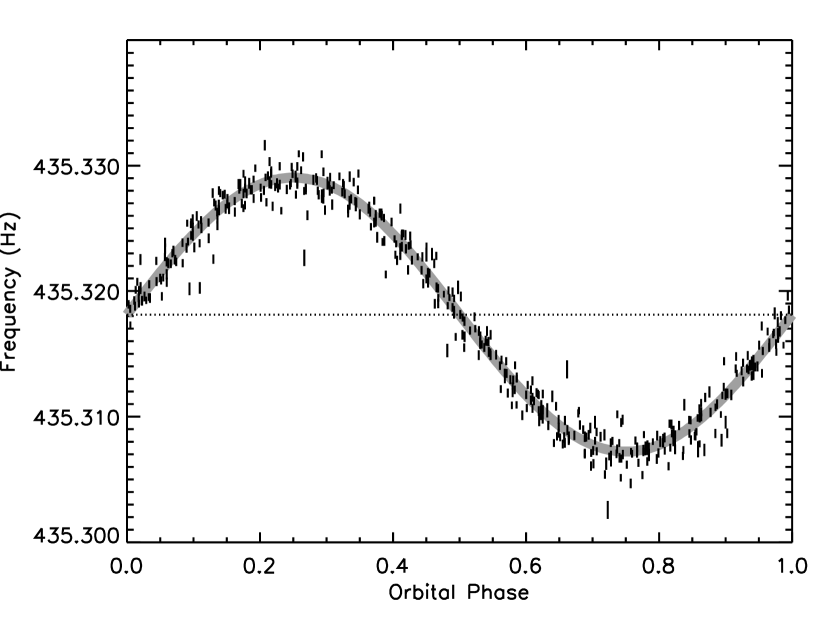
where is the pulse phase of a photon which arrives at time , according to a model of pulse phase evolution. For the initial investigation, for a grid of constant frequencies around 435 Hz, and thus the statistic is essentially the Fourier power spectrum in a narrow bandpass. Each transform peak was fitted by a Gaussian function. The pulsation frequencies for data from April 4.6–8.7, folded on a trial orbital period, are shown in Figure 2, and clearly establish the orbital frequency modulation.
The timing model was refined by constructing a single pulse phase connected solution over the data span from April 4.6–14.0. Events from PCA channels 5–40 from all enabled PCUs (energies of 2.5–16.9 keV) were coherently summed to form a single statistic. For the phase model, we translated to IDL a version of the BNRYBT binary pulsar model (Blandford & Teukolsky, 1976) from the program TEMPO (Taylor & Weisberg, 1989). The parameters of the binary were varied iteratively in order to achieve the global maximum value of the statistic. Table 1 contains the optimal binary parameters. After this, we separated the data set into smaller (10 ks) segments and examined the timing residuals by computing the cosine and sine terms of the statistic separately and converting to a time delay. The r.m.s. residual was s.
We estimated the parameter confidence intervals by employing a Monte Carlo estimation procedure. An ideal pulsar light curve model was constructed with similar orbital and spin properties to XTE J1751–305. An ensemble of 100 light curve realizations was drawn from this model using Poisson statistics. Each realization was then converted to events, and a optimization was performed. For all parameters of the model, the sample variances corresponded very closely to a region within of the peak value. Therefore, we associate this region with the single-parameter confidence region. For the actual X-ray data we stepped each parameter of interest through a fixed grid while allowing the other parameters to be optimized. Confidence intervals were set conservatively using , corresponding to uncertainties, but we quote enough precision to recover the errors.
Using our best timing solution, we constructed an overall folded X-ray pulse profile for the time range April 4.0–14.0. The pulsed fraction is defined as , which is then rescaled to account for background. The mean pulsed fraction in the fundamental was 4.41%0.02%, but slowly decreases throughout the outburst from 5.3% to 3.9%. After the light curve turn-off of April 13, the pulsations are still detected at 3–4% on April 14. The mean amplitude of the first harmonic was 0.12%0.02%, increasing from on April 4.6–6.5 (95% confidence), to 0.27%0.05% on April 11.5–15.0. The amplitude of the second harmonic was , with no evidence of time evolution.
We also examined the Chandra HRC-S data for pulsations. We barycentered the data and selected 16414 events within of the source position, and computed the statistic using the PCA timing solution. We found (a detection), which implies a pulsed fraction of about 5.6%. Cross calibration of the HRC and PCA data is a subject of further research.
Finally, we applied the PCA solution to the small outburst of April 28–30.9 and tested for pulsations. While the data for April 29.9 alone indicates a detection of (a significance of ), there are no pulsations detected in the other days from April 27.8–30.9. Thus the overall 95% upper limit for pulsations in the small outburst is 5.5%, and an unambiguous identification with XTE J1751–305 on the basis of pulsations is not possible.
5 Spectral Analysis
We sought to determine the total broadband X-ray flux by modeling the X-ray spectrum. For the purposes of this paper, we chose representative observations on April 5.6, 9.2 and 12.7, which correspond to an approximately even sampling of the light curve decay. PCA and HEXTE spectra were extracted using the analysis techniques recommended by the RXTE Guest Observer Facility. The PCA response matrix was computed using PCARSP version 8.0. The HEXTE instrument has two clusters of detectors which are sensitive to 15–200 keV X-rays and has field of view of (FWHM). The collimated detectors are physically rocked back and forth by in order to sample time-varying particle backgrounds. In this analysis, spectra from HEXTE cluster “A” were background subtracted using the rocking position.
The joint spectrum is well modeled by an absorbed power law with photon index 1.7–1.9, and an exponential cut-off energy of between 100 and 200 keV. The spectrum remains more or less constant during the decline of the outburst, and so we estimate that approximately times as much flux appears in the 2–200 keV band as in the 2–10 keV band depicted in Figure 1. Using this conversion we determine the integrated outburst fluence to be erg cm-2 (2–200 keV).
We searched the RXTE All Sky Monitor (ASM) light curve for XTE J1751–305, available from the MIT ASM web site. After filtering the data to remove points with large uncertainty ( ct/s), and rebinning to form one day averages, we detected another probable outburst in June of 1998 (Figure 3). The peak flux in the 2–12 keV band was approximately mCrab, and the duration was 3–4 days. We also examined the PCA bulge monitoring data since February 1999, but no outbursts exceeding 0.5 mCrab were detected. While there are gaps in the ASM and PCA monitoring programs where a several day outburst would be missed, we tentatively assign yr as the mean recurrence time.
6 Discussion
The binary orbital parameters allow us to estimate the properties of the companion. The 42 minute orbital period immediately reveals that XTE J1751–305 is a highly compact binary system. XTE J1751–305 has the shortest orbital period of all known millisecond pulsars (both X-ray and radio). The amplitude of the modulations also determines the mass function of the pulsar shown in Table 1, defined as , where is the binary inclination to our line of sight, and and are the masses of the pulsar and companion respectively. Given , the mass function provides the minimum possible value of , which would occur when viewing the binary edge-on (). The minimum mass range shown in Table 1 reflects a reasonable range of neutron star masses between 1.4–2.0 . It is clear that the companion of XTE J1751–305 is in the regime of very low mass dwarfs, of order 15 Jupiter masses. This is a factor of 3 smaller than the companion of SAX J1808.4–3658, which Bildsten & Chakrabarty (2001) speculate is a brown dwarf.
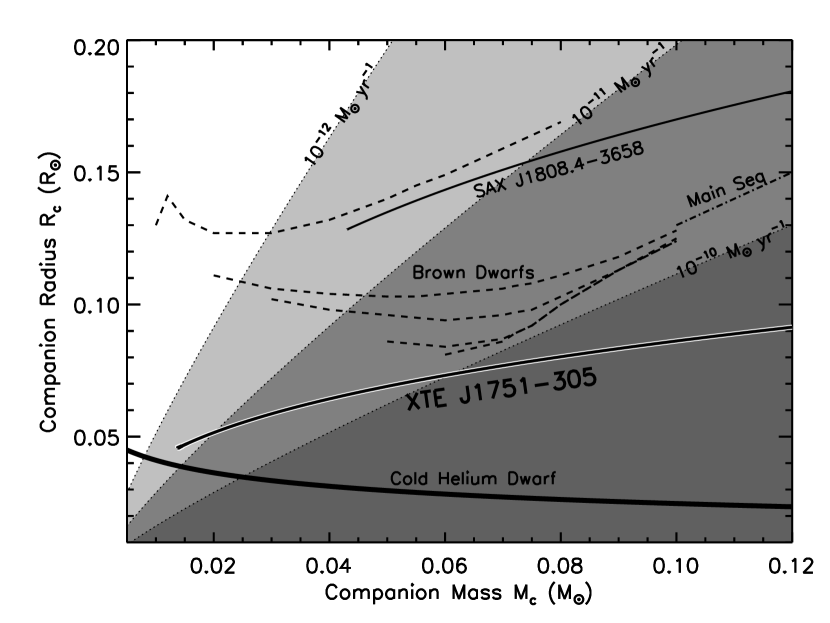
It is reasonable to assume that the companion must fill its Roche lobe in order to transfer mass to the neutron star (Eggleton, 1983). Combining the mass function and Roche lobe constraints results in a curve in the vs. plane, shown in Figure 4. This line can be compared to the equations of state of other types of bodies, including hydrogen main sequence stars, brown dwarfs (Chabrier et al., 2000), SAX J1808.4–3658 (Bildsten & Chakrabarty, 2001), and a cold helium dwarf (Zapolsky & Salpeter, 1969; Rappaport & Joss, 1984). While none of the models intersect the trace of XTE J1751–305, the hydrogen models are clearly unlikely. The oldest brown dwarf model is unlikely, given the probability that irradiation by the compact object will cause bloating (Bildsten & Chakrabarty, 2001). A warm helium dwarf model, which would lie above the “cold helium dwarf” curve in Figure 4, appears to be the most likely scenario, but there appear to be no calculations of such a configuration in the literature.
There were no X-ray eclipses or dips detected in the PCA light curves. We therefore put an upper limit of . There is also no evidence of X-ray modulations at the binary period (at a limit of ), which might have implied propagation through a scattering atmosphere in a near edge-on geometry (Bildsten & Chakrabarty, 2001). On the other hand, a very low inclination is also unlikely, since that would imply a high companion mass, and thus a large mass transfer rate. Following the reasoning of Bildsten & Chakrabarty (2001), we find that the time-averaged mass accretion rate, based on the measured X-ray fluence and a recurrence time of 3.8 yr, is yr, where is the distance in units of 10 kpc, , and assuming a neutron star radius of 10 km. On the other hand, the mass transfer in these systems is thought to be driven by gravitational radiation (King, 2000; Rappaport & Joss, 1984), in which case the mass transfer rate should be yr, where ), and we have assumed the companion is nearly degenerate. If the two mass transfer rates are equal, we arrive at the constraint, . For distances within 15 kpc, this constraint implies inclinations of 30°–85°and companion masses in the range 0.013–0.035 , for neutron star masses between 1.4 and 2.0 .
An interesting result of this constraint is that the distance is at least 7 kpc, significantly farther than SAX J1808.4–3658 ( kpc; in’t Zand et al., 2001). The peak luminosity of the persistent emission would then be erg s-1, an order of magnitude higher than that of SAX J1808.4–3658 (Cui, Morgan, & Titarchuk, 1998). It is probable that XTE J1751–305 is near the galactic center, in which case more pulsars like it should be detectable by the PCA bulge monitoring program over the next few years.
References
- Aldcroft et al. (2000) Aldcroft, T. L., Karovska, M., Cresitello-Dittmar, M. L., Cameron, R. A. & Markevitch, M. L. 2000, in Proc. SPIE, 4012, X-Ray Optics, Instruments and Missions III, ed. J. Trümper & B. Aschenbach, 650
- Alpar et al. (1982) Alpar, M. A., Cheng, A. F., Ruderman, M. A., & Shaham, J. 1982, Nature, 300, 728
- Bildsten & Chakrabarty (2001) Bildsten, L. & Chakrabarty, D. 2001, ApJ, 557, 292
- Blandford & Teukolsky (1976) Blandford, R. & Teukolsky, S. A. 1976, ApJ, 205, 580
- Buccheri et al. (1983) Buccheri, R. et al. 1983, A&A, 128, 245
- Chabrier et al. (2000) Chabrier, G., Baraffe, I., Allard, F., & Hauschildt, P. 2000, ApJ, 542, 464
- Chakrabarty & Morgan (1998) Chakrabarty, D. & Morgan, E. H. 1998, Nature, 394, 346
- Cui, Morgan, & Titarchuk (1998) Cui, W., Morgan, E. H., & Titarchuk, L. G. 1998, ApJ, 504, L27
- Eggleton (1983) Eggleton, P. 1983, ApJ, 268, 368
- Ehle et al. (2002) Ehle, M. et al. 2002, IAU Circ., 7872
- Galloway et al. (2002) Galloway, D. K., Morgan, E. H., Remillard, R. A., & Chakrabarty, D. 2002, IAU Circ., 7900
- Heise, J. et al. (1999) Heise, J. et al. 1999, in Astrophys. Lett. Comm., 38, Proc. Third INTEGRAL Workshop, ed. A. Bazzano, G.G.C. Palumbo & C. Winkler, 297
- in’t Zand et al. (2001) in’t Zand, J. J. M. et al. 2001, A&A, 372, 916
- in ’t Zand et al. (2002) in ’t Zand, J. J. M., Lowes, P., Heise, J., Bazzano, A., & Ubertini, P. 2002, IAU Circ., 7867
- King (2000) King, A. R. 2000, MNRAS, 315, L33
- Kulkarni & Narayan (1988) Kulkarni, S. R. & Narayan, R. 1988, ApJ, 335, 755
- Markwardt & Dobrzycki (2002) Markwardt, C. B. & Dobrzycki, A. 2002, IAU Circ., 7876
- Markwardt & Swank (2002) Markwardt, C. B. & Swank, J. H. 2002, IAU Circ., 7867
- Podsiadlowski, Rappaport, & Pfahl (2002) Podsiadlowski, P., Rappaport, S., & Pfahl, E. D. 2002, ApJ, 565, 1107
- Rappaport & Joss (1984) Rappaport, S. & Joss, P. C. 1984, ApJ, 283, 232
- Remillard (2002) Remillard, R. A. 2002, IAU Circ., 7888
- Strohmayer, Zhang, & Swank (1997) Strohmayer, T. E., Zhang, W., & Swank, J. H. 1997, ApJ, 487, L77
- Swank & Markwardt (2001) Swank, J. & Markwardt, C. 2001, in ASP Conf. Ser. 251, New Century of X-ray Astronomy, ed. H. Inoue & H. Kunieda (San Francisco: ASP), 94
- Taylor & Weisberg (1989) Taylor, J. H. & Weisberg, J. M. 1989, ApJ, 345, 434
- van der Klis (2000) van der Klis, M. 2000, ARA&A, 38, 717
- Wijnands & van der Klis (1998) Wijnands, R. & van der Klis, M. 1998, Nature, 394, 344
- Zapolsky & Salpeter (1969) Zapolsky, H. S. & Salpeter, E. E. 1969, ApJ, 158, 809
| Parameter | Value |
|---|---|
| Right ascension, (J2000) | aaParameter was fixed; 90% confidence limits from Chandra aspect uncertainty. |
| Declination, (J2000) | aaParameter was fixed; 90% confidence limits from Chandra aspect uncertainty. |
| Barycentric pulse frequency, (Hz) | 435.317993681(12)bbUncertainties and upper limits are in last quoted digits. |
| Pulsar frequency derivative, (Hz s-1) | |
| Projected semimajor axis, (lt-ms) | 10.1134(83) |
| Binary orbital period, (s) | 2545.3414(38) |
| Epoch of mean longitude , | 54118.7563591(87)ccModified Julian days, referred to TDB timescale. |
| Orbital eccentricity, | |
| Pulsar mass function, () | 1.2797(31) |
| Minimum companion mass, () | 0.0137–0.0174 |
| Maximum Power, | 36237 |