Evidence for a 2:3 resonance in Sco X-1 kHz QPOs
We find evidence that the two high frequency QPOs in Sco X-1 are, more often than not, approximately in the 2:3 frequency ratio familiar from studies of black hole candidates (e.g., XTE J1550-564, Remillard et al. 2002). This implies that the double kHz QPO phenomenon in neutron stars has its origin in properties of strong-field gravity and has little to do with the rotation of a stellar surface or any magnetic field structure anchored in the star.
Key Words.:
dense matter – general relativity – stars: neutron – stars: Sco X-1 – X-rays: stars1 The larger picture
Recent X-ray observations showed that in some black holes, as in neutron stars, high frequency quasi-periodic oscillations (QPOs) come in pairs. The frequencies of these pairs in the first three black hole sources where they have been observed are 300 Hz and 450 Hz in GRO J1655-40, 42 Hz and 70 Hz in GRS 1915+105, and 184 Hz and 276 Hz in XTE J1550-564 (Strohmayer 2001a,b; Remillard et al. 2002). Clearly, they are in a 2:3 ratio in two of the sources, and in a 3:5 ratio in the third (Abramowicz and Kluźniak 2001; Kluźniak and Abramowicz 2001,2002; Remillard et al. 2002). In general relativity, characteristic frequencies scale inversely with the mass. If one scales the 42 Hz QPO frequency of the black hole candidate GRS 1915+105 to about one solar mass, i.e., the mass of a neutron star, one obtains Hz, a frequency typical of the lower of the two “kHz” QPO frequencies detected in neutron stars. This in itself suggests that the QPO phenomenon in black holes and in neutron stars may have the same origin. We think that the frequency ratios may be even more revealing.
In this paper we examine the published frequency data of the well-studied source Sco X-1, a prototype of bright neutron-star candidates, to see whether the two “kHz” QPO frequencies may be in the ratio of two low integers, such as 2:3 or 3:5, as they are in black hole systems. If such a similarity were well established between neutron stars and black holes, it would imply that the “twin” high frequency QPOs originate in a mechanism operating independently of the presence of any stellar surface with its co-rotating magnetic fields. If the high frequency QPOs are fundamentally similar in neutron stars and in black holes, they are all likely to be a manifestation of strong-field gravity.
2 The inner disc radius in neutron-star LMXBs
Is the accretion process in neutron star members of low-mass X-ray binaries (LMXBs) radically different from that in their black hole counterparts, or are the two processes fundamentally similar? This question predates the discovery of high frequencies in these systems. One school of thought held that neutron stars in LMXBs have magnetic fields and spin rates comparable to that of millisecond radio pulsars, which would imply that the accretion disk is terminated far from the stellar surface, and that the highest orbital frequencies would be at most two or three hundred Hertz (within 50 Hz or so of the presumed stellar spin rate). Others suggested that the magnetic field in these systems may be so low as to play no dynamical role, and that the discs (presumed to be geometrically thin) may be terminated close to the central compact object by effects of strong gravity much as they are in black holes. On this (minority) view, orbital frequencies in the kilohertz range were expected (Kluźniak, Michelson, and Wagoner 1990). It would appear that the discovery of kHz quasiperiodic oscillations in neutron star systems favors this latter view.
The kHz QPOs have fairly similar properties in a wide range of systems, in particular the highest frequencies have similar values in X-ray bursters and the much brighter sources, such as Sco X-1 (see van der Klis, 2000, for a review). This argues against any special mechanism related to accidental properties of the system, such as the value of the magnetic field or of the accretion rate (although many models based on such finely tuned properties have been proposed). If, then, the oscillation arises in the accretion flow in the disk, the orbital frequency sets the scale of expected oscillation frequencies (Bath 1973). In fact, the relevant frequency is the meridional epicyclic frequency. It is identical to the Keplerian frequency for Newtonian gravity, but for accretion disks around neutron stars in general relativity the meridional epicyclic frequency is typically somewhat smaller than the orbital frequency. Observations of a kHz frequency then strongly disfavor a geometry of accretion in which the maximum orbital frequency is only a few hundred Hertz. This seems to rule out surface magnetic dipole fields in excess of about G (Kluźniak 1998), and tends to favour the view that the accretion disk in these neutron star systems terminates close to the marginally stable orbit of general relativity (Lipunov and Postnov 1984; Kluźniak and Wagoner 1985; Sunyaev and Shakura 1986; Kluźniak, Michelson, and Wagoner 1990; Kluźniak and Wilson 1991; Biehle and Blandford 1993; Zhang, Strohmayer, and Swank 1997; Kaaret, Ford and Chen 1997; Kluźniak 1998; Zhang et al. 1998).
3 Is the stellar spin frequency directly observed in kHz QPOs?
Patterson (1979) pointed out that if there is direct interaction between a structure corotating with the star and a Keplerian accretion disk, a QPO at the beat frequency may result. Here is the period of stellar rotation and the period of orbital motion. Patterson was discussing the white dwarf system AE Aqu, and the co-rotating structure was an “illuminating searchlight.”
After the discovery of Hz QPOs in LMXBs, this idea was adapted to a neutron star rotating at a presumed frequency of Hz and beating close to a presumed Alfven radius against a Hz Keplerian frequency at the inner edge of an accretion disk (Alpar and Shaham 1985), and given the name “beat-frequency model” (Lamb et al. 1985). But a maximum Hz Keplerian frequency is incompatible with the more recently discovered kHz oscillations in the same sources, so the name has been duly changed to “sonic-point model” with one QPO still corresponding to a (greatly increased) beat frequency and the other peak to the orbital frequency (Miller, Lamb and Psaltis 1998). It has been noted (e.g., Méndez et al. 1998; Jonker et al. 2002a) that, in fact, the difference between the two observed high frequencies in neutron star LMXBs is not constant, as it presumably should be in the beat frequency model. Accordingly, other models were proposed in which the interaction between a Keplerian disk and the stellar magnetosphere (“co-rotating structure”) gave rise to frequencies in greater concordance with the observations (Osherovich and Titarchuk 1999).
Alas! The discovery of double high frequency QPOs also in black hole candidates (Strohmayer 2001a,b; Miller et al. 2001; Remillard et al. 2002) has cast a deep shadow over the notion that there may be a direct relationship between stellar spin and the presence of two high frequency QPOs. After all, black holes do not have a surface and their spin frequency cannot be directly observed.
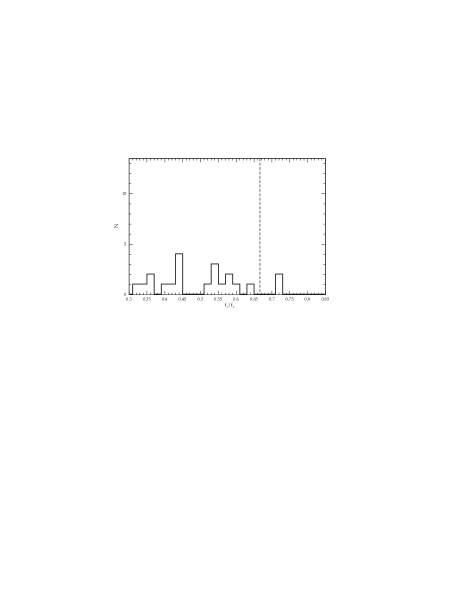
The general belief seems to be that the distribution of frequency ratios is fairly uniform, as it is for the source GX5-1 (Fig. 1). Here, we note that this is indeed the expectation in any model, where one frequency varies freely over some range, and the second differs from the first by a nearly constant value. There would be no reason for the observed frequency ratio to cluster about any particular value, much less a value equal to the ratio of two integers—in the “co-rotating structure” model the ratio between the constant stellar rotation rate and the orbital frequency is accidental and cannot be the ratio of two small integers. Even stranger would be a clustering about a value close to that observed in black hole systems, e.g., a 2:3 ratio. And yet, such a clustering is exactly what we find in Sco X-1 (Fig. 2).
One weakness of our argument is the uncertain nature of Sco X-1. Not being an X-ray burster, Sco X-1 enjoys the status of a neutron star candidate. We have performed a similar analysis of other neutron star sources, and the peak at about 2/3 ratio is present in those data as well (Fig. 3).
4 Evidence for the 2:3 frequency ratio in Sco X-1
The high frequency QPOs of Sco X-1 have been discussed in detail by van der Klis et al. 1997. In particular, the frequencies of the two QPOs have been presented for a number of separate continuous observations of 1 to 3 ks each. The frequency, , of the upper QPO ranged from about 850 Hz to slightly less than 1100 Hz. The other QPO had a frequency, , lower by about 300 Hz to 200 Hz, respectively. As usual, the difference was clearly anticorrelated with the frequency .
We have computed the ratio for each observation of Sco X-1 reported in van der Klis et al. 1997. We find it to be in a much narrower range than that of the combined data of all neutron star sources (Fig. 3).
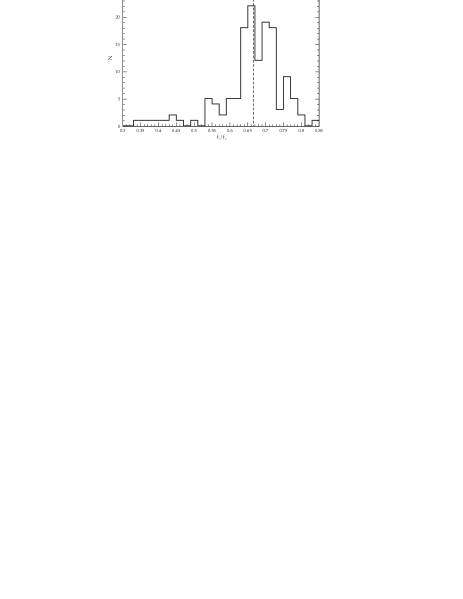
For the Sco X-1 data considered, . We have prepared a histogram of the distribution of this QPO frequency ratio, by binning the ratio in suitable intervals (Fig. 2). It is at once evident that the distribution is not uniform, it is instead sharply peaked about a central value fairly close to a 2:3 ratio (indicated in the figure by a vertical dashed line). This conclusion is not affected by the bin width, and is fairly representative of the complete sample.
We are not aware of any observational bias which would favor a selection of those data in which the QPO frequency ratio would cluster about 0.67, neither are the observers (P. Jonker, private communication).
5 Statistical significance of the peaks in the frequency ratio
To quantify our claim of clustering about a preferred value of the frequency ratio of “kHz” QPOs in Sco X-1, we have fit to the observed distribution of frequency ratios a suitably normalized Lorentzian as a trial probability distribution,
where and are free parameters, and is the normalization factor. Here, . We use the maximum likelihood method (Bulik, Kluźniak, and Zhang 1999) to find the probability distribution that best describes the data, i.e., the most likely value of the two parameters. Once these are determined, we calculate the probability that the data has been drawn from this distribution using the Kolmogorov Smirnov test. The likelihood function is the product of probabilities of measuring each individual frequency ratio
We searched the two dimensional parameter space for the best values of and and found a strong peak at and . The Kolmogorov Smirnov test shows that the probability that the data has been drawn from the distribution described by eq. (1) with these two values of the parameters is . This confirms that our initial choice of the shape of the distribution (Lorentzian) is close to the original distribution of the ratios, and that the probability distribution maximizing the likelihood function is acceptable.
In Figure 2, we superpose on the histogram this best-fit Lorentzian distribution (smooth curve), normalized to the total number of events. The offset of the peak from the value 2/3 is statistically significant. A fit with a forced value of the centroid at yields a slightly broader distribution with , but the K-S probability is unacceptable, at .
The data of fig. 2, here binned in intervals of width , exhibit an additional peak around the value of . We have also tried fitting two Lorentzians. The best fit values are and 0.7763 for the centroids, and and 0.0049 for the widths of the two peaks, respectively. Although inclusion of a second Lorentzian improves the fit (K-S probability of 0.801), from the statistical point of view the second peak is not strongly required by the data, as the K-S test probability is already acceptable with just one Lorentzian.

A careful analysis of Fig. 3 in van der Klis et al. 1997, especially panel d), suggests that the second peak may be real—the power ratio of the two QPOs departs from the general trend when becomes greater than 0.75 (i.e., when Hz). From the data (Fig. 2 of this work and Fig. 3 of van der Klis et al. 1997), it would appear that when the QPO frequency ratio is (to within a few percent), the upper QPO has about twice as much power as the lower QPO, and the upper QPO power steadily decreases with increasing frequency ratio , until , when the upper QPO again becomes twice, and even three times, as powerful as the lower QPO.
Recent observations of the burster 4U 1636-53, support the reality of both peaks in Fig. 2. The frequency difference between the QPOs in 4U 1636-53 seems to undergo an abrupt transition from a peak separation of about 330 Hz to about 250 Hz (Jonker et al. 2002a, DiSalvo et al. 2002). On one side of the transition the frequency ratios are 0.662, 0.680, 0.685, 0.725, i.e., they may well have been sampled from the 2/3 peak in the distribution of Sco X-1; on the other side, the ratios vary between 0.75 and 0.78.
6 Interpretation of the results
Figs. 1, 2, and 3 make it clear that, unlike GX5-1, most neutron star sources do not show a flat distribution of kHz QPO frequency ratios. It is hard to escape the conclusion that a resonance is responsible for the distribution of frequency ratios in Sco X-1. The 2/3 value, identical to the ratio seen in the black hole candidates GRO J1655-40 and XTE J1550-564 (whose measured masses are and ) is a very strong indication that the high frequency QPOs are a manifestation of strong-field gravity, and not of the presence of a stellar surface with any co-rotating structure.
Our argument about the role played by strong field-gravity in forming the high frequency QPOs is based on the similarity between neutron stars and black holes, for this we need to assume that the microquasars GRO J1655-40 and XTE J1550-564 are in fact accreting black holes.
To make the argument secure, one needs a theory of the origin of high frequency QPOs able to accomodate both the sharp frequency ratios in the observed black holes and the broader distribution observed in Sco X-1 and some other neutron star sources. It must explain a preference for a 2/3 ratio of the high frequency QPOs and the offset between the peak of the distribution of Fig. 2 and the value 2/3. We note that all these facts seem to be in accord with the theory of epicyclic parametric resonance in relativistic accretion disks. On that theory (Kluźniak and Abramowicz 2002), the higher frequency QPO occurs at the frequency of meridional oscillations, , in that orbit in which the radial epicyclic frequency is . For the Schwarzschild metric this occurs at , and comparison with the observed frequency of 900 Hz in Sco X-1 implies that , with modestly higher values for rotating neutron stars.
The origin of the second peak of frequency ratios, at , remains a puzzle, as does the flat distribution of frequency ratios seen in GX5-1 and some other sources. Detailed comparison of observations and the theory of parametric epicyclic resonance for realistic space-time metrics of rapidly rotating neutron stars will be the subject of another paper.
Acknowledgements.
We thank Peter Jonker, Michiel van der Klis and Jean-Pierre Lasota for valuable discussion. This work has been funded in part through the KBN grants 5P03D01721 and 2P03D02117, by CNRS, and by the Swedish Research Council. MAA and WK thank Institut d’Astrophysique de Paris for generous support and hospitality.References
- (1) Abramowicz, M.A., Kluźniak, W. 2001, A&A 374, L19, astro-ph/0105077
- (2) Alpar, M. A., Shaham, J. 1985, IAUC 4046, 2
- (3) Bath, G. T. 1973, Nature Ph.Sc. 246, 84
- (4) Biehle, G.T., Blandford, R.D. 1993, ApJ 411, 302
- (5) Bulik, T.; Kluzniak, W.; Zhang, W. 2000, A&A 361, 153
- (6) Jonker, P.G., Méndez, M., van der Klis, M. 2002a, MNRAS in press, astro-ph/0204113
- (7) Jonker, P.G. et al. 2002b, MNRAS 333, 665
- (8) P. Kaaret, E. C. Ford and K. Chen 1997, ApJ 480, L27
- (9) Kluźniak, W. 1998, ApJ 509, L37
- (10) Kluźniak, W., M.A. Abramowicz 2001, Acta Phys. Pol. B, 32, 3605, available at http://th-www.if.uj.edu.pl/acta/
- (11) Kluźniak, W. and M.A. Abramowicz 2002, A&A submitted, [astro-ph/0203314].
- (12) Kluźniak, W., Michelson, P., Wagoner, R.V. 1990, ApJ 358, 538
- (13) Kluźniak, W., Wagoner, R.V. 1985, ApJ 297, 548
- (14) Kluźniak, W., Wilson, J.R. 1991, ApJ 372L, 87
- (15) Lamb, F. K., Shibazaki, N., Alpar, M. A., Shaham, J. 1985, Nature 317, 681
- (16) Lipunov, V. M., Postnov, K. A. 1984, Ap&SS 106, 103
- (17) Méndez, M., van der Klis, M., van Paradijs, J. 1998, ApJ 506, L117
- (18) Miller, M.C., Lamb, F.K., Psaltis, D. 1998, ApJ 508, 791
- (19) Miller, J. M. et al. 2001, ApJ 563, 928
- (20) Osherovich, V., Titarchuk, L. 1999, ApJ 522, L113
- (21) Patterson, J. 1979, ApJ 234, 978
- (22) Remillard, R. et al. 2002, astro-ph/0202305
- (23) Strohmayer, T.E. 2001a, ApJ. 552, L49
- (24) Strohmayer, T.E. 2001b, ApJ. 554, L37
- (25) Sunyaev, R. A., Shakura, N. I. 1986, SvAL 12, 117
- (26) van der Klis, M. 2000, ARA&A, 38, 717
- (27) van der Klis, M., Wijnands, R.A.D., Horne, K., Chen, W. 1997, ApJ 481, L97
- (28) Zhang, W., Strohmayer, T.E. and Swank, J.H. 1997, ApJ 482, L167
- (29) Zhang, W., Smale, A.P, Strohmayer, T.E. and Swank, J.H. 1998, ApJ 500, L171