Deep radio imaging of the SCUBA 8-mJy survey fields: sub-mm source identifications and redshift distribution
Abstract
The SCUBA 8-mJy survey is the largest submillimetre (submm) extragalactic mapping survey undertaken to date, covering 260 arcmin2 to a 4 detection limit of 8 mJy at 850 m, centred on the Lockman Hole and ELAIS N2 regions. Here, we present the results of new 1.4-GHz imaging of these fields, of the depth and resolution necessary to reliably identify radio counterparts for 18 of 30 submm sources, with possible detections of a further 25 per cent. Armed with this greatly improved positional information, we present and analyse new optical, near-infrared (IR) and XMM-Newton X-ray imaging to identify optical/IR host galaxies to half of the submm-selected sources in those fields. As many as 15 per cent of the submm sources detected at 1.4 GHz are resolved by the 1.4′′ beam and a further 25 per cent have more than one radio counterpart, suggesting that radio and submm emission arise from extended starbursts and that interactions are common. We note that less than a quarter of the submm-selected sample would have been recovered by targeting optically faint radio sources, underlining the selective nature of such surveys. At least 60 per cent of the radio-confirmed optical/IR host galaxies appear to be morphologically distorted; many are composite systems — red galaxies with relatively blue companions; just over one half are found to be very red () or extremely red (); contrary to popular belief, most are sufficiently bright to be tackled with spectrographs on 8-m telescopes. We find one submm source which is associated with the steep-spectrum lobe of a radio galaxy, at least two more with flatter radio spectra typical of radio-loud active galactic nuclei (AGN), one of them variable. The latter is amongst four sources ( 15 per cent of the full sample) with X-ray emission consistent with obscured AGN, though the AGN would need to be Compton thick to power the observed far-IR luminosity. We exploit our well-matched radio and submm data to estimate the median redshift of the 8 mJy submm galaxy population. If the radio/far-IR correlation holds at high redshift, and our sample is unbiased, we derive a conservative limit of 2.0, or 2.4 using spectral templates more representative of known submm galaxies.
keywords:
galaxies: starburst – galaxies: formation – cosmology: observations – cosmology: early Universe1 Introduction
The nature of the sources detected in deep submm and mm surveys remains controversial. All SCUBA surveys agree as to the high surface density of 850-m sources detected at the mJy level (Smail, Ivison & Blain 1997; Hughes et al. 1998; Barger, Cowie & Sanders 1999a; Eales et al. 1999; Chapman et al. 2002a; Borys et al. 2002; Webb et al. 2002b) but their exact distances, luminosities and their power source all remain contentious subjects.
Most of the far-IR/submm background detected by the DIRBE and FIRAS experiments (Puget et al. 1996; Fixsen et al. 1998; Hauser et al. 1998; Schlegel, Finkbeiner & Davis 1998) has already been resolved into discrete sources by SCUBA (Blain et al. 1999b; Smail et al. 2002a; Cowie et al. 2002) implying that the cosmic energy budget in the early Universe was dominated by hitherto undetected dust-enshrouded systems, either starbursts with star-formation rates 100 M⊙ yr-1, sufficient to construct a giant elliptical galaxy in 1 Gyr, or Compton-thick AGN associated with the formation of super-massive black holes (SMBH).
If the submm galaxy population lies at high redshift, , and is predominantly powered by star formation, then its star-formation rate density is higher than that deduced from optical/ultraviolet observations of the more numerous Lyman-break galaxies (Steidel et al. 1999), a population with which there appears to be little overlap (Peacock et al. 2000; Chapman et al. 2000; Webb et al. 2002a; cf. Adelberger & Steidel 2000). In this scenario, the properties of SCUBA galaxies (e.g. space density, redshift distribution, etc.) would need to be reproduced by any successful model of galaxy formation. Equally, if the bulk of the bolometric luminosity of this population derives from gravitational accretion onto black holes then they clearly represent a crucial phase in the formation of SMBH and the evolution of QSOs and powerful radio galaxies (Archibald et al. 2001; Page et al. 2001). The apparently tight relation seen locally between the masses of bulges and the those of their resident SMBH suggests that both of these scenarios may contain elements of truth, indicating a complex interplay between obscured star formation, AGN activity and feedback in the early evolution of spheroids and SMBH (Silk & Rees 1998; Fabian 1999; Archibald et al. 2002).
While there has been significant progress in detailing the observational properties of the SCUBA population, theoretical interpretation has lagged behind. The standard framework for the theoretical understanding of this population relies upon hierarchical models which employ the cold dark matter (CDM) paradigm. These have successfully described the properties of the galaxies and large-scale structure in the local Universe (e.g. Cole et al. 2000) but the gradual growth of the characteristic mass of galaxies leads these models to predict that the most massive galaxies have formed only recently, (Kauffmann & Charlot 1998), even in a low-density CDM cosmology. Semi-analytic models of galaxy formation, developed within the hierarchical framework, predict that these massive galaxies form primarily through mergers, where the attendant starburst activity can be sufficient to power the prodigious luminosities seen in local ultraluminous IR galaxies (ULIRGs — Baugh et al. 2001). However, the strong decline in the number density of massive galaxies with redshift means that these models predict relatively modest median redshifts for the most massive mergers, , unless the physical nature of the systems evolves radically (Blain et al. 1999a, 1999c), or the efficiency of high-mass star formation is greater in bursts than in the quiescent mode seen in local disks. The most natural prediction of these models is therefore a low median redshift for galaxies selected by SCUBA. If it is shown that submm galaxies lie predominantly at high redshift, , and that they represent massive gas-rich mergers (most probably associated with the formation epoch of massive ellipticals, Eales et al. 1999) then this will require a radical overhaul of the treatment of high-redshift star formation in CDM-based hierarchical models. Hence an estimate of the redshift distribution, , for a complete, robust and well-characterised sample of submm-selected galaxies provides one important test of current theoretical galaxy formation models. In addition, the is crucial for estimating the true 3-dimensional clustering of the submm population from the projected 2-dimensional clustering of sources in panoramic SCUBA surveys. The strength of the clustering of submm galaxies reflects the mass (and bias) of these systems and provides a further test of the predictions from galaxy formation models. For these reasons, determining the of complete samples of submm galaxies is one of the highest priorities for researchers working on this enigmatic population (e.g. Blain et al. 1999c, 2000; Smail et al. 2000, 2002a).
Unfortunately, if the majority of the submm population have no plausible optical counterparts, as has been widely reported, then traditional optical spectroscopy is not a viable option for determining (e.g. Barger et al. 1999b). The faintness of near-IR counterparts to submm sources gives little hope to IR spectroscopists either and attention has focussed on redshift engines of one sort or another or on broadband photometric techniques (e.g. Townsend et al. 2001; Hughes et al. 2002; Aretxaga et al. 2002).
One potentially profitable route exploits the well-known radio/far-IR correlation (Dickey & Salpeter 1984; de Jong et al. 1985; Helou, Soifer & Rowan-Robinson 1985) as a redshift estimator using deep radio observations of submm sources. The submm flux density, , goes as , while for the optically thin synchrotron emission in the radio, (Condon 1992). is thus a sensitive function of redshift, initially rising as (Carilli & Yun 1999). Observations at 1.4 GHz thus complement submm surveys perfectly, being similarly sensitive to star-forming galaxies, although only at with present facilities (at , the positive correction at 1.4 GHz overcomes the available sensitivity).
Given the preponderance of possible optical counterparts at the level, the other crucial role of radio observations is to exploit their superior resolution to tie down the positions of submm sources: compared to 4′′ for SCUBA (e.g. Ivison et al. 1998, 2000b, 2001). Moreover, a single radio image can cover 500 arcmin2 with high sensitivity and 1′′ resolution (for 25-m antennas separated by 30 km at 1.4 GHz) enabling many of the sources in even the largest submm surveys to be identified in a single radio map. In addition, the large field of view allows the radio coordinate frame to be aligned accurately with the optical/IR frame (see §2.3). This means that only the positions of the most distant galaxies, those undetected in the radio, need then be laboriously determined on a case-by-case basis, via mm-wave continuum interferometry at the Owens Valley Radio Observatory (e.g. Frayer et al. 2000) and at Plateau de Bure (e.g. Downes et al. 1999; Lutz et al. 2001).
Radio observations also act as a useful probe of AGN, regardless of the level of obscuration, via the identification of lobe-like morphologies or deviations of the radio spectral index (, where ) from the expected for star-forming galaxies (e.g. SMM J023990136, Ivison et al. 1999), or via anomalously high radio fluxes (e.g. SMM J14009+0252, Ivison et al. 2000b).
Previous radio imaging of submm samples has been extremely successful, identifying robust optical/IR counterparts (Ivison et al. 1998, 2000b, 2001; Smail et al. 1999) and providing evidence that submm-selected galaxies are extremely distant, 2–2.5 (Smail et al. 2000, 2002a; cf. Lawrence 2001). To date, however, the approach has been limited by small-number statistics, by the narrow, deep nature of the Smail et al. (2002a) survey, which has a median lensing-corrected flux of mJy, and by the need to spread observing time across many fields (although this was mitigated by the achromatic amplification of the sample by foreground clusters).
Some of us have recently completed a large unbiased extragalactic submm survey (Scott et al. 2002; Fox et al. 2002; hereafter S02, F02) covering 260 arcmin2 at 450 and 850 m. S02 detected 38 850-m sources at the 3.5 level ( deg-2) in the ELAIS N2 and Lockman Hole East regions. This survey is very well-suited for determining the radio/submm spectral indices of SCUBA sources, and hence estimating the redshift distribution of the bright submm population. While the redshifts of individual sources are unlikely to be strongly constrained, the can be determined statistically for a sufficiently large sample. At an 850-m detection threshold of 8 mJy, many sources will be detected by deep 1.4-GHz imaging. Moreover, any 8-mJy submm source not detected at radio wavelengths can be ascribed a relatively robust and potentially exciting redshift constraint of . The redshifts of the more distant fraction can be constrained further using flux ratios that are more effective at , e.g. (Eales et al. 2002; see also Hughes et al. 2002).
F02 presented shallow, 12′′-resolution radio data from Ciliegi et al. (1999) and de Ruiter et al. (1997) for the 8-mJy survey regions. With noise levels of 30 Jy beam-1, limits of could be set for most of the bright submm galaxy population. In the next section, we describe deep, high-resolution imaging ( = 5–9 Jy beam-1, 1.4′′ fwhm) of the 8-mJy survey regions. In §3 we use these maps to successfully identify robust radio counterparts for 60 per cent of the submm sources, and to refine the original submm sample via the excision of six sources which (in line with statistical expectation) appear to be the result of confusion. Next, in §4, we exploit the improved positional information provided by the 1.4-GHz maps to identify optical and/or near-IR host galaxies in new images, and to exclude possible counterparts where the radio data indicate blank fields (, ). We go on to determine the redshift-sensitive submm-to-radio spectral indices for an unbiased sample of 30 sources from the 3.5 8-mJy sample. Finally, in §5 we discuss the implications of the results of this multi-frequency follow-up study for the nature and redshift distribution of the luminous submm galaxy population.
Throughout we adopt a flat cosmology, with , and km Mpc-1.
2 Imaging and Data reduction
2.1 Submm data
The 850-m observations and data reduction are described fully by S02. To summarise, SCUBA (Holland et al. 1999) was used to map a total of 260 arcmin2, split evenly between two fields, to a uniform noise level of mJy beam-1. The data were reduced using both the standard surf software (Jenness 2000) and an idl-based reduction routine (Serjeant et al. 2002). These methods have some common tasks (i.e. combining the positive and negative beams, flatfielding and extinction correction). The difference lies in the final binning procedure: the idl-based method bins the signal into 1′′ pixels, creating ‘zero-footprint’ maps with a corresponding noise value determined from the signal variance. The term ‘zero-footprint’ is an analogy with the drizzling algorithm (Fruchter & Hook 1997). A standard shift-and-add technique takes the flux in a given pixel and places its flux into the final map over an area equivalent to one detector pixel projected on the sky. Drizzling, on the other hand, takes the flux and places it into a smaller area in the final map. Simulations have shown that this helps preserve information on small angular scales, provided that there are enough observations to fill the resulting gaps. The area in the coadded map receiving the flux from one detector pixel is termed the footprint. The method is an extreme example of drizzling: data are taken from each 14′′ (fwhm) bolometer beam and the signal is placed into a very small footprint (a ‘zero-footprint’), 1′′ square. Unlike the standard surf reduction, there is no smoothing or interpolation between neighbouring pixels, so the signal-to-noise in the drizzled maps is low and the peaks must be found from Gaussian-convolved images. Although there is some degree of correlation between pixels in the output zero-footprint signal maps, the corresponding pixel noise values represent individual measurements of sky noise averaged over the full integration time at a specific point on the sky and are therefore statistically independent of their neighbours.
These uncorrelated noise maps enable a maximum-likelihood method to be employed to measure simultaneously the statistical significance of each peak in the maps, leading to well-quantified uncertainties for the flux densities of all potential sources. The final sample (Table 1) differs slightly from the catalogue of S02 due to an additional 24 hr of 850- data. The best-fit flux density of source N2 850.17 dropped from mJy to mJy (where the error budget includes absolute calibration), corresponding to a drop in significance from 3.5 to 3.3 . Source N2 850.16, originally in a noisy area of the map, has disappeared. This confirms that sources in ‘non-uniform’ regions of the maps (four, in addition to N2 850.16) are the least secure. No new sources were revealed at the 3.5 level by the new data.
In order to assess the likely contamination from spurious and confused sources, a series of simulated images for each of the two survey fields were created, examples of which may be found in S02. Fake sources, arising purely from noise, were found to be in good agreement with Gaussian statistics, with only one spurious source found at the 3.5 level. Confusion of fainter sources, however, can lead to catalogues being contaminated with false, brighter sources. At a 850-m flux limit of 8 mJy, our simulations implied that 20 per cent of the objects recovered at 3.5 could not be identified with a source brighter than 5 mJy. Most of these ‘false bright sources’ are real but are significantly fainter than the catalogues would suggest. Only minor modifications to the counts were required since our simulations also suggested that 15 per cent of ‘real’ 8-mJy sources are not recovered. The situation worsens if faint SCUBA galaxies are clustered.
2.2 Radio data
The process of obtaining and reducing deep, high-resolution, wide-field 1.4-GHz images is complicated by bandwidth smearing, necessitating the use of spectral-line, pseudo-continuum correlator modes at the National Radio Astronomy Observatory’s111NRAO is operated by Associated Universities Inc., under a cooperative agreement with the National Science Foundation. (NRAO) VLA, by interference (man-made and solar), and by the presence of dozens of bright (often structurally complex) sources in the primary beam.
For the two fields under consideration here, ELAIS N2 and Lockman Hole East, the problems encountered during data reduction were very different. The ELAIS N2 field is crowded with bright sources (the central 100 arcmin2 field contains a 120-mJy radio galaxy (Willott et al. 2002) as well as six structurally complex FR I/II sources). The field also has relatively poor nearby phase/amplitude calibrators, the best of which is resolved on some baselines. Fortunately, the presence of bright sources allowed self calibration of the data, correcting the poor initial phase/amplitude calibration. Lockman East, in contrast, is devoid of strong radio sources; self calibration was thus more difficult but the field is close to a bright, unresolved phase/amplitude calibrator so the initial calibration was excellent on all baselines.
In detail: data were taken every 5 s in 3.25-MHz channels, 28 in total, centred at 1.4 GHz, recording left-circular and right-circular polarisations. 3C 84 and 3C 286 were used for flux calibration. The phase/amplitude calibrators, 1625+415 and 1035+564, were observed every hour. During 2001 January–May, 20 hr of integration was obtained for each field — 15 hr each in A configuration (maximum baseline, 27 km), during 2001 January; 5 hr each in B configuration (maximum baseline, 9 km). A further 55 hr of integration (A configuration) was obtained for the Lockman field during 2002 March.
After standard spectral-line calibration and editing of the data and their associated weights, using aips, the wide-field imaging task, imagr, was used to map the central fields of ELAIS N2 and Lockman East with simultaneous imaging of over 40 satellite fields known to contain bright sources via inspection of the NRAO VLA Sky Survey (NVSS — Condon et al. 1998). These maps, made with robust = 0 weighting of the visibilities, were used to position clean boxes around the sources, and imagr was re-run with 10,000 interations of the clean algorithm (Högbom 1974; Clark 1980). The clean components thus produced were used as a model for self calibration (in phase only) using calib with a relatively long integration time ( 1–2 min) and a low signal-to-noise threshold (3–4 ). Mapping was then repeated, after checks on the clean boxes. The new clean components were subtracted from the visibilities and the data were clipped to remove spikes, then added back to the clean components. The imagr/calib loop was then repeated a further four times (though without further clipping), steadily decreasing the integration time and increasing the signal-to-noise threshold, the final pass of calib including both amplitude and phase (with the mean gain modulus of the applied calibration set at unity). This iterative method resulted in the loss of less than 5 per cent of the data. The A- and B-configuration data were dealt with separately and then co-added prior to imaging.
The entire process involved several months of computer processing but produces images of very high quality. The resulting maps of Lockman East and ELAIS N2 have average noise levels of 4.8 and 9.2 Jy beam-1, with 1.4′′ resolution. Only the central fields are used here, after correction for the primary beam response function of the VLA antennas using pbcor.
Continuum data were also obtained at 4.9 GHz in the Lockman field using the VLA in its C configuration: a mosaic of seven overlapping positions, each separated by half the primary beam. These were reduced following the standard aips recipe. After correction for the primary beam response, the resulting maps were stitched together using flatn, resulting in a noise level of 11 Jy beam-1 in the central portion of the map and a fwhm resolution of 5.5′′.
2.3 IR/Optical imaging data
Our IR data for ELAIS N2 consist of a mosaic of 16 contiguous fields, each observed in for 2 hr using the United Kingdom IR Telescope’s (UKIRT222UKIRT is operated by the Joint Astronomy Centre on behalf of the United Kingdom Particle Physics and Astronomy Research Council (PPARC).) UFTI Imager, a 10242 HgTeCd array with 0.091′′ pixels. Three 1-hr UFTI integrations were also obtained in the Lockman East field, covering four submm sources. In addition, images through a filter were obtained for ELAIS N2 (1.5-hr integrations) and Lockman East (1-hr integrations covering 17 submm sources) using the William Herschel Telescope’s (WHT333Based on observations made with the WHT operated on the island of La Palma by the Isaac Newton Group in the Spanish Observatorio del Roque de los Muchachos of the Instituto de Astrofisica de Canarias) INGRID camera, a 10242 device with 0.237′′ pixels. The IR data for ELAIS N2 and their reduction are described by Roche et al. (2002).
-band imaging of ELAIS N2 was obtained with the Prime Focus Camera (PFC) on the WHT during 1999 May. At that time the PFC used a single EEV 4096 2048 detector with a pixel scale of 0.236′′ and a field of view of . Two adjacent pointings were obtained to cover a field of view of with integration times of 1 hr each. The data were reduced using standard methods of bias subtraction, flat-fielding, de-fringing, extinction correction, registration and co-addition. The astrometric solution was obtained by comparison with the positions of stars in the United States Naval Observatory (USNO) A2.0 catalogue. The measured seeing is 0.7′′. Photometric calibration was performed using observations of Landolt standard stars. The 3 limiting magnitude in a 4′′-diameter aperture is .
- and -band imaging of ELAIS N2 was obtained with the Mosaic PFC on the WHT during 2000 June and 2001 May. This instrument comprises two EEV 4096 2048 detectors with 0.236′′ pixels and a field of view of . In the filter, eighteen 10-min exposures were obtained at a variety of pointing positions: a total area of 370′2, with the central 140′2 receiving the full integration time of 3 hr. In , a total of 1 hr of integration was obtained: twelve 5-min exposures dithered by 20′′ east–west. The data were reduced as described above and have seeing of 0.9′′ () and 0.7′′ (). The 3 limiting magnitudes are and .
-band imaging of the Lockman Hole was obtained with the PFC on the WHT during 2000 November: twelve 6-min exposures, dithered east-west by 20′′. The combined data have a measured seeing of 0.8′′ and a 3 limiting magnitude of .
We have chosen to measure magnitudes (Table 2) and colours for galaxies from our optical/IR frames using a 4′′-diameter photometry aperture — equivalent to kpc at the likely redshifts of the submm sources, corresponding to effective total magnitudes. In this we differ from the standard procedure for faint galaxy photometry which usually relies on applying an aperture correction to photometry of sources taken with a small diameter, 2–3 fwhm, aperture. Our choice introduces a penalty in the precision of our photometry but it does guarantee that we obtain representative total magnitudes and colours for even the most extended counterparts to our submm sources (e.g. Lutz et al. 2001).
2.4 X-ray imaging
The Lockman Hole was observed by XMM-Newton during its performance verification phase, and the data are presented in Hasinger et al. (2001). Five observations were made, each with slightly different pointing centres and roll angles. For this analysis we have reprocessed the data with a more recent versions of the XMM-Newton Science Analysis System (SAS) taking advantage of the improved calibration data now available. After screening out periods of high particle background, the total exposure time is just over 100 ks. Data from all three EPIC cameras, in all five observations, were transformed to a common astrometric system and the combined data were used to produce images in the energy bands 0.2–0.5 keV, 0.5–2 keV, 2–5 keV and 5–12 keV. Energy channels contaminated by the strong instrumental emission lines (Lumb et al. 2002) were excluded from the images. The images were source-searched using the latest (SAS 5.3) versions of the SAS detection tasks eboxdetect and emldetect, and images in all bands were searched simultaneously. Background maps for use in the source detection were constructed for each instrument, in each observation, and for each energy band, by performing a maximum likelihood fit of a vignetted (photon) and unvignetted (instrumental) background to the images after excising all detected sources. Several iterations of source detection followed by background determination were used to optimise the background model and thereby the sensitivity.
All of the Lockman East submm sources lie within the combined XMM-Newton images, although LE 850.5 and LE 850.11 are so far off axis that they are only covered by the MOS cameras. We discuss the source properties in §4.3.
Chandra X-ray observations of the ELAIS N2 field are described in Manners et al. (2002). The field was observed using the array of ACIS-I CCDs during 2000 August for 75 ks to a flux limit of erg s-1 cm-2 (0.5–10.0 keV). Our optical imaging was also used to secure the X-ray astrometry to an accuracy of rms. Full details of the X-ray catalogue, source counts and hardness ratios can be found in Manners et al. (2002). The optical/IR identifications, photometry and preliminary spectra can be found in González-Solares et al. (2002) and Willott et al. (2002). Details of the X-ray/sub-mm coincidence and cross-correlation can be found in Almaini et al. (2002).
| Source | Submm position | Radio position | Radio- | Direction relative | ||||||
| name1 | submm | to submm centroid | ||||||||
| h m s | /mJy | h m s | /Jy | /Jy | offset ′′ | and other comments | ||||
| LE 850.1 | 10 52 01.4 | 57 24 43 | 10.5 1.6 | 10 52 01.25 | 57 24 45.7 | 73 10 | 56 37 | 3.1 | 0.014 | compact source to NNW |
| LE 850.2 | 10 52 38.2 | 57 24 36 | 10.9 2.4 | 10 52 38.30 | 57 24 35.8 | 29 11 | 5 266 | 1.0 | 0.003 | central |
| 10 52 38.39 | 57 24 39.5 | 24 9 | 5 266 | 4.0 | 0.058 | to NNE | ||||
| LE 850.3 | 10 51 58.3 | 57 18 01 | 7.7 1.7 | 10 51 58.02 | 57 18 00.3 | 98 12 | 109 26 | 2.8 | 0.007 | compact source to W |
| 10 51 57.98 | 57 17 56.5 | 19 13 | 5.5 | 0.104 | to SW; 3 peak | |||||
| LE 850.4 | 10 52 04.1 | 57 25 28 | 8.3 1.8 | 10 52 04.00 | 57 25 24.1 | 19 8 | 5 60 | 4.1 | 0.085 | to S, 3 peak |
| LE 850.5 | 10 51 59.3 | 57 17 18 | 8.6 2.0 | 5 25 | 5 300 | |||||
| LE 850.6 | 10 52 30.6 | 57 22 12 | 11.0 2.6 | 10 52 30.73 | 57 22 09.5 | 54 14 | 60 35 | 2.8 | 0.018 | to S, resolved |
| LE 850.7 | 10 51 51.5 | 57 26 35 | 8.1 1.9 | 10 51 51.69 | 57 26 36.0 | 135 13 | 5 60 | 2.2 | 0.003 | resolved? to NE; §3.1 |
| 10 51 51.66 | 57 26 30.4 | 15 9 | 5 60 | 4.9 | 0.096 | to SSE; 3 peak | ||||
| LE 850.8 | 10 52 00.0 | 57 24 21 | 5.1 1.3 | 10 52 00.26 | 57 24 21.7 | 58 12 | 57 32 | 2.6 | 0.012 | to NEE |
| 10 51 59.76 | 57 24 24.8 | 22 11 | 5 60 | 4.5 | 0.080 | to NNW; 4 peak | ||||
| (LE 850.9) | 10 52 22.7 | 57 19 32 | 12.6 3.2 | 5 23 | 5 90 | |||||
| (LE 850.10) | 10 51 42.4 | 57 24 45 | 12.2 3.1 | 5 25 | 5 120 | |||||
| (LE 850.11) | 10 51 30.6 | 57 20 38 | 13.5 3.5 | 10 51 31.30 | 57 20 40.2 | 26 12 | 5 400 | 7.2 | 0.102 | to NEE, resolved |
| LE 850.12 | 10 52 07.7 | 57 19 07 | 6.2 1.6 | 10 52 07.49 | 57 19 04.0 | 278 12 | 380 28 | 3.7 | 0.004 | to SSW; variable |
| 10 52 08.06 | 57 19 02.6 | 27 11 | 5 200 | 5.6 | 0.086 | to SE, 4 peak | ||||
| LE 850.13 | 10 51 33.6 | 57 26 41 | 9.8 2.8 | 10 51 33.14 | 57 26 36.7 | 18 11 | 5 100 | 6.3 | 0.109 | to SW; 3 peak |
| LE 850.14 | 10 52 04.3 | 57 26 59 | 9.5 2.8 | 10 52 04.22 | 57 26 55.4 | 72 12 | 30 18 | 3.7 | 0.021 | to S |
| 10 52 04.06 | 57 26 58.5 | 36 12 | 2.4 | 0.017 | to SW; 6 peak | |||||
| (LE 850.15) | 10 52 24.6 | 57 21 19 | 11.7 3.4 | 5 21 | 5 60 | |||||
| LE 850.16 | 10 52 27.1 | 57 25 16 | 6.1 1.8 | 10 52 27.58 | 57 25 12.4 | 41 12 | 32 22 | 6.0 | 0.061 | to SE, resolved? |
| LE 850.17 | 10 52 16.8 | 57 19 23 | 9.2 2.7 | 5 23 | 5 90 | |||||
| LE 850.18 | 10 51 55.7 | 57 23 12 | 4.5 1.3 | 10 51 55.47 | 57 23 12.7 | 47 10 | 38 19 | 2.4 | 0.013 | to W |
| LE 850.19 | 10 52 29.7 | 57 26 19 | 5.5 1.6 | 5 27 | 5 67 | |||||
| (LE 850.20) | 10 52 37.7 | 57 20 30 | 10.3 3.1 | 5 24 | 5 90 | |||||
| LE 850.21 | 10 52 01.7 | 57 19 16 | 4.5 1.3 | 10 52 01.73 | 57 19 17.1 | 21 10 | 5 125 | 1.1 | 0.002 | central |
| N2 850.13 | 16 37 04.3 | 41 05 30 | 11.2 1.6 | 16 37 04.34 | 41 05 30.3 | 45 16 | 0.7 | 0.002 | to W, 4 peak | |
| 16 37 04.48 | 41 05 30.1 | 31 14 | 2.6 | 0.021 | to E, 3 peak | |||||
| 76 20 | total flux for double | |||||||||
| N2 850.23 | 16 36 58.7 | 41 05 24 | 10.7 2.0 | 16 36 58.19 | 41 05 23.8 | 92 16 | 7.7 | 0.032 | compact source to W | |
| N2 850.3 | 16 36 58.2 | 41 04 42 | 8.5 1.6 | 5 44 | ||||||
| N2 850.4 | 16 36 50.0 | 40 57 33 | 8.2 1.7 | 16 36 50.43 | 40 57 34.5 | 221 17 | 6.5 | 0.010 | compact source to NEE | |
| 16 36 50.08 | 40 57 31.1 | 30 16 | 2.2 | 0.023 | to S, 3 peak | |||||
| N2 850.5 | 16 36 35.6 | 40 55 58 | 8.5 2.2 | 16 36 35.28 | 40 55 59.2 | 77 31 | 4.9 | 0.021 | to W, 4 peak | |
| 16 36 35.30 | 40 55 59.5 | 50 23 | 4.8 | 0.032 | to NW, 3 peak | |||||
| N2 850.6 | 16 37 04.2 | 40 55 45 | 9.2 2.4 | 16 37 04.49 | 40 55 39.2 | 38 19 | 7.2 | 0.085 | to SSE, 2–3 peak | |
| N2 850.7 | 16 36 39.4 | 40 56 38 | 9.0 2.4 | 16 36 39.01 | 40 56 35.9 | 159 27 | 6.3 | 0.014 | to SW; 7; tail to SE | |
| N2 850.8 | 16 36 58.8 | 40 57 33 | 5.1 1.4 | 16 36 58.78 | 40 57 28.1 | 74 29 | 4.9 | 0.033 | to S; 4 peak | |
| N2 850.9 | 16 36 22.4 | 40 57 05 | 9.0 2.5 | 16 36 22.54 | 40 57 04.8 | 33 12 | 2.0 | 0.014 | to E, 4–5 peak | |
| 16 36 22.34 | 40 57 08.3 | 40 19 | 3.4 | 0.033 | to NW, 2 peak | |||||
| N2 850.10 | 16 36 48.8 | 40 55 54 | 5.4 1.5 | 16 36 49.29 | 40 55 50.8 | 58 24 | 8.0 | 0.055 | double to SE, 3 peak | |
| N2 850.11 | 16 36 44.5 | 40 58 38 | 7.1 2.0 | 5 44 | ||||||
| N2 850.12 | 16 37 02.5 | 41 01 23 | 5.5 1.6 | 16 37 02.26 | 41 01 19.1 | 32 17 | 5.3 | 0.067 | to SW, 3 peak | |
| N2 850.13 | 16 36 31.2 | 40 55 47 | 6.3 1.9 | 16 36 31.47 | 40 55 46.9 | 99 23 | 4.1 | 0.011 | to E, resolved? 6 peak | |
| (N2 850.14) | 16 36 19.7 | 40 56 23 | 11.2 3.3 | 5 49 | ||||||
| N2 850.15 | 16 37 10.2 | 41 00 17 | 5.0 1.5 | 16 37 10.42 | 41 00 23.0 | 31 20 | 6.8 | 0.096 | to NNE; 2 peak | |
Notes: (1) Sources in parentheses are excluded from further analysis on the basis of large values (see §3.3). (2) Probability that the radio source is not associated with the submm emission (see §3.2); (3) Photometry-mode observations at the radio positions give mJy and mJy for N2 850.1, mJy and mJy for N2 850.2. Errors include an uncertainty of 10 per cent for the absolute flux scale.
2.5 Positional ambiguity between reference frames
There has been a tendency in the past to ignore potential offsets of up to 1′′ between the radio/mm and optical/IR coordinate frames (e.g. Georgakakis et al. 1999). Unfortunately, this offset corresponds to the spatial scale expected for moderate and strong lensing (Chapman et al. 2002b) and identifying such offsets is therefore significant for interpreting the association of submm sources with optically bright galaxies. This situation is inevitable in mm interferometry, where the primary beam has a FWHM of only 20′′ and contains only the source of interest (Downes et al. 1999; Bertoldi et al. 2000; Frayer et al. 2000; Gear et al. 2000; Lutz et al. 2001; Dannerbauer et al. 2002) but at radio wavelengths the primary beam is sufficiently large ( 30′ at 1.4 GHz for the VLA) to permit investigation of potential offsets.
For this analysis, we used the Lockman East -band and 1.4-GHz maps. Our optical/IR images were astrometrically calibrated using stars from the USNO A2.0 catalogue (Monet et al. 1998; see also Assafin et al. 2001). Seventy stars were used to calibrate the -band image to the USNO reference frame, with an rms of 0.05′′. The positions of the radio sources on our VLA map are defined relative to a nearby type-A primary phase calibrator (i.e. unresolved, with a position known to 0.02′′). The brightest 32 1.4-GHz sources ( 8 at their peak) were selected from the radio image; of those, 17 had bright, compact optical counterparts (a few more had faint counterparts but these were ignored). Positions for these sources were measured using 2-D Gaussian fits.
The mean offsets between the radio and optical frames were , , i.e. the radio image was slightly south and west of the optical image. A similar analysis was performed for the ELAIS N2 -band and radio images, finding offsets of , . In the analysis that follows, and the plots, positional information has always been corrected to the radio coordinate frame, using the aips tasks lgeom, hgeom and ohgeo.
In terms of our confidence in assigning optical/IR host galaxies to radio sources, we now have several uncertainties to be added in quadrature: a) the uncertainty in the measured radio position, often given as (where fwhm is the source or beam size at full width at half maximum and s/n is the signal-to-noise ratio); b) the uncertainty in the alignment of the frames () and c) the uncertainty in the measured optical position, . For the faintest optical/1.4-GHz sources, the total error budget is (after the frames have been aligned); for the brightest sources this drops to .
3 Submm–radio associations and sample refinement
3.1 Selection of candidate radio counterparts
The happy source detection routine developed for the FIRST survey (Faint Images of the Radio Sky at Twenty centimetres — White et al. 1997) was used initially, followed by more detailed analysis of the sources thus extracted. A radio source peaking at 4 in the 1.4′′ or smoothed images, with an integrated flux density in excess of 30 Jy (15 Jy for Lockman), is considered a robust detection. Fainter sources, where the definition is relaxed to only the integrated flux (again 30 Jy, or 15 Jy in the Lockman field), were also catalogued.
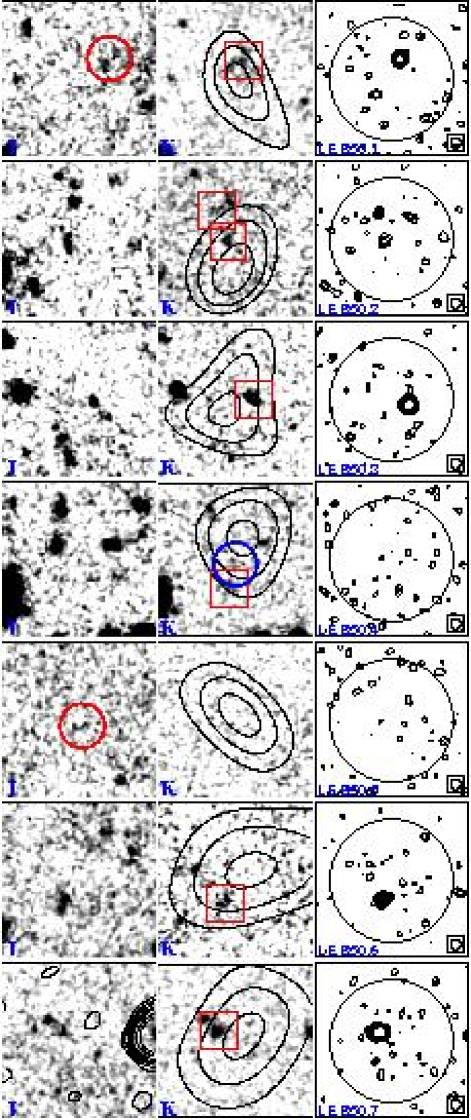
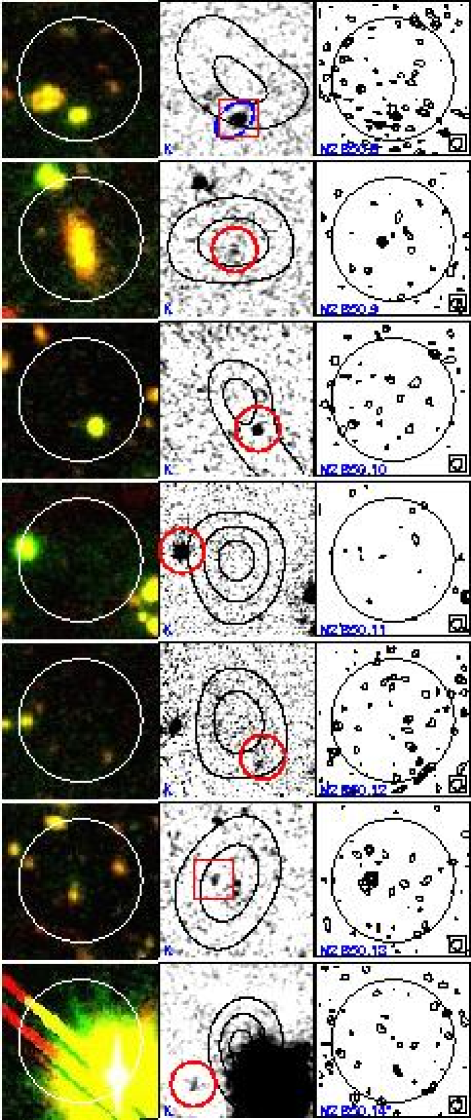
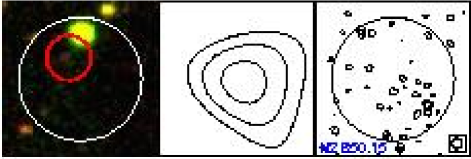
For each sub-mm source we have searched for a potential radio (1.4 GHz) counterpart out to a radius of 8′′ from the nominal SCUBA position deduced by S02 (see Figs 1 and 2). This relatively large search area (200′′2 around each source) is required to ensure that per cent of real associations are missed, given the angular size of the JCMT beam at 850 m (14′′ fwhm) and the fact that the majority of the SCUBA detections have s/n 3.5–4.0. Fortunately, as demonstrated by the calculations described below, this large search radius for radio counterparts can be tolerated without compromising the statistical significance of genuine associations. This is because, even at the extreme depths reached by the radio imaging reported here, the cumulative surface density of radio sources is only arcmin-2.
Of the 36 submm sources in the sample, ten have no candidate radio counterparts, 20 have clearly detected candidate radio counterparts and the remaining six have faint candidate radio counterparts. The flux densities and positions of all candidate radio counterparts are listed in Table 1.
3.2 Statistical significance of submm–radio associations
To quantify the formal significance of each of the potential submm–radio associations listed in Table 1 we have used the method of Downes et al. (1986). This corrects the raw Poisson probability that a radio source of the observed flux density could lie at the observed distance from the submm source for the number of ways that such an apparently significant association could have been uncovered by chance (given the limiting search radius, the limiting depth of the available radio data and the flux density of the radio detection). This correction is extremely important for the present study due to the large search radius adopted above. Based on the raw Poisson probabilities, all but one of the associations listed in Table 1 would be judged to be significant at 2 (i.e. ).
In fact, from the corrected probability, , that a radio detection is not associated with the submm source (listed in Table 1) a relatively straightforward picture emerges which can be summarised as follows. Of the 21 sources in the Lockman Hole East field, ten have statistically robust radio counterparts at better than the level, four have potential submm–radio associations which are not formally significant () and seven have no potential radio counterparts within the adopted search radius. Of the 15 sources in the ELAIS N2 field, eight have statistically robust radio counterparts with , four have potential submm–radio associations which are not formally significant, and three have no potential radio counterparts within the adopted search radius.
Of the ten sources which have more than one potential radio counterpart, we find that the correct identification is statistically obvious in five cases (LE 850.2, LE 850.3, LE 850.7, LE 850.8, LE 850.12) and that the formal probability of the second candidate association occurring by chance is fairly high, . This leaves five SCUBA sources which have more than one formally significant submm–radio association (LE 850.14, N2 850.1, N2 850.4, N2 850.5, N2 850.9). The only obvious interpretations of such multiple statistical associations are either gravitational lensing, or clustering of star-forming objects/AGN at the source redshift.
In total, then, this calculation has yielded statistically robust radio counterparts for 18 of the 36 sub-mm sources, and 13 statistically insignificant apparent associations (comprising eight other submm sources and five secondary candidate radio identifications from among the successfully identified sources). The plausibility of this latter figure can be checked by noting that the areas inside and outside the circles in Figs 1 and 2 are equal (200′′2), and that in total 11 random ‘field’ radio sources (three robust plus ten tentative) are detected in the outer areas.
As a consistency check on the appropriateness of our choice of search radius, we note that 14 of the 18 statistically robust radio identifications lie within 4′′ of the sub-mm position, consistent with the 12 we would expect for a 95 per cent positional confidence circle of radius 8′′. We thus expect to have lost true radio identifications from our sample due to our limited search area. No systematic offset between the submm and radio coordinate frames was found ().
Our radio detection rate compares favourably with other submm surveys. Only the Smail et al. (2002a) survey through galaxy clusters has comparable radio coverage (due to the lens amplification): they identify radio counterparts to seven of their 15 galaxies. The surveys by Barger et al. (1999a), Chapman et al. (2002a), Eales et al. (2000), Hughes et al. (1998) and Webb et al. (2002b) have far lower detection rates due to a mismatch in the depth of their submm and radio imaging.
In fact, as explained below, the results of this radio identification exercise can be used to refine the original 8-mJy SCUBA survey source list for the effects of confusion and flux boosting at 850 m, with the consequence that our final radio identification rate is 18/30 sources, or 60 per cent.

3.3 Radio identification trends and submm sample refinement
As already explained, the 36 submm sources listed in Table 1 for which we have sought radio counterparts have been drawn from the sample of 36 sources with extracted by S02 from 850-m maps of the Lockman Hole and ELAIS N2 fields, after rejection of the two least significant sources in the ELAIS N2 field (N2 850.16 and N2 850.17) in light of additional submm data. However, as detailed by S02, the adoption of a 3.5 threshold represents a compromise designed to ensure 85-per-cent completeness, albeit at the expense of some contamination of the resulting 8-mJy source list via confusion from sources with true submm flux densities, mJy. In particular, from simulations using the real noise maps of the 8-mJy survey fields, S02 predicted that at the 3.5 level, 20 per cent of the Lockman Hole 8-mJy ‘sources’, and 15 per cent of the ELAIS N2 8-mJy ‘sources’ could be expected to arise from confusion.
This raises an obvious question: how might one identify which sources these are? One clear prediction is that such ‘fake’ 8-mJy submm sources will not have detectable radio counterparts. However, it would be foolish to assume that all nine of the submm sources from the 36-source parent sample which lack a possible radio counterpart in the maps presented here are not real — genuine sources could also evade radio detection, either because they lie close to the flux limit of the submm survey or because they lie at extreme redshift. In this section we therefore explore what can be learned about the submm sources without radio counterparts by examining trends in radio identification rate.
In Fig. 3 we have plotted, in the top row, the running (i.e. cumulative) average radio identification rate for the submm sources from the ELAIS N2 and Lockman Hole sub-samples as a function of submm source significance, submm flux density and, lastly, submm flux uncertainty. These plots are revealing. The plot of identification rate versus submm source significance shows some drop off towards 3.5 . This does not appear to be serious, in the sense that the identification fraction achieved at the 3.5 level is consistent with that already achieved for sources at 4 . However, the plot of identification rate versus submm flux density is peculiar, with the four brightest submm sources from the Lockman Hole field lacking a radio identification. This must mean either that these brightest sources lie at extreme redshift, or that they are not real. The third plot shows that the latter explanation is almost certainly the correct one. This plot — radio source identification rate versus submm noise — shows that the four brightest submm sources in the Lockman Hole field all have mJy. Their brightness therefore simply reflects the fact that they have passed the 3.5 threshold while being extracted from unusually noisy regions of the original map. It can also be seen from this plot that another Lockman Hole source, and one ELAIS N2 source, also have mJy and also lack radio counterparts.
The most conservative course of action in the light of these trends is to assume that all six of the submm sources with mJy are not real and to excise them from the sample. As shown in the right-hand column of Fig. 3, when this is done the trends in radio identification rate are more plausible and, interestingly, the identification statistics for the two fields are now statistically consistent, with both survey regions yielding a final radio-source identification rate of 60 per cent.
In the remainder of this paper we therefore reject the six sources with mJy from the original sample, and confine subsequent analyses to a refined sample of 30 sources which should not be seriously biased by erroneous radio blank fields. The six sources rejected on this basis are LE 850.9, LE 850.10, LE 850.11, LE 850.15, LE 850.20 and N2 850.14.
We stress that the rejection of these sources is consistent with expectations based on the the simulations performed by S02. Specifically, based on these simulations S02 predicted that four of the 21 3.5 Lockman Hole sources, and two of the original 17 3.5 ELAIS N2 sources would likely be the result of confusion. Here, on the basis of the trends shown in Fig. 3, we have rejected five sources from the Lockman Hole sample, and one source from the ELAIS N2 sample. Interestingly, the only other source in the original ELAIS N2 sample which had mJy was N2 850.16, which we have already rejected in the light of additional 850-m data. The simulations also predict that submm source confusion should only be capable of producing fake sources as bright as mJy if the local submm map noise level is mJy or greater. Thus it is to be expected that the ‘fake’ sources should turn out to be found among the apparently brightest sources selected from the noisiest regions of the original submm images (generally close to the edge of the maps).
In summary, we have exploited the observed trends in radio identification rate to decide on a criterion ( mJy) for rejecting those sources from the parent 36-source submm sample which appear to be the result of source confusion and/or severe submm flux boosting by noise. The number of sources rejected on this basis (i.e. six) is in line with expectations based on the simulations of S02 and therefore does not affect the source-count estimates derived in that paper. However, their excision from the sample under study here is important because otherwise it would be erroneously concluded that their non-detection at radio wavelengths implies they lie at very high redshift. Their removal thus avoids a potentially serious bias being introduced into our best estimate of the redshift distribution of the 8-mJy population (see §4.5).
| Source | Optical/IR3 | Comments | ||||
| name1 | morphology | mag4 | mag4 | mag4 | mag4 | |
| LE 850.1 | M | 19.8 0.2 | — | 3 25.0 | — | ERO5 |
| LE 850.2 | M | 20.32 0.24 | — | 23.26 0.16 | — | Central object. VRO to N |
| LE 850.3 | M | 18.86 0.09 | — | 23.24 0.15 | — | ERO |
| LE 850.42 | F | 19.56 0.15 | — | 3 25.0 | — | ERO |
| LE 850.5 | F | 3 20.6 | — | 24.29 0.29 | — | Faint, extended optical galaxy? |
| LE 850.6 | M | 19.22 0.16 | — | 22.71 0.07 | — | Obvious double in and ; VRO |
| LE 850.7 | M | 17.93 0.06 | — | 22.56 0.10 | — | Radio lobe; blue galaxy/ERO6 pair |
| LE 850.8 | M | 18.82 0.09 | — | 21.59 0.03 | — | Mags include both components |
| (LE 850.9) | B (F?) | 3 20.5 | — | 3 25.0 | — | Very faint near submm centroid? |
| (LE 850.10) | F | 3 20.6 | — | 3 25.0 | — | Blank field |
| (LE 850.11) | F | 3 20.6 | — | 24.35 0.40 | — | Red/blue pair? |
| LE 850.12 | C | 3 20.6 | — | 22.66 0.08 | — | Radio indicates AGN |
| LE 850.13 | F | 3 20.6 | — | 24.44 0.39 | — | Faint -band emission? |
| LE 850.14 | F | 20.34 0.39 | — | 23.67 0.24 | — | Faint and emission; VRO |
| (LE 850.15) | M | 3 20.4 | — | 23.28 0.14 | — | Tadpole-shaped counterpart? |
| LE 850.162 | F | 19.35 0.05 | — | 23.94 0.27 | — | ERO + blue/ERO7 pair |
| LE 850.172 | F | 19.78 0.18 | — | 3 25.0 | — | ERO/blue galaxy pair |
| LE 850.18 | M | 3 20.4 | — | 24.59 0.39 | — | Complex optical system |
| LE 850.19 | C | 19.09 0.03 | — | 22.17 0.04 | — | Bright compact source? |
| (LE 850.20) | M | 20.28 0.44 | — | 22.66 0.07 | — | Faint and emission? |
| LE 850.21 | M | 19.73 0.17 | — | 24.09 0.25 | — | ERO/blue pair (faint radio) |
| N2 850.1 | C | 19.48 0.24 | 22.93 0.02 | 21.99 0.03 | 23.19 0.03 | Lens? (Chapman et al. 2002b) |
| N2 850.2 | M | 19.77 0.06 | 25.42 0.43 | 24.48 0.20 | 3 25.9 | ERO |
| N2 850.3 | F | 21.12 0.14 | 25.07 0.20 | 24.14 0.19 | 25.22 0.26 | Red/blue galaxy pair |
| N2 850.4 | M | 18.43 0.02 | 22.28 0.01 | 21.83 0.02 | 22.40 0.03 | Blue galaxy/VRO pair. |
| N2 850.5 | B | 3 20.7 | 3 26.0 | 3 25.0 | 3 25.9 | |
| N2 850.6 | M | 19.54 0.24 | 24.21 0.07 | 23.29 0.08 | 24.23 0.12 | Blue/red galaxy pair |
| N2 850.7 | M | 19.54 0.06 | 23.46 0.03 | 22.44 0.03 | 23.68 0.06 | Blue/red galaxy pair |
| N2 850.8 | M (C?) | 18.15 0.09 | 22.49 0.02 | 21.55 0.02 | 22.79 0.03 | X-ray AGN; VRO |
| N2 850.9 | M | 17.9 0.4 | 20.7 0.2 | 19.4 0.2 | 20.7 0.2 | Large-aperture mags |
| N2 850.10 | C | 19.56 0.24 | 20.96 0.10 | 20.41 0.01 | 21.23 0.03 | Compact blue counterpart? |
| N2 850.11 | C | 17.26 0.01 | 20.93 0.01 | 19.44 0.01 | 21.78 0.03 | Compact counterpart, or blank? |
| N2 850.12 | F (M?) | 20.57 0.14 | 24.96 0.10 | 23.84 0.12 | 24.62 0.14 | VRO |
| N2 850.13 | B | 21.00 0.64 | 3 26.0 | 3 25.0 | 3 25.9 | Blue galaxy/ERO pair |
| (N2 850.14) | F | 19.47 0.17 | — | — | — | Optical images saturated |
| N2 850.15 | F | — | 25.18 0.12 | 24.13 0.12 | 25.82 0.40 | Several possible faint counterparts |
Notes: (1) Details in italics refer to plausible counterparts (those circled Figs 1 and 2). Sources with robust submm–radio associations (§3.2) have their names in bold. Sources excluded from further analysis on the basis of large values (see §3.3) are named in parentheses. (2) Sources with well-determined positions on the basis of extreme colours and/or weak radio emission. (3) Morphologies are categorised as: B, blank; F, very faint; C, compact; M, multiple/distorted; —, unknown. (4) Magnitudes were measured in 4′′-diameter apertures. (5) Lutz et al. (2001) showed LE 850.1 to be a clumpy ERO. (6) Magnitudes for the red component: =18.43 0.05, =22.93 0.12. (7) ERO to the NW has .
4 Source characteristics
We now discuss the radio and optical/IR information gathered for the SCUBA sources in the refined 30-source 8-mJy sample. The optical/IR morphologies and colours of the proposed identifications are listed in Table 2.
To quantify the classification of the colours of the optical/IR identifications, we note that the general field galaxy population brighter than has a median , with 6 per cent of the galaxies redder than and 20 per cent redder than . Hence in the following we adopt the standard definition of an extremely red object, ERO, of , and in addition use the term “very red object” (VRO) to denote galaxies with .
4.1 Notes on individual sources
LE 850.1: the submm–radio association is unambiguous and statistically significant, and in this case confirmed by 1.3-mm interferometry in the detailed study of this object presented by Lutz et al. (2001). Deep IR imaging, also presented by Lutz et al., permits the submm galaxy to be identified with a complex red object offset to the east of the faint -band emission circled in Fig. 1 ().
LE 850.2: at least two potential 1.4-GHz counterparts, seemingly confirmed in the lower resolution 4.9-GHz image and in a smoothed version of the 1.4-GHz map (3′′ FWHM). There is an equally complex picture in the optical/IR: faint -band components stretch from the submm centroid towards the N and NNE; emission is associated with several of them, with an extremely red object (ERO) and a very red object (VRO) close to, but not coincident with, two of the optical sources — composite blue/red systems, both with radio emission ( and , respectively). However, statistically the correct radio identification is clear, and the corresponding optical identification is the more central optical source.
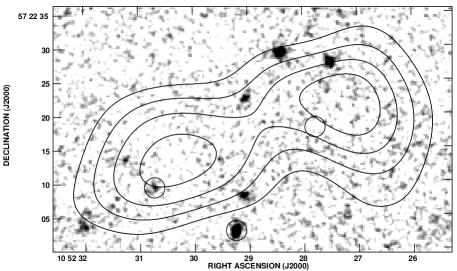
LE 850.3: a strong, and statistically compelling radio counterpart is found to be aligned with an ERO, a distorted/multi-component galaxy in the -band image, typical of submm host galaxies (Smail et al. 1998, 1999). A very close resemblence to LE 850.7 led us to check for nearby sources: another 1.4-GHz source lies 14.5′′ to the east. Both have -band counterparts (Fig. 4) and we view an association with a twin-lobed radio galaxy to be unlikely in this case. The radio spectral index, , indicates a probable AGN contribution.
LE 850.4: A complex field, but an ERO to the south (detected at 1.4 GHz) is probably the galaxy responsible for the submm emission (although the formal significance of the submm–radio association falls just above the level). A faint XMM-Newton 2–5-keV counterpart is detected, coincident with the submm source position. The position of the X-ray source is just consistent with that of the ERO/Jy radio source. The absence of any X-ray emission below 2 keV means this is likely an obscured AGN, with a column density of cm-2.
LE 850.5: the one faint potential submm-radio association is not statistically convincing. At optical/IR wavelengths this is a blank field although there is a hint of -band emission at the position of the submm centroid.
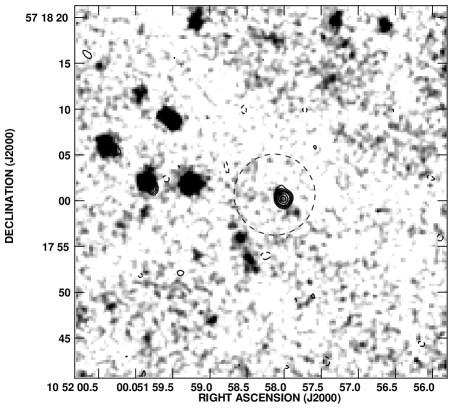
LE 850.6: this source is unambiguously associated with a faint, resolved radio source with a faint, similarly-shaped distorted/multi-component VRO visible in and . The 850-m contours in Fig. 1 suggest another submm source lies to the west. Further investigation revealed a 3.48 source (R.A. , Dec. , J2000, 10.2 3.1 mJy) not included in the original S02 catalogue, with a robust 1.4-GHz counterpart but no optical or IR emission (Fig. 5). Both 1.4-GHz sources have faint emission at 4.9 GHz, so there is no evidence that these are steep-spectrum sources as found for LE 850.7, and no sign of a flat-spectrum core between them.
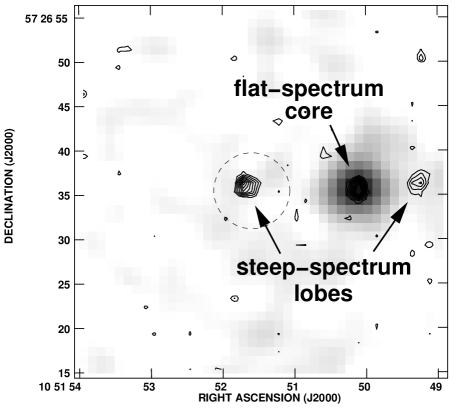
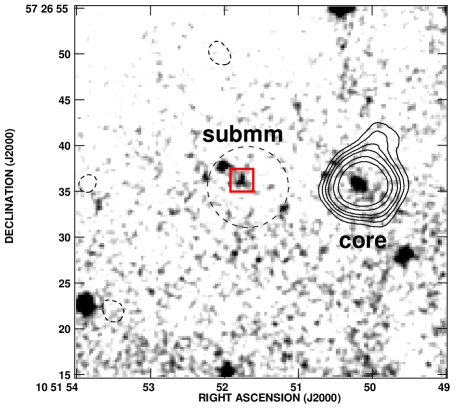
LE 850.7: apparently a carbon copy of LE 850.3, even with regard to position angle. This seems at first to be a straightfoward case: a bright, compact and statistically compelling radio source is found within a few arcseconds of the submm position, with a faint, seemingly disturbed, optical counterpart — an ERO. In fact, the 1.4-GHz emission seen in Fig. 1 has an extremely steep spectrum (steeper than ). Examining the 1.4- and 4.9-GHz data closely (Fig. 6), another source is apparent, with an inverted spectrum, to the west of the submm source (R.A. , Dec. , J2000); a weaker steep-spectrum source is visible beyond that. These are the characteristics of a double-lobed radio galaxy. The core has flux densities of and Jy at 1.4 and 4.9 GHz and has an obvious optical counterpart (Fig. 6). With such a steep spectrum, it seems implausible that the radio component at the submm position could be responsible for the optical emission via the synchrotron mechanism (the extrapolated flux density in the -band is many orders of magnitude too low, and the counter lobe has no optical counterpart). We suggest instead that the optical galaxy is part of a system undergoing an intense burst of star formation triggered by a jet from a neighbouring radio galaxy. LE 850.3 and LE 850.12 (possibly LE 850.14 and LE 850.18) are other systems plausibly associated with radio-loud AGN.
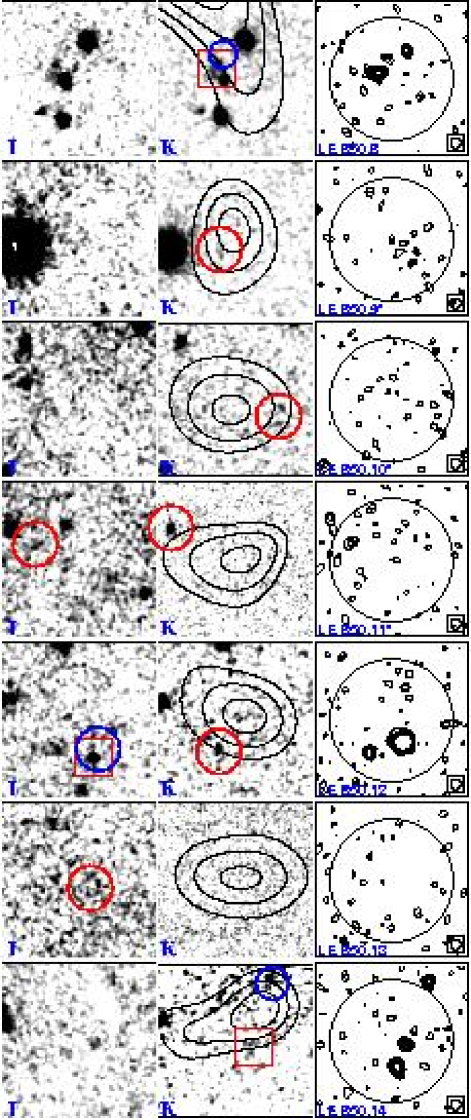
LE 850.8: a statistically robust radio counterpart is aligned with the faint north-eastern extension of a complex galaxy or group of galaxies visible in . Probably the site of highly obscured star formation, with a less obscured companion (see Ivison et al. 2001). A highly significant XMM-Newton counterpart is detected in all but the 0.2–0.5-keV image, 2′′ NNE of the submm source position, and just consistent with the brighter radio source position. This X-ray source was also detected in the Rosat Ultra Deep HRI survey by Lehmann et al. (2001), who propose that the northernmost optical/IR source in Fig. 1 is the optical counterpart, an AGN at . The position we derive from XMM-Newton is not consistent (at 90 per cent confidence) with this proposed optical counterpart, although it is consistent with the HRI position. The X-ray colours suggest that the source is intrinsically absorbed by a column density of cm-2.
LE 850.12: a very bright and statistically compelling radio counterpart is found which, at first glance appears aligned with a compact optical source. There is, in fact, a significant offset between their positions, although it is plausible that the optical source is closely related to the submm/radio emission. Faint optical emission extends 5′′ to the NW and NE. The 1.4-GHz emission appears to be variable, dropping from 345 Jy in 2001 January to 278 Jy in 2002 March. The 4.9-GHz emission is as strong as that at 1.4 GHz, leading us to conclude that this is an AGN, most likely a radio-loud quasar. This conclusion is supported by the detection of an XMM-Newton 2–5-keV counterpart coincident with the radio source. The ratio of the 2–5 keV to 0.5–2 keV flux suggests the X-ray source is intrinsically absorbed by a column density of order cm-2 or more. A fainter 1.4-GHz source lies to the east, also with the suspicion of 4.9-GHz emission, coincident with a faint optical/IR galaxy (circled in Fig. 1). However, statistically the presence of this second radio source is not surprising.
LE 850.13: the one faint potential submm–radio association is not statistically convincing. At optical/IR wavelengths this is a blank field, although there is evidence for faint -band emission at the position of the submm centroid.
LE 850.14: with reference to LE 850.7, this appears at first glance to be another twin-lobed AGN, the northern component representing the core. Another weak 1.4-GHz source further to the north (above the 95 per cent confidence circle) would represent the counter lobe, although it has a faint optical counterpart, and a 2–5-keV XMM-Newton counterpart, unlike the stronger southern ‘lobe’. The weak central component is also aligned with -band emission. However, faint 4.9-GHz emission is associated with the southern component ( Jy beam-1, Jy beam-1), and this 4.9-GHz emission argues against this being a steep-spectrum lobe (we expect 2.4 for a starburst; here we have 2.4 1.5). Whatever the true explanation, in this case the most likely statistical identification is with the central radio source which also coincides with the faint -band and -band emission. Nevertheless, the additional presence of the brighter radio source to the south is also not expected by chance, suggesting some sort of physical association.
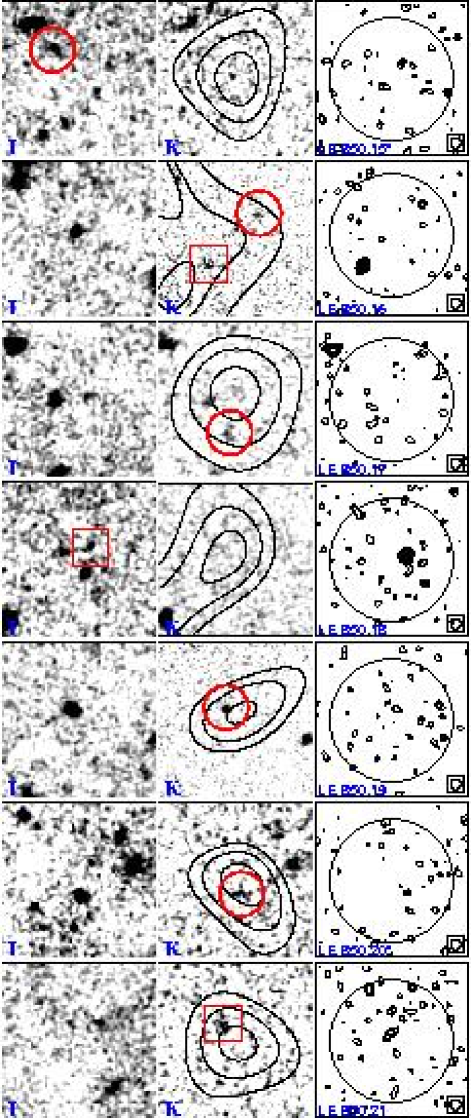
LE 850.16: a clear radio source, aligned with an ERO. The formal significance of the submm-radio association falls just above ; however, inspection of Fig. 1 suggests that the submm centroid appears to be closer to the radio source than suggested by the position derived by S02 and even a slight move in this direction would be enough to make the submm–radio association statistically convincing. The brightest -band source and another ERO to the NW — a plausible blue/red galaxy association — have no radio counterparts.
LE 850.17: conceivably the expected source with a submm position in error by more than 8′′. Within the adopted error circle this is one of only three definite radio blank fields, but a clear radio source, associated with a bright galaxy, lies 10′′ to the NE. However, the IR image reveals an ERO close to the submm centroid. It is not detected at 1.4 GHz but we consider this the more likely source of the submm emission.
LE 850.18: a clear and statistically compelling radio counterpart, roughly aligned with the faintest part of what may be a complex multi-component galaxy visible in . Deep IR imaging and optical/IR spectroscopy may yield a robust counterpart and a redshift, but caution is advised since the lessons learnt through the case of LE 850.7 show that the 1.4-GHz emission could plausibly be lobe of a radio galaxy, the other lobe being to the NE at R.A. , Dec. (J2000).
LE 850.19: a radio blank field, but a fairly bright object lies close to the submm centroid, with — a plausible host galaxy.
LE 850.21: a typical counterpart consisting of a pair of galaxies, one blue faint -band galaxy and one red, radio-detected ERO a few arcseconds to the east. Despite the relative faintness of the submm source, the submm-radio association is statistically compelling.
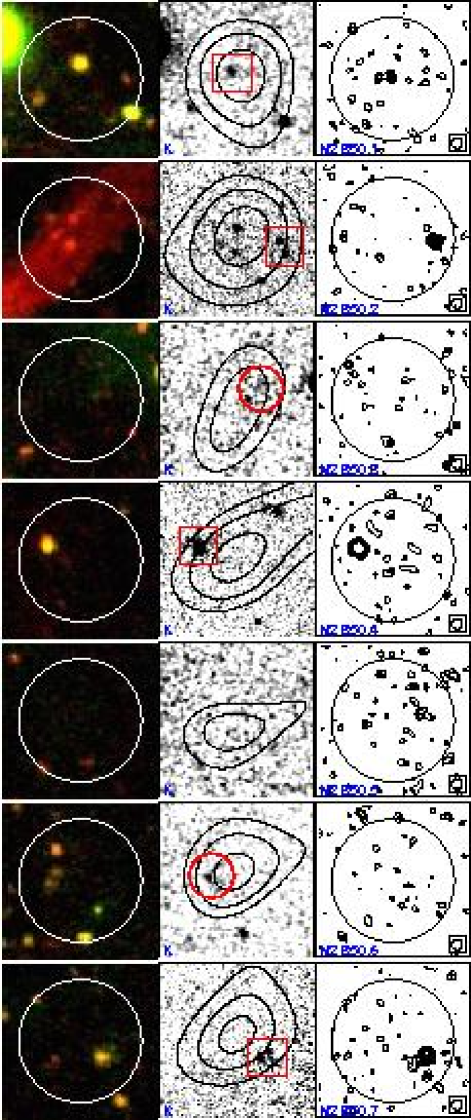
N2 850.1: three potential radio counterparts, none of which are expected by chance. This object has been discussed in depth by Chapman et al. (2002b). Spectroscopy with Keck-ii/ESI revealed a redshift of 0.84 for the bright, compact optical galaxy aligned with the brightest knot of radio emission (Chapman et al. 2002c). A weak -band extension was detected in the direction of the extended radio emission. Together with unreasonable 450-/850-m and submm/radio spectral indices (which require 23 k for ), this was taken as strong evidence for lensing of the faint background submm source by a bright foreground galaxy (see also Dunlop et al. 2002). CO observations will be required to confirm or refute the association.
N2 850.2: a strong, compact and statistically robust radio counterpart with no optical counterpart to the limits of our observations in , but with rather complex, multi-component -band emission — an ERO, or class-I counterpart.
N2 850.3: a radio blank field. Very faint emission can be seen near the submm centroid, becoming steadily brighter in the bands.
N2 850.4: two alternative submm-radio associations, the brighter of which is more statistically significant than the fainter, although the latter is also formally significant and lies closer to the submm centroid. The favoured identification is a strong, compact radio source with well-aligned emission in the optical bands. Emission in is more morphologically complex and is slightly offset from the radio and optical ( 0.5′′) — a composite blue/red galaxy pair.
N2 850.5: two alternative weak, but apparently statistically significant radio counterparts, but no clear sign of optical/IR emission. Deeper IR imaging may uncover the counterpart.
N2 850.6: an extremely complex field in the radio, with many 2 and 3 peaks near the submm position, but with none of these individually representing a formally significant submm–radio association. Similarly complicated in the optical bands, although the presence of faint emission just to the east of the submm centroid, with the -band offset by a few arcseconds, suggests that the counterpart is a composite blue/red galaxy pair.
N2 850.7: a clear and statistically unambiguous radio counterpart, slightly resolved at 1.4 GHz, with well-aligned (if complex) optical and IR emission.
N2 850.8: a weak but statistically significant radio counterpart to the south is coincident with a compact galaxy (also detected by Chandra at X-ray energies — Almaini et al. 2002). The ring galaxy to the SE cannot be ruled out as the submm source and may well be related to the Chandra galaxy.
N2 850.9: two potential radio counterparts, both formally significant, with the more significant source just east of the submm centroid being statistically favoured as the correct ID. This source is aligned with the centre of a bright optical galaxy. The galaxy’s optical morphology is not well reproduced in the IR, where the surface brightness is low. Spectroscopy and CO observations are required to confirm or refute the association.
N2 850.10: a weak possible radio counterpart to the SE of the submm position which just falls above the association threshold. The only obvious optical object does not coincide with this radio peak.
N2 850.11: at radio wavelengths this is a blank field within the adopted error circle. This is possibly a second source with a submm position in error by more than 8′′, since a bright radio source, associated with a bright and morphologically-complex optical galaxy 11′′ to the SW.
N2 850.12: a very weak potential radio counterpart, but not a formally significant radio–submm association. However a plausible red () counterpart is present, with several 3 1.4-GHz peaks in the vicinity.
N2 850.13: an obvious and statistically unambiguous radio counterpart, aligned well with a faint ERO. Spectroscopy of an optical system to the west, which appears to possess several related components, may yield the redshift of the SCUBA galaxy if this is a composite blue/red system similar to SMM J14011+0252, as suggested for the blue and ERO counterparts to SMM J14009+0252 (Ivison et al. 2000b, 2001).
N2 850.15: only a single, statistically unconvincing radio peak is found within the error circle. No convincing optical identification, and no -band data currently available.
4.2 Summary of Optical/IR characteristics
Of the 30 sources in our refined sample, 18 have statistically robust radio identifications. We robustly identify another one counterpart based on a combination of extreme optical/IR colours and faint radio emission (LE 850.4). A further source, LE 850.17, is blank in the radio but has an ERO counterpart which we consider the correct identification. Finally, a minor and very plausible shift in the submm centroid for LE 850.16 (see Fig. 1), a radio-detected ERO, would make its submm–radio association very much more significant. In total, therefore, we have localised the submm emission for 21 of the 30 sources in our sample. We list the basic properties of the sources in our two fields in Table 3.
For the seven other sources with statistically uncompelling radio associations and the two remaining radio blank fields we find only one counterpart, N2 850.12, with a colour/morphology which supports the identification. It is difficult to identify the correct counterpart in the absence of a well-determined position for the submm emission and so for those systems (at least those without unusually red counterparts) it is not possible to conclude reliably that they are truly blank, or whether the sources simply have colours indistinguishable from those of the field galaxy population.
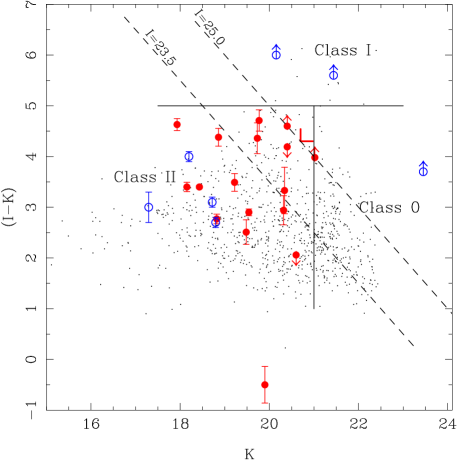
For the 21 sources with reliable radio identifications, or extreme colours, we can make a complete inventory of the optical/IR properties of their host galaxies. For these galaxies we show in Fig. 7 the distribution of radio-confirmed host galaxies on the – colour-magnitude plane. This figure demonstrates the wide variety of colours and magnitudes seen for the host galaxies of submm sources, spread across a factor of in their IR fluxes (compared to only a factor of in their submm fluxes) and encompassing a broad range in colours, similar to that seen for the field population, although typically slightly redder. In terms of the classification scheme for SCUBA galaxies (Table 4) we see that most of the galaxies are scattered across the Class I/II boundaries — more so than the Smail et al. (2002a) submm lens sample, partly because our large-diameter photometric apertures result in less extreme colours. In particular, several sources occupy the = 4–5 region, conspicuously blank previously. These class as EROs using the colour definition adopted here, but are not quite Class-I sources. Our optical and IR data are not sufficiently deep to encroach on Class-0 territory.
Among the potentially interesting statistics to be gleaned from this exercise is the fraction of submm sources with host galaxies which exhibit very red optical/IR colours, and the fraction of these red galaxies that have no radio counterparts, i.e. those with potentially large redshifts.
| Category | Radio classification1 | Optical/IR counterparts to | ||||
|---|---|---|---|---|---|---|
| /Field | robust radio associations | |||||
| Robust | Faint | Blank | Normal | E/VRO | Blank | |
| Lockman | 10 | 5 | 1 | 4 | 6 | 0 |
| ELAIS | 8 | 4 | 2 | 3 | 4 | 1 |
| Total | 18 | 9 | 3 | 7 | 10 | 1 |
Notes: (1) LE 850.16 is classified as ‘faint’ here, adopting the S02 submm position for consistency.
| Class | Optical/IR Magnitude | Description |
|---|---|---|
| 0 | and | No plausible counterpart |
| I | and | (ERO) |
| II a | and | Pure starburst |
| II b | and | Type-II (narrow-line) AGN |
| II c | and | Type-I (broad-line) AGN |
The IR and optical data for ELAIS N2 are reasonably well matched in terms of conclusively identifying VRO/ERO counterparts, although both datasets would need to be 1–2 magnitudes deeper to match the statistics available for the lensed Smail et al. (2002a) sample. Based on the photometry in Table 2 we conclude that at least two of the ELAIS submm sources are EROs: N2 850.2 and N2 850.13. N2 850.4 has a VRO component offset slightly from the radio and optical emission; N2 850.8 and N2 850.12 also classify as VROs. In Lockman, Lutz et al. (2001) show that LE 850.1 is an ERO, the complex morphology of which is confirmed by deep -band imaging from the Gemini telescope (Dunlop et al., in preparation). LE 850.3, LE 850.4, LE 850.7, LE 850.16, LE 850.17 and LE 850.21 are also EROs. The LE 850.2 field contains an ERO and a VRO, but only the latter is within the 95 per cent positional confidence region. Of all the VROs and EROs, only LE 850.17 and N2 850.12 are undetected in our deep radio images (though note that LE 850.16 has two plausible ERO host galaxies, only one of which is radio-detected). These may prove to be amongst the most distant sources in the sample, although N2 850.12 is a relatively faint submm source. Hence, at least 43 per cent of submm galaxies imaged to –21 are associated with VROs or EROs. Most of these are detected at radio wavelengths. Of the 18 submm galaxies with accurate radio positions, 33 [55] per cent have ERO [and/or VRO] counterparts, the vast majority with . We would have expected only two EROs (5 per cent) to fall within 8′′ of our submm centroids by chance (Smith et al. 2002).
For the sample with robust submm–radio associations we find a relatively small fraction of submm sources which are blank in the optical/IR – only one example (6 per cent). However, trying to determine the proportion of submm sources in the full sample which are blank in the optical/IR is much more difficult in the absence of a well-determined position for the submm source. Thus, in principle, all of the radio-undetected submm sources could be fainter than our detection limit in the optical/IR – raising the proportion of blank fields for the full population to a possible maximum of 43 per cent.
In summary, we find that almost a third of our sample of submm sources have ERO counterparts. In terms of the breakdown of counterparts between those which are detected in the optical, but have unremarkable colours, and those which are blank, we can only reliably estimate this for the radio-detected subsample: we find that 39 per cent have blue, optically bright (‘normal’) counterparts and 6 per cent are blank. These represent lower limits on the proportions in the full population. We conclude that the proportions of optically bright, ERO and blank counterparts in our sample are: 39–72:22–27:6–43 per cent, where the ranges reflect the uncertainty of identifying the host galaxies to the radio-undetected or IR-unobserved submm sources. Clearly the uncertain nature of the radio-undetected fraction of the submm population dominates our conclusions. These proportions should be compared to the 20:20:60 per cent split between optically bright, EROs and blank counterparts in the smaller sample of (typically fainter) lensed submm galaxies from Smail et al. (2002a).
In terms of the morphological properties of the sample, of the 21 sources for which we possess reliable positions based on radio detections and/or extreme colours we have the following breakdown of optical characteristics:
-
•
six are blank fields, or too faint () to be categorised morphologically;
-
•
twelve are distorted or close multiple systems;
-
•
two are compact;
-
•
one galaxy appears to be a bright, low-redshift spiral, with another bright galaxy 9′′ to the north: N2 850.9, although we note that this is the configuration most commonly associated with galaxy-galaxy lens candidates (Chapman et al. 2002b). We categorise this latter source, in a distance-independent manner, as another multiple system.
We thus find that 60 per cent of the radio-detected sub-sample are distorted/multiples, 30 per cent are very faint/blank, and the remaining 10 per cent are compact.
The data also reveal a strong tendency for submm sources to have plausible optical sources very close but not coincident with the strongest 1.4-GHz emission (e.g. LE 850.1, LE 850.8, LE 850.12, LE 850.14, N2 850.13). Many of these systems appear to be composite obscured/unobscured mergers: relatively blue galaxies with faint very red or ERO components aligned with the 1.4-GHz emission in cases where it is detected (LE 850.1, LE 850.3, LE 850.7, LE 850.8, LE 850.17, LE 850.21, N2 850.4, N2 850.13). Looking at clustering of the field galaxies in our -band images we estimate that typical = 22–25 galaxies have a companion within 5′′, compared to the 2–3′′ separation of the components in the ‘composite’ host galaxies we have noted. We therefore expect that most of these pairs represent real physical systems, although it is conceivable that the optical counterparts in a small number represent foreground galaxies lensing the more distant submm source (Chapman et al. 2002d). However, we expect most are related galaxy pairs and these systems thus resemble the well-studied SCUBA galaxies SMM J023990136 and SMM J14011+0252, where Ivison et al. (2001b) argued that the diverse optical/IR properties of the host galaxies arises from a complex mix of obscuration and star formation. Our adoption of a large-diameter aperture for our photometric measurements means that the colours of these systems in Table 2 are less extreme than would have been measured for the reddest components in each galaxy (cf. Smail et al. 2002a).
One effect of these composite sources is to increase the fraction of distorted/pairs at the expense of faint or blank fields. This leaves essentially a 65:25:10 per cent split between distorted/multiple sources, faint/blank fields, and compact sources, which may mean that virtually all of them will be found to be distorted/multiple sources once deeper optical/IR data become available.
Another important consequence of the frequency of blue/red galaxy pairs is that a large fraction of the radio-detected 8-mJy sample is sufficiently bright to permit spectroscopy on 8-m class telescopes. Around 90 per cent of those detected in the radio have optical () or IR () host galaxies. The case for conventional spectroscopy grows stronger still when one takes in to account the spectroscopic properties of known SCUBA-selected galaxies (Ivison et al. 1998, 2000; Chapman et al. 2001a), i.e. bright, spatially extended Lyman emission lines, often with extremely large equivalent widths (Chapman et al. 2002c). It should also be stressed that once spectroscopy has been obtained for these host galaxies it is possible to confirm the relationship between the optical and submm sources by searching for strong CO emission in the mm/radio wavebands at the corresponding redshift. This provides the only reliable test of the identification of a counterpart to a SCUBA galaxy (e.g. Frayer et al. 1998, 1999).
4.3 Summary of radio and submm characteristics
| Source name | X-ray position (J2000) | Positional | Band fluxes2 | Significance | ||||
|---|---|---|---|---|---|---|---|---|
| error1 | / erg s-1 cm-2 | in 2-5 keV | ||||||
| h m s | ′′ | band | ||||||
| LE 850.4 | 10 52 04.11 | +57 25 28.1 | 3.0 | 3.7 | ||||
| LE 850.8 | 10 52 00.09 | +57 24 23.2 | 1.0 | 9.5 | ||||
| LE 850.12 | 10 52 07.37 | +57 19 04.2 | 2.3 | 3.9 | ||||
| LE 850.14 | 10 52 03.95 | +57 27 06.8 | 2.0 | 4.9 | ||||
Notes: (1) 90 per cent statisitical uncertainty on the position. Residual systematic offsets ( 1′′) between the X-ray and radio astrometric frames have not been included. (2) Count rates were converted to fluxes assuming power-law X-ray spectra with .
The most surprising revelation at radio wavelengths is that several of the most obvious radio counterparts are resolved by the 1.4′′ beam (N2 850.7, LE 850.6, and possibly LE 850.8, N2 850.13 and LE 850.16). The radio emission often appears to align with the optical/IR morphology of the counterpart, suggesting that the emission in the two wavebands is related. As noted in §3.2, five sources have more than one statistically significant radio counterpart. There is a suspicion in four further cases of low-surface-brightness radio emission (N2 850.5, LE 850.4, LE 850.9, LE 850.17): several 2–3 features covering tens of arcsec2. We created smoothed 1.4-GHz images (2′′, 2.5′′, 3′′ fwhm) to investigate this further but cannot confirm their reality with any authority.
Resolved sources point to radio-emitting regions within the galaxies on scales of 1′′, equivalent to 10 kpc at . The implication is that the submm emission from these galaxies also extends over similar scales, either as multiple bright components or as a more uniform region. In our view, the spatial extent of this emission argues strongly that the submm emission from these galaxies is powered by a widespread starburst with an intensity and spatial scale far larger than that seen in local starbursts. This conclusion is supported by the similarity of the morphology of the radio and optical/IR emission in several cases.
Perhaps less surprisingly, given the supposed diversity of the submm population (Ivison et al. 2000), three sources have spectral indices more consistent with radio-loud AGN cores or lobes than with star-forming galaxies (LE 850.3, LE 850.7 and LE 850.12). A further two (LE 850.14 and LE 850.18) are plausibly related to radio-loud AGN. We note that this acts as a warning against extrapolating from shorter wavelengths (typically 4.9 GHz) before attempting to estimate redshifts from the submm/radio spectral indices (e.g. Eales et al. 1999). We comment later on the possible prevalence of AGN in the 8-mJy sample based on radio and X-ray properties.
The discovery of resolved radio counterparts has consequences for any surveys at this resolution, or higher, that intend to address for the submm galaxy population using the radio/submm spectral index discussed in the next sub-section. Adopting upper limits set using the standard 3 recipe, where is the rms noise level, may risk underestimating the flux limit in a significant number of cases, thus overestimating the true redshift limits. To test the possible extent of this problem we have compared the fluxes of the most extended radio sources in our deep map (1.4′′ fwhm) against those measured using only B-configuration data (5′′ fwhm). Comparing sources common to both maps we find that compact sources have similar fluxes but that the largest sources — those with deconvolved angular sizes above 6′′ — have fluxes which can be as much as 30 per cent higher in the low-resolution map. Checking the radio fluxes of our brightest submm counterparts, we find no correction is necessary. Our approach, nevertheless, has been to set radio upper limits on faint or undetected sources at 5 from the deep radio map to mitigate against the possible flux bias effect. We note that the only sure method to ensure maximum sensitivity to large structures in the radio maps is by taking data on short baselines — a difficult task given the prevalence of radio-frequency interference, both man-made and solar.
Related to previous discussion of extended radio emission, if a significant fraction of submm sources are extended on scales of tens of kpc then the interplay of heating/cooling mechanisms may yield different characteristic dust temperatures, probably lowering . One of the most important addenda to the technique of redshift estimation discussed in the next section has been the realisation that there is a degeneracy between redshift and (Blain 1999): it is impossible to differentiate between a cool galaxy ( 20 k) and a warmer galaxy at ( 40 k), for example (the degeneracy is effective up to 60 k — Blain et al. 2002). Hence, if the typical dust temperatures in the submm sources are lower (Efstathiou & Rowan-Robinson 2002) or higher (Blain & Phillips 2002) than expected, this will impact on redshift estimates based on inappropriate spectral templates. The most common template SED has been that of the local ULIRG, Arp 220, which lies 1 above the mean temperature for galaxies from the local IRAS-selected survey by Dunne et al. (2000b). If one adopts an Arp 220-like template SED then the resulting redshift distribution will be biased to the high end if there is a significant population of cool submm-selected galaxies, as hinted by the discovery of luminous, cold galaxies amongst a 175-m-selected FIRBACK, SCUBA-detected sample (Chapman et al. 2002d). This bias would arise because the 850-m selection band falls longward of the dust’s spectral peak (Eales et al. 2000). We return to this point in the next section.
In conclusion, the existence of resolved radio counterparts can be taken as evidence that the submm galaxy population may be bi- or tri-modal: a combination of warm, compact ULIRG-related systems, a scattering of dust-obscured radio-loud AGN and, finally, a population of extended starbursts. A sizeable population of cool, spatially-extended starbursts (e.g. Eales et al. 2000; Chapman et al. 2002d) would require alterations to the templates used to calculate redshifts from radio/submm spectral indices, shifting considerably and possibly forcing a re-evaluation of the use of local ULIRGs as templates for studying the distant SCUBA population.
4.4 Summary of X-ray characteristics
Four potential X-ray counterparts were found, to the sources LE 850.4, LE 850.8, LE 850.12 and LE 850.14, and details are given in Table 5. N2 850.8 was detected by Chandra and is discussed by Almaini et al. (2002).
The X-ray emission near LE 850.14 is associated with a radio source to the north and is not likely to be the correct identification of the submm source, although it could be related.
All the XMM-Newton counterparts were detected in the 2–5 keV band with 3.5 significance, but they were not all detected in the other energy bands. They have fluxes of erg s-1 cm and show a deficit of soft X-ray flux which implies that their X-ray emission is absorbed by significant column densities.
| Source | Mean | Mean | Mean |
|---|---|---|---|
| name | (DCE) | (CY) | (RT) |
| LE 850.1 | |||
| LE 850.2 | |||
| LE 850.3 | |||
| LE 850.4 | |||
| LE 850.5 | |||
| LE 850.6 | |||
| LE 850.7 | |||
| LE 850.8 | |||
| LE 850.12 | |||
| LE 850.13 | |||
| LE 850.141 | |||
| LE 850.16 | |||
| LE 850.17 | |||
| LE 850.18 | |||
| LE 850.19 | |||
| LE 850.21 | |||
| N2 850.1 | |||
| N2 850.2 | |||
| N2 850.3 | |||
| N2 850.41 | |||
| N2 850.51 | |||
| N2 850.6 | |||
| N2 850.7 | |||
| N2 850.8 | |||
| N2 850.91 | |||
| N2 850.10 | |||
| N2 850.11 | |||
| N2 850.12 | |||
| N2 850.13 | |||
| N2 850.15 |
Note: (1) For sources with more than one radio counterpart, we have used the combined fluxes of all radio detections with in Table 1, consistent with our policy of generating a conservative .
4.5 Redshift constraints from the radio/submm spectral index
As we have stressed, a fair fraction of the 8-mJy sample (especially the radio-detected sources) have optical counterparts which can be realistically targeted with efficient spectrographs on 8-m class telescopes. However, there is currently no published optical spectroscopy on any of these host galaxies. While we look forward to correcting this situation, we are currently restricted in our analysis to using cruder redshift estimators – in particular the radio/submm spectral index, .
Hughes et al. (1998) and Carilli & Yun (1999, 2000, hereafter CY) were the first to point out that the ratio of radio-to-submm flux density is a strong function of redshift, at least out to . The technique has since been revised, adapted or commented upon by Blain (1999), Barger, Cowie & Richards (2000), Dunne, Clements & Eales (2000a, hereafter DCE), Rengarajan & Takeuchi (2001, hereafter RT) and Yun & Carilli (2002).
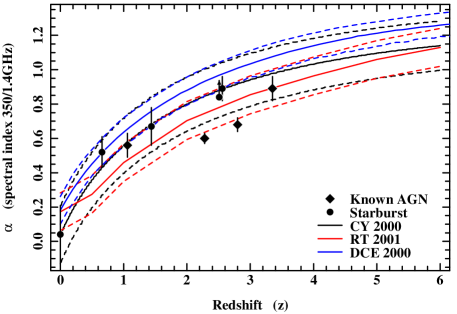
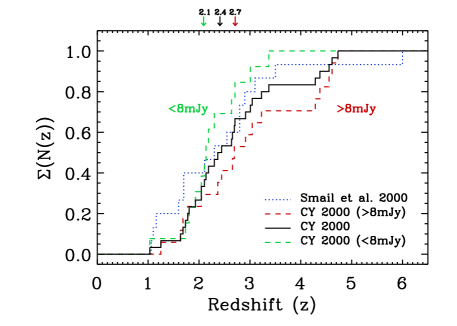
We have estimated the redshifts for the 8-mJy galaxies from their 850-m and 1.4-GHz flux densities. For radio non-detections, or sources weaker than 45 Jy (25 Jy in Lockman), we have used a conservative 5 limit at 1.4 GHz. This was intended to take into account the possibility that some sources have fallen below the formal detection threshold because they are extended relative to the beam, as discussed in §4.3: our intention is to produce a conservative redshift distribution, building on the fact that mis-identifications and AGN-related radio emission both tend to skew to lower values, as will the excision of six bright sources from our sample (§3.3).
In Fig. 8 we show the three different models for the behaviour of the 850-m/1.4-GHz spectral index as a function of redshift which were used, including the semi-analytic model by CY. The DCE and RT models are based on a complete sample of 104 empirical spectral energy distributions (SEDs) from the SCUBA Local Universe Galaxy Survey (SLUGS — Dunne et al. 2000b). The latter model takes into account free-free self-absorption and the effect of the far-IR luminosity, , on the 850-m/1.4-GHz spectral index.
The redshift ranges for the 8-mJy sources, as allowed by the rms uncertainties of the three models considered here, are summarized in Table 6. There is a significant overlap between the different redshift estimators, but individual redshifts are clearly not well constrained, especially in the light of the large scatter seen in current spectroscopically-confirmed submm samples (Fig. 9).
The cumulative redshift distribution, , for the 8-mJy sample is shown in Fig. 9 for the mean CY redshift estimator (solid black line). For clarity we have left out the corresponding distributions based on the DCE and RT models, but they display a similar overall shape and agree within the raw statistical errors. The CY model predicts that 0:23:43:34 per cent of the sources lie at , , and . The median redshifts for the 8-mJy sample based on the DCE, CY and RT models are 2.0, 2.4, and 3.2, respectively.
While the CY and DCE models predict that 30–40 per cent of submm-selected galaxies lie at , the RT estimator yields 10 percent. The most important effect on the predicted is thus revealed as the SED template. The order of progression from the lowest to the highest redshift distributions (DCE CY RT) is not surprising since the model templates derived by the three groups are based on SEDs that are progressively more luminous. This is illustrated by the fact that the CY and RT curves are in closest agreement with the measured spectral indices of spectroscopically identified starbursts in Fig. 8, although again we stress the large scatter and the potential biases in these comparisons from selection effects.
The fundamental conclusion, reached on the basis of the most conservative radio/submm constraints, i.e. using 5 limits and the DCE spectral template, is that the bright submm galaxy population lies at . Using spectral templates more representative of known submm galaxies yields (where the error includes the bootstrap estimate of the uncertaintly in the median redshift of the sample, , but is dominated by systematic errors arising from the choice of SED, which we conservatively estimate to be ). It is worth noting that if we had refined our sample more severely in §3.3, e.g. excising sources with mJy, would remain unchanged. In the next section we discuss apparent differences in the median redshift of the submm population as a function of 850-m flux density.
5 Discussion
5.1 Trends in source properties
In Fig. 10 we present the submm/radio colour-magnitude diagram (CMD) for the 8-mJy survey. Arrows indicate lower limits on the submm/radio ratio at 5 radio detection thresholds. We also plot sources from the surveys by Hughes et al. (1998), Smail et al. (2002a), Serjeant et al. (2002), and the 13 radio-selected sources in the HDF with submm counterparts brighter than 3.5 mJy detected by Chapman et al. (2002e). We have circled three sources in Fig. 10 from the Lens Survey by Smail et al. (2002a) which are known to host AGN. As one would expect, these sources have lower than the other sources in the Lens Survey. Note, however, that they do not separate out clearly in the diagram. This indicates that, except for very strong AGN, the submm/radio colour-magnitude diagram is not a powerful discriminant between AGN and starbursts.
The sensitivity limits of the radio observations used in Fig. 10 define a selection boundary in the upper-left region of the diagram, but there also appears to be a deficit of bright submm sources in the lower-right region — those with a low submm/radio flux ratio. Any such sources should have been picked up by our survey since they are bright in the submm as well as the radio. To quantify this trend we have calculated bootstrapped median values of the 1.4-/850-m spectral index for two bins, and mJy: and — confirming the presence of a trend in the data at the 2 level. Errors were estimated from 100 random samples of the distribution in each bin. The median 850-m flux densities in these bins are and mJy.
A possible explanation for the trend is a bias in our radio flux measurements due to resolving out emission from the larger sources. If the more luminous submm sources have larger angular sizes then there may be a weak trend in our measurements which would make these appear to have higher submm/radio spectral indices and hence higher inferred redshifts. However, we estimate (based on the work described in §4.3) that at most this would result in a 20 per cent reduction in the radio flux and hence a modest change in the spectral indices ().
What does this trend of with tell us? Due to the balance between cosmic dimming and a steep, negative correction, submm flux density is expected to be almost entirely independent of redshift for . The submm flux thus provides us with a gauge of . The trend we see therefore reflects differing behaviour in the intrinsically low- and high-luminosity SCUBA populations. As discussed earlier, the 1.4-GHz/850-m spectral index is sensitive to both redshift and the form of the dust SED of the galaxy, parameterised in terms of and dust emissivity index, . There are thus several possible causes of this trend: 1) 1.4-GHz/850-m spectral indices mostly reflect differences in the form of the dust SEDs, with a decreasing at higher luminosities or equivalently a decrease in ; 2) a bias in submm surveys in favour of colder objects at a given and ; 3) 1.4-GHz/850-m spectral indices are tracking the source redshifts and we are seeing a tendency for the most luminous submm sources to lie at higher redshifts.
Taking the first possible cause, we note that locally there appears to be little evidence for systematic variations in the properties of obscured galaxies: the scatter of 0.2 dex in the observed radio/far-IR correlation (Helou et al. 1985) can be accounted for by the dispersion in and . This is supported by results for the SLUGS sample of bright IRAS galaxies (DCE), where the radio/far-IR correlation was found to be independent of and . Although it has been pointed out (CY; DCE) that in the rest frame there is a strong dependence of on , for sources at the effect is likely to be small since submm observations probe the far-IR regime. Furthermore, any effect of on the spectral index may be compensated by a decrease in radio emission due to self-absorption in luminous sources. The main concern about this findings is that the strong constraints really only apply to dusty galaxies with FIR luminosities of = 9–11 L⊙, lower than those expected for the galaxies in our sample. Therefore there remains the possibility that the most luminous, obscured galaxies have a strong luminosity–temperature relation which is driving the trend in Fig. 10.
If, instead, we ascribe the trend to redshift, we have a situation where the apparently brightest sources are also the most distant. This rather unusual situation would reflect very strong luminosity evolution in the submm-selected galaxy population, with a model where high-redshift sources are typically more luminous than local sources. This trend may also be reflected in Fig. 9 where the cumulative redshift distribution of 8-mJy sources is plotted in red (assuming the CY model). The sources which we expect to be more luminous based on our tentative interpretation of Fig. 10 are seen to have a distribution skewed towards higher redshifts than the overall sample: for 8 mJy, cf. for all sources and for 8 mJy (close to the distribution found for the faint Cluster Lens Survey — Smail et al. 2000, 2002a). Similar behaviour was predicted by Chapman et al. (2002e) who reproduced the submm/radio CMD using a mock population of 50-k SEDs and adopting a luminosity function , with a power-law evolution function out to and for .
To distinguish between these scenarios we look for other supporting evidence in the properties of the host galaxies to the submm sources in our survey. We plot in Figs 11, 12 and 13, the variation in the key observables for the submm population: -band magnitude, colour and -band-to-1.4-GHz flux ratio. For each of these figures we compare the distributions of submm galaxies with 850-m fluxes above and below 8 mJy.
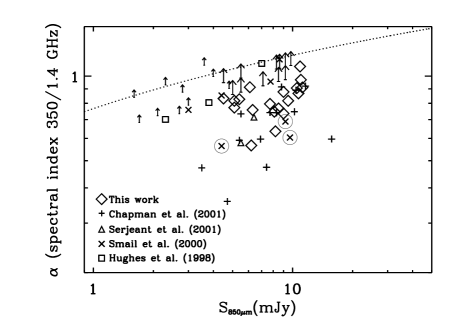
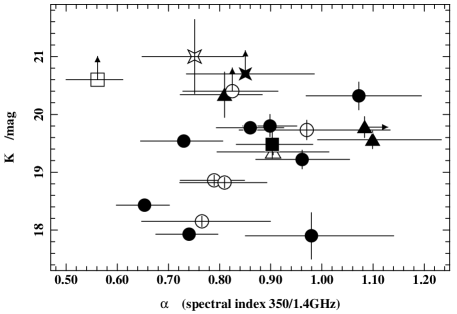
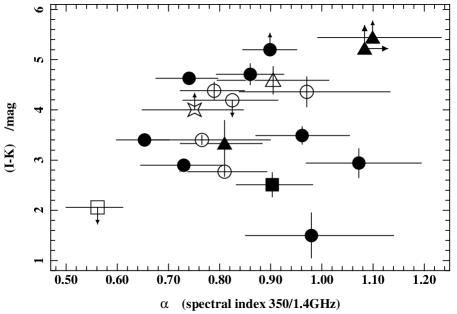
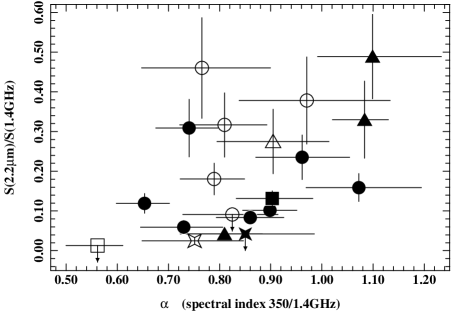
We start by examining the distribution of sources in Fig. 11. There appears to be a weak correlation between magnitude and spectral index, with the fainter counterparts typically having higher spectral indices. This correlation arises primarily because of the absence of bright -band counterparts () for submm sources with high spectral indices, . This deficit contrasts with the distribution seen for sources with where over half of the -band counterparts are brighter than . Looking next at the distribution of the sources divided on the basis of morphology or submm flux density, there is no strong differentiation between the classes (apart from the trivial conclusion that faint/blank-field sources have faint -band magnitudes). The main conclusion from this figure is that submm sources with higher spectral indices are generally fainter at , suggesting that these galaxies are either more distant (in support of our earlier hypothesis) or more obscured.
Next we look at the variation in colour with spectral index in Fig. 12. For simple stellar populations, increases monotonically with redshift, providing a crude redshift estimate (Lilly et al. 1999). The first thing to note is that the submm counterparts are generally redder than the typically seen for the field population at , suggesting again that they are either more distant or more obscured than galaxies in the field. However, beyond that, the impression gained from Fig. 12 is that there is no strong correlation between and , either for the whole sample, or when divided into submm flux bins. We suggest that the mix of dust and young and old stellar populations expected in these systems makes the interpretation of their optical-IR colours complex and highly model-dependent (e.g. Ivison et al. 2001). This is illustrated by the broad distribution shown by the dominant population of distorted/multiple host galaxies. These composite systems, are by their nature, unlikely to be well-described by a simple stellar population model. However, two of the other morphological classes do warrant mention: two of the bluest sources have very compact morphologies, suggestive of the presence of an AGN; the two faint galaxies which, from the radio and submm observations are expected to be at the highest redshifts () are also the two reddest galaxies in the sample, . We conclude that the simplest interpretation of the colours of the submm host galaxies points to a complex and diverse population.
Finally, we investigate the variation in IR-to-radio fluxes as a function of spectral index, Fig. 13. The 2.2-m/1.4-GHz flux density ratio is relatively insensitive to source redshift since the spectral slope in both wavebands is very similar. Instead, this ratio should provide a good measure of the relative flux in the optical and far-IR, and hence a redshift-independent measure of the obscuration (Soifer, Houck & Neugebauer 1987). In Fig. 13 we find that submm sources with distorted or multi-component morphologies cover a broad region in the centre of the figure, with a hint that those with brighter submm fluxes typically have lower values of 2.2-m/1.4-GHz. This suggests that the more luminous systems are more obscured than the fainter sources. Looking at the remainder of the population, those sources that are faint or blank in span a similar range in 2.2-m/1.4-GHz flux ratio to the morphologically complex sources but typically have higher , indicating that they are probably more distant (but similarly obscured) analogues of the multi-component sources. The lack of large variations in the distribution of sources on this plane (with either -band magnitude or submm flux) suggests that obscuration is not responsible for the trend seen in Fig. 11 and that instead this must reflect redshift differences.
In summary, due to the small number of sources and the large scatter in the population, one cannot unambigously say that Figs 11, 12 and 13 confirm the luminosity evolution scenario suggested above. However, looking at the optical and IR properties of the submm galaxies we do find some differences which are consistent with high-spectral-index sources lying at higher redshifts, as required by the luminosity evolution model.
5.2 Comparison with galaxy-formation models
How do these results compare to current theoretical expectations? Several groups working with semi-analytic galaxy-formation models are attempting to include the effects of dust obscuration and hence predict the properties of galaxies selected in SCUBA surveys. One self-consistent and well-developed model is that discussed by Lacey et al. (2002). This model incorporates the grasil dust code of Silva et al. (1998) and Granato et al. (2000) in the galaxy-formation framework of Cole et al. (2000). The original Cole et al. model had difficulty producing enough luminous submm sources (as discussed in §1); however, by tuning it so that it can fit the submm counts, it has provided useful insights into the characteristics necessary to successfully reproduce the SCUBA population. The main changes made to the model to allow it to fit the counts of SCUBA sources are: (i) increase the amount of gas in mergers at high redshifts (Blain et al. 1999a) by adopting a longer timescale for star formation in disks at high redshifts than in the Cole et al. model and (ii) adopt a top-heavy IMF for the starbursting phase (Blain et al. 1999c). With these two changes, the model can reproduce the observed number counts at 850 m from 0.5–10 mJy as well as the integrated flux in the background seen by COBE (Lacey et al. 2002).
The model predicts that dusty starbursts undergoing major mergers dominate the submm counts at mJy. In particular, for a sample limited at an 850-m flux density of 8 mJy the model predicts a median redshift of with a width of (Lacey et al. 2002). This is in reasonable agreement with the results we find in §4.5, providing some support for the model. However, there is little change in the median redshift of the population with submm flux between 0.1 and 8 mJy, in contrast to the results presented in §4.5 and Fig. 9.
An advantage of the semi-analytic models is that they provide a framework to interpret the relationship between different classes of galaxies at high and low redshifts. For example, in this model the SCUBA galaxies are expected to evolve into typically massive galaxies lying in the highest density regions seen in the local Universe, i.e. luminous ellipticals in rich clusters. In terms of the high-redshift populations, we are most interested in the relationship between the SCUBA and Lyman-break (LBG) populations. Here, Lacey et al. (2002) suggest that these represent a time sequence — both classes arise from merger-induced starbursts: SCUBA sources represent the earliest dust-obscured phase, 50 Myr, and the LBGs represent more evolved post-burst systems. There are also small differences in the halo and stellar masses of the typical members of the two populations, with SCUBA galaxies on average being 3– more massive and residing in dark matter halos with masses of 1–2 M⊙ (consistent with dynamical estimates from CO observations, Frayer et al. 1998, 1999).
5.3 Comparison to radio-pre-selected SCUBA samples
Barger et al. (2000) and Chapman et al. (2001b) discuss a technique designed to improve the detection rate of submm galaxies: pre-selection of optically faint radio sources (OFRS, 40 Jy, within 2′′), which exploits SCUBA’s time-saving photometry mode. Chapman et al. (2001b) argue that their sample is representative of the 850-m population brighter than 5 mJy with , and that the redshift distribution (), arrived at via the radio/submm technique employed in §4.3, is inconsistent with the existence of a high-redshift () population of primeval galaxies contributing substantially to the submm counts.
This conclusion is, of course, heavily dependent on the fraction of the blank-field submm counts that are recovered by the OFRS selection technique. If the fraction is low, then conclusions based on OFRS samples are not necessarily relevant to the entire submm-selected galaxy population. Chapman et al. (2001b) estimate that around 75 per cent of bright submm sources are typically recovered through radio pre-selection (cf. Chapman et al. 2002f), based on a comparison of their counts with those in blank-field surveys, although there is considerable uncertainty in this fraction.
The 8-mJy survey together with the radio imaging presented here give us the ideal tool to deduce the typical recovery fraction: measurements of the same fields at submm and radio wavelengths. In what follows, we search within 8′′ of the 8-mJy sample submm positions for radio sources peaking above 4 with integrated fluxes above 30 Jy (15 Jy for Lockman), then check for optical counterparts, or . A submm source without a radio counterpart (or a submm source with an optical counterpart within 2′′ of its radio counterpart) does not class as an OFRS.
Looking at the 30 sources in the refined 8-mJy sample, we find that four would have been selected for follow-up photometry observations using the strict criteria laid down for the Chapman et al. (2001b) survey, i.e. a recovery fraction of only 13 per cent. If the -band criterion is relaxed to then this fraction doubles, but the technique still recovers half of the radio-detected sources in our submm-selected sample.
This suggests that the redshift distribution deduced via OFRS is biased to low redshifts () by to the radio selection function, but also biased to high redshifts by the ‘optically faint’ criterion, the latter accounting for the loss of half of the submm sources. The effects of the OFRS selection process are clearly far from simple. The conclusion of Chapman et al. — that a high-redshift population of primeval galaxies cannot contribute substantially to the submm counts — is not supported by our radio/submm-based which suggests that a third of submm-selected galaxies lie at .
5.4 On the fraction of AGN-dominated SCUBA galaxies
In the Smail et al. (2002a) sample of 15 submm galaxies, selected blind through lensing clusters, there are at least four unambiguous examples of AGN: SMM J023990136 (L1/L2 — Ivison et al. 1998), SMM J023990134 (L3 — Soucail et al. 1999), SMM J224710206 (P4 — Barger et al. 1999b), SMM J04431+0210 (the ERO, N4 — Smail et al. 1999; Frayer et al. 2002, in prep), as well with a fifth example where the radio emission is bright enough to raise serious doubts about a pure starburst nature, SMM J14009+0252 (the ERO J5 — Ivison et al. 2000, 2001). The AGN fraction, even without the ability to probe Compton-thick AGN, is at the 30 per cent level.
Three submm sources (LE 850.4, LE 850.8 and LE 850.12) have 2–5 keV X-ray counterparts detected with XMM-Newton; another, N2 850.8, was detected by Chandra. All show a deficit of soft X-ray flux which implies that their X-ray emission is absorbed by significant column densities. Assuming the sources are at , and making no correction to the 2–5-keV fluxes for absorption, all of them have 2–10-keV luminosities in excess of erg s-1. The X-ray emission almost certainly comes from obscured AGN, because such luminosities exceed by more than a factor of 10 that of the most X-ray luminous starburst currently known (NGC 3256; Moran, Lehnert & Helfand 1999), and because the lack of soft X-ray flux rules out a substantial contribution from superwinds, which are ubiquitous in luminous starburst galaxies (Read & Ponman 1998).
Assuming that about 5 per cent of an AGN’s bolometric luminosity is emitted between 2 and 10 keV (Elvis et al. 1994), the weakness of the observed X-ray emission implies that even though AGN are present, they are not capable of powering the far-IR emission unless they are Compton thick, i.e. unless their X-ray emission is attenuated by column densities cm-2. If they have column densities cm-2 then even at their X-ray emission would imply AGN bolometric luminosities that fall short of their far-IR luminosities. Furthermore, the radio-loud AGN population includes a much larger proportion of luminous X-ray sources than the radio-quiet population (Ciliegi et al. 1995); the presence of radio-loud AGN amongst the submm-selected galaxies therefore indicates that they may contain relatively powerful AGN rather than low-luminosity Seyfert galaxies.
We note that half of our sources are either resolved in the radio or have more than one counterpart. This immediately suggests that the emission from these sources is due to starbursts on kpc scales rather than heating by AGN. We also note that even the most obvious AGN in the Smail et al. (2002a) sample is gas rich, with the gas playing a dynamically important role (Frayer et al. 1998).
However, we have determined that at least three galaxies from the 8-mJy sample, possibly as many as five, have radio emission consistent with radio-loud AGN. An analogy with radio surveys of X-ray-selected samples, where less than 10 per cent of AGN are found to be radio loud (e.g. Ciliegi et al. 1995), implies that a very large fraction of the submm-selected galaxies here may contain AGN.
If the AGN fraction of our submm-selected sample can feasibly be approaching unity, contamination by AGN-heated dust is clearly an issue that must be addressed since it will impact directly on our view of cosmic star-formation history. However, the ubiquity of SMBH in the most massive local galaxies, and the scaling of their mass with that of their host bulge, indicates that the formation of a black hole — which will result in AGN activity — may be an important signature of the formation phase of the most massive galaxies at high redshifts. Indeed, the important issue is not the presence of an AGN in a SCUBA galaxy, but its contribution to the bolometric luminosity of the system. In this regard, our XMM-Newton results suggest that even when an AGN is present, it rarely dominates the bolometric luminosity of the galaxy (Frayer et al. 1998; Alexander et al. 2002). This is consistent with what is known about the energetics of ULIRG-like events in the local Universe, where again emission from the AGN rarely dominate.
In all the cases for which an AGN component has been detected in X-rays, the relative weakness of the X-ray emission below 2 keV implies significant X-ray absorption. The association between X-ray-absorbed AGN and submm sources is also found when following up X-ray sources in the submm: Page et al. (2001) found that 50 per cent of luminous, X-ray-selected, X-ray-absorbed AGN are also submm sources. This is particularly relevant because some models for the formation of SMBH and their host galaxies (e.g. Fabian 1999) predict that X-ray-absorbed AGN will be a generic feature of young spheroidal galaxies. However, the predominance of X-ray absorption amongst the current small sample of X-ray-detected submm sources is completely compatible with what is found in the local Universe (80 per cent absorbed AGN; Maiolino & Rieke 1995). Therefore, at present, X-ray absorption expected during spheroid formation cannot be distinguished from the X-ray absorption expected from AGN unification schemes.
We conclude, following Ivison et al. (1998, 2000), that the fraction of SCUBA galaxies hosting AGN may be high; however, current evidence suggests that AGN rarely dominate the bolometric emission. We are therefore confident that the bolometric luminosities of the SCUBA population primarily reflect dust-obscured massive star formation.
5.5 Star-formation history inferred from submm and radio observations
Numerous attempts have been made to derive the cosmic star-formation history. These efforts were originally restricted to deep UV/optical surveys (e.g. Lilly et al. 1996; Connolly et al. 1997; Madau et al. 1996; Cowie, Songaila & Barger 1999; Steidel et al. 1999) and relied on several assumptions: that the IMF is universal; that the emitted UV light is proportional to the SFR; that extinction by dust is neglible or, in later attempts, can be corrected for.
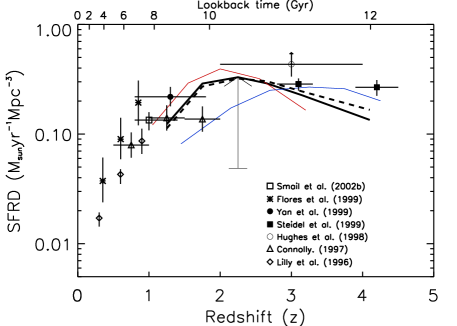
The existence of a heavily obscured galaxy population is clear from the energy in the submm extragalactic background, which is comparable to the background at UV and optical wavelengths. Locally the ratio between the amount of light emitted by galaxies in the far-IR and optical wavebands is significantly smaller than that measured from the background, suggesting an early period of dust-enshrouded star formation (cf. Adelberger & Steidel 2000). With the data presented here, we can begin to quantify this star formation.
Given the large number of sources in our sample we can afford to divide the sample into redshift bins and determine the star-formation rate (SFR) in each co-moving volume element.
Next, we need to estimate the SFR for each source. The radio and far-IR luminosities of a starburst galaxy provide two independent estimates of the SFR. The power emitted at radio wavelengths — a tiny fraction, 10-4, of the bolometric luminosity — is mainly non-thermal synchrotron radiation emitted by relativistic electrons accelerated by Type ii and Ia supernova remnants. and the SFR are thus linked via massive stars, M⊙, and consequently probes very recent star formation (e.g. Condon 1992; Yun & Carilli 2001). constitutes most of the bolometric luminosity for dust-enshrouded starbursts: almost all the radiation from young OB stars is absorbed by dust and re-radiated, giving a measure of star formation that is largely invisible at optical/UV wavelengths.
Combining deep radio and submm observations is therefore a very powerful way of tracing the co-moving star-formation rate density (SFRD) as a function of redshift: with a determination of , it allows for two independent estimates of the SFRD, sensitive to star formation at practically all redshifts. However, since we have used our submm and radio data to derive , the radio- and submm-based SFR measurements are not independent.
In the following, rest-frame 1.4-GHz radio luminosities, , were computed assuming a spectral index of , i.e. W Hz-1, where is the luminosity distance and is the measured flux density at 1.4 GHz. The SFR was then calculated using the calibration by Yun, Reddy & Condon (2001): W Hz-1. The conversion factor corresponds to an initial mass function for .
For our submm-based SFRs we have adopted an optically thin, single-temperature ( = 45 k) modified blackbody with emissivity index, = 1.2, i.e. , where is in GHz. Using this SED template we compute for each source by integrating the rest-frame spectral luminosity over the wavelength range 40–500 m. SFRs were then calculated from M⊙ yr-1, after Kennicutt (1998) who estimates an uncertainty of 20 per cent in the calibration.
For each source, we computed a radio-based SFR using the CY redshift estimator. Submm-based SFRs were found using all three redshift estimators (CY, DCE, and RT). The results are outlined in Table 6.
SFRs range from a few hundred to more than a thousand M⊙ yr-1. Note that the derived SFRs are sensitive to the adopted SED template, in particular to . An increase of 10 per cent in increases the SFR by one third.
| Source | SFR1.4GHz | SFR850μm | SFR850μm | SFR850μm |
|---|---|---|---|---|
| name | (CY) | (DCE) | (CY) | (RT) |
| LE 850.1 | 1700 | 1600 | 1600 | 1600 |
| LE 850.2 | 2200 | 1700 | 1700 | 1700 |
| LE 850.3 | 1100 | 1200 | 1200 | 1200 |
| LE 850.4 | 1600 | 1300 | 1300 | 1300 |
| LE 850.5 | 1700 | 1300 | 1300 | 1300 |
| LE 850.6 | 1900 | 1700 | 1700 | 1700 |
| LE 850.7 | 1200 | 1200 | 1200 | 1300 |
| LE 850.8 | 700 | 800 | 800 | 800 |
| LE 850.12 | 700 | 700 | 800 | 900 |
| LE 850.13 | 2000 | 1500 | 1500 | 1500 |
| LE 850.14 | 1300 | 1400 | 1500 | 1500 |
| LE 850.16 | 1000 | 900 | 900 | 900 |
| LE 850.17 | 1900 | 1400 | 1400 | 1400 |
| LE 850.18 | 600 | 700 | 700 | 700 |
| LE 850.19 | 1000 | 900 | 800 | 800 |
| LE 850.21 | 800 | 700 | 700 | 700 |
| N2 850.1 | 1800 | 1700 | 1700 | 1700 |
| N2 850.2 | 1700 | 1600 | 1700 | 1600 |
| N2 850.3 | 1500 | 1300 | 1300 | 1300 |
| N2 850.4 | 1000 | 900 | 1100 | 1200 |
| N2 850.5 | 1200 | 1200 | 1300 | 1300 |
| N2 850.6 | 1600 | 1400 | 1400 | 1400 |
| N2 850.7 | 1200 | 1300 | 1300 | 1400 |
| N2 850.8 | 700 | 700 | 800 | 800 |
| N2 850.9 | 1400 | 1400 | 1400 | 1400 |
| N2 850.10 | 800 | 800 | 800 | 800 |
| N2 850.11 | 1200 | 1100 | 1100 | 1100 |
| N2 850.12 | 800 | 800 | 900 | 800 |
| N2 850.13 | 800 | 900 | 900 | 1000 |
| N2 850.15 | 800 | 800 | 800 | 800 |
The SFRDs computed in this way should be taken as lower limits since we are dealing with a survey that skims the top 10 per cent of the submm counts, leaving room for a substantial contribution from less luminous submm sources. To account for this, a correction has been applied to the SFRDs. Assuming that the differental number counts of submm sources are well described by (Barger et al. 1999a), we find a correction factor of 12 down to mJy.
In Fig. 14 we present the co-moving SFRD as a function of redshift based on the 8-mJy survey. Blue and red lines correspond to submm-based SFR estimates using the most extreme redshift estimators (DCE and RT) whilst the solid and dashed lines use the CY redshift estimator: submm- and radio-based estimates respectively. For comparison we have plotted the SFRD as estimated from Jy radio observations of a sample of EROs in the redshift range 0.8–1.4 (Smail et al. 2002b) and several other optical-, IR- and radio-based estimates. These are consistent with our measurement of the cosmic SFRD and point to a picture in which significant star formation takes place beyond . We find star-formation activity in the = 1–4 range at a similar level to extinction-corrected estimates for LBGs (Steidel et al. 1999).
6 Concluding remarks
-
1.
We describe deep 1.4-GHz imaging of the 8-mJy survey regions in ELAIS N2 and Lockman East. These detect 60 per cent of the 30 submm-selected galaxies in our sample, enabling us to constrain the positions of these sources to better than 1′′ and thereby identify host galaxies in other wavebands.
-
2.
We present new optical and IR imaging and, based on the new positional information from the radio map, we find robust counterparts to 90 per cent of the radio-detected galaxies. Identifications based on colour are made for several more.
-
3.
At least 60 per cent of the radio-detected optical/IR host galaxies display highly-structured or distorted morphologies, suggestive of merging or interacting systems.
-
4.
Almost one half of the optical/IR host galaxies are found to contain very or extremely red components. In addition, as many as ten of the optical/IR counterparts are composite systems comprising blue and red components separated by a few arcsec (tens of kpc at the relevant redshifts). The strong internal colour gradients within these systems may be indicative of patchy dust obscuration.
-
5.
Contrary to popular belief, virtually all of the host galaxies to the radio-detected population are sufficiently bright to justify spectroscopic observations with 8-m telescopes. We caution that redshifts require confirmation via CO detections before optical/IR host galaxies can be considered robust associations.
-
6.
XMM-Newton X-ray data for Lockman are presented, as well as Chandra data for ELAIS N2. We detect four submm-selected galaxies, only one of which would have been identified as an AGN via its radio characteristics.
-
7.
The diversity of the submm galaxy population is highlighted. We identify a beguiling mixture of sources, including eight EROs (one associated with the lobe of a radio galaxy) and two sources with flat-spectrum radio emission.
-
8.
We find that less than a quarter of the sample would have been recovered by targeting optically faint radio sources, underlining the selective nature of such surveys.
-
9.
We exploit the radio/far-IR correlation using our well-matched radio and submm data, finding a conservative lower limit of 2.0 for the median redshift of bright submm-selected galaxies, or 2.4 using spectral templates more representative of known submm galaxies.
-
10.
We find tentative evidence for luminosity evolution, with the brightest sources ( 8 mJy) tending to be the most distant.
-
11.
Employing our estimated redshift distribution, we find that submm galaxies with mJy play an important role in cosmic star-formation history. They are responsible for a higher star-formation-rate density at 1–4 than the entire galactic zoo manages at 0, and for a similar density as the 3–4 LBG population when extrapolated to mJy.
Acknowledgements
We would like to thank Frazer Owen, Chris Carilli and Bob Becker for their patient and invaluable help during the reduction of the data presented here and the VLA data analysts for their ceaseless endevours. We thank Graham Smith for providing time to gather some of the observations presented here. We acknowledge useful discussions with Carlton Baugh, Carlos Frenk and Cedric Lacey. We are also grateful for data received from the WHT service programme. JSD, CJW, SES, NDR and MJF acknowledge the UK PPARC for funding. DGG acknowledges funding from the Leverhulme Trust. IRS acknowledges support from Royal Society and Leverhulme Fellowships. TRG acknowledges support from the Danish Research Council and from the European Union RTN network, POE.
References
- [1] Adelberger K.L., Steidel C.C., 2000, ApJ, 544, 218
- [2] Alexander D.M., Bauer F.E., Brandt W.N., Hornschemeier A.E., Vignali C., Garmire G.P., Schneider D.P., 2002, ApJ, in preparation
- [3] Almaini O. et al., 2002, MNRAS, in press (astro-ph/0108400)
- [4] Archibald E.N., Dunlop J.S., Hughes D.H., Rawlings S., Eales S.A., Ivison R.J., 2001, MNRAS, 323, 417
- [5] Archibald E.N., Dunlop J.S., Friaca A., Jimenez R., McLure R.J., 2002, MNRAS, in press (astro-ph/0108122)
- [6] Aretxaga I., Hughes D.H., Chapin E.L., Gaztañaga E., Dunlop J.S., 2002, MNRAS, submitted (astro-ph/0205313)
- [7] Assafin M. et al., 2001, ApJ, 552, 380
- [8] Barger A.J., Cowie L.L., Sanders D.B., 1999a, ApJ, 518, L5
- [9] Barger A.J., Cowie L.L., Smail I., Ivison R.J., Blain A.W., Kneib J.-P., 1999b, AJ, 117, 2656
- [10] Barger A.J., Cowie L.L., Richards E.A., 2000, AJ, 119, 2092
- [11] Baugh C.M., Benson A.J., Cole S., Frenk C.S., Lacey C.G., 2001, in ‘QSO hosts and their environments’, Granada, in press
- [12] Bertoldi F. et al., 2000, A&A, 360, 92
- [13] Blain A.W., 1999, MNRAS, 309, 955
- [14] Blain A.W., Jameson A., Smail I., Longair M.S., Kneib J.-P., Ivison R.J., Kneib J.-P., 1999a, MNRAS, 309, 715
- [15] Blain A.W., Kneib J.-P., Ivison R.J., Smail I., 1999b, ApJ, 512, L87
- [16] Blain A.W., Smail I., Ivison R.J., Kneib J.-P., 1999c, MNRAS, 302, 632
- [17] Blain A.W., Phillips T.G., 2002, MNRAS, 333, 222
- [18] Blain A.W., Smail I., Ivison R.J., Kneib J.-P., Frayer D.T., 2002, Physics Reports, in press (astro-ph/0202228)
- [19] Borys C., Chapman S., Halpern M., Scott D., 2002, MNRAS, 330, L63
- [20] Carilli C.L., Yun M.S., 1999, ApJ, 513, L13
- [21] Carilli C.L., Yun M.S., 2000, ApJ, 530, 618 [CY]
- [22] Chapman S.C. et al., 2000, MNRAS, 319, 318
- [23] Chapman S.C., Lewis, G.F., Scott D., Richards E., Borys C., Steidel C.C., Adelberger K.L., Shapley A.E., 2001a, ApJ, 548, L17
- [24] Chapman S.C., Richards E.A., Lewis G.F., Wilson G., Barger A.J., 2001b, ApJ, 548, L147
- [25] Chapman S.C., Scott D., Borys C., Fahlman G.G., 2002a, MNRAS, 330, 92
- [26] Chapman S.C., Smail I., Ivison R.J., Blain A.W., 2002b, ApJ, submitted (astro-ph/0204086)
- [27] Chapman S.C., Blain A.W., Smail I., Ivison R.J., 2002c, Nature, submitted
- [28] Chapman S.C., Smail I., Ivison R.J., Helou G., Dale D.A., Lagache G., 2002d, ApJ, 573, 66
- [29] Chapman S.C., Lewis G.F., Scott D., Borys C., Richards E.A., 2002e, ApJ, in press (astro-ph/0111157)
- [30] Chapman S.C. et al., 2002f, ApJ, submitted
- [31] Ciliegi P., Elvis M., Wilkes B.J., Boyle B.J., McMahon R.G., Maccacaro T., 1995, MNRAS, 277, 1463
- [32] Ciliegi P. et al., 1999, MNRAS, 302, 222
- [33] Clark B.G., 1980, A&A, 89, 377
- [34] Cole S.M., Lacey C.G., Baugh C.M., Frenk C.S., 2000, MNRAS, 319, 168
- [35] Condon J.J., 1992, ARAA, 30, 575
- [36] Condon J.J., Cotton W.D., Greisen E.W., Yin Q.F., Perley R.A., Taylor G.B., Broderick J.J., 1998, AJ, 115, 1693
- [37] Connolly A.J., Szalay A.S., Dickinson M., Subbarao M.U., Brunner R.J., 1997, ApJ, 486, L11
- [38] Cowie L.L., Songaila A., Barger A.J., 1999, AJ, 118, 603
- [39] Cowie L.L., Barger A.J., Kneib J.-P., 2002, AJ, 123, 2197
- [40] Dannerbauer H., Lehnert M., Lutz D., Tacconi L., Bertoldi F., Carilli C., Genzel R., Menten K., 2002, ApJ, submitted (astro-ph/0201104)
- [41] de Jong T., Klein U., Wielebinski R., Wunderlich E.W., 1985, A&A, 147, L6
- [42] de Ruiter H.R. et al., 1997, A&A, 319, 7
- [43] Dey A., Graham J.R., Ivison R.J., Smail I., Wright G.S., Liu M., 1999, ApJ, 519, 610
- [44] Dickey J.M., Salpeter E.E., 1984, ApJ, 284, 461
- [45] Downes A.J.B., Peacock J.A., Savage A., Carrie D.R., 1986, MNRAS, 218, 31
- [46] Downes D. et al., 1999, A&A, 347, 809
- [47] Dunlop J.S. et al. 2002, MNRAS, submitted (astro-ph/0205480)
- [48] Dunne L., Clements D.L., Eales S.A., 2000a, MNRAS, 319, 813 [DCE]
- [49] Dunne L., Eales S.A., Edmunds M.G., Ivison R.J., Alexander P., Clements, D., 2000b, MNRAS, 315, 115
- [50] Eales S.A, Lilly S.J., Gear W.K., Dunne L., Bond J.R., Hammer F., Le Fèvre O., Crampton D., 1999, ApJ, 515, 518
- [51] Eales S., Lilly S., Webb T., Dunne L., Gear W., Clements, D., Yun M., 2000, AJ, 120, 2244
- [52] Eales S.A, Ivison R.J., Carilli C., Bertoldi F., Dunne L., 2002, MNRAS, in preparation
- [53] Efstathiou A., Rowan-Robinson M., 2002, MNRAS, submitted
- [54] Elvis M. et al., 1994, ApJS, 95, 1
- [55] Fabian A.C., 1999, MNRAS, 308, L39
- [56] Fixsen D.J., Dwek E., Mather J.C., Bennett C.L., Shafer R.A., 1998, ApJ, 508, 123
- [57] Flores H. et al., 1999, ApJ, 517, 148
- [58] Fox M.J. et al., 2002, MNRAS, 331, 839 [F02]
- [59] Frayer D.T., Ivison R.J., Scoville N.Z., Yun M., Evans A.S., Smail I., Blain A.W., Kneib J.-P., 1998, ApJ, 506, L7
- [60] Frayer D.T. et al., 1999, ApJ, 514, L13
- [61] Frayer D.T., Smail I., Ivison R.J., Scoville N.Z., 2000, AJ, 120, 1668
- [62] Frayer D.T. et al., 2002, ApJ, in preparation
- [63] Fruchter A., Hook R.N., 1997, in Applications of Digital Image Processing, ed Tescher A.G., Proc. SPIE Vol. 3164, p. 120
- [64] Gear W.K., Lilly S.J., Stevens J.A., Clements D.L., Webb T.M., Eales S.A., Dunne L., 2000, MNRAS, 316, L51
- [65] Georgakakis A., Mobasher B., Cram L., Hopkins A., Lidman C., Rowan-Robinson M., 1999, MNRAS, 306, 708
- [66] González-Solares E. et al., 2002, MNRAS, in preparation
- [67] Granato G.L., Lacey C.G., Silva L., Bressan A., Baugh C.M., Cole S., Frenk C.S., 2000, ApJ, 542, 710
- [68] Hasinger G. et al., 2001, A&A, 365, L45
- [69] Hauser M.G. et al., 1998, ApJ, 508, 25
- [70] Helou G., Soifer B.T., Rowan-Robinson M., 1985, ApJ, 298, L7
- [71] Högbom J.A., 1974, A&AS, 15, 417
- [72] Holland W.S. et al., 1999, MNRAS, 303, 659
- [73] Hughes D.H. et al., 1998, Nature, 394, 241
- [74] Hughes D.H. et al., 2002, MNRAS, submitted (astro-ph/0111547)
- [75] Ivison R.J., Smail I., Le Borgne J.-F., Blain A.W., Kneib J.-P., Bézecourt J., Kerr T.H., Davies J.K., 1998, MNRAS, 298, 583
- [76] Ivison R., Smail I., Blain A., Kneib J.-P., Frayer D., 1999, ApSS, 266, 285
- [77] Ivison R.J., Dunlop J.S., Smail I., Dey A., Graham J.R., Liu M.C., 2000a, ApJ, 542, 271
- [78] Ivison R.J., Smail I., Barger A., Kneib J.-P., Blain A.W., Owen F.N., Kerr T.H., Cowie L.L., 2000b, MNRAS, 315, 209
- [79] Ivison R.J., Smail I., Frayer D.T., Kneib J.-P., Blain A.W., 2001, ApJ, 561, L45
- [80] Jenness T., 2000, JCMT Technical Report 84, http://www.jach.hawaii.edu/JACdocs/JCMT/tr/001/84/tr0084.html
- [81] Kauffmann G., Charlot S., 1998, MNRAS, 294, 705
- [82] Kennicutt R.C., 1998, ApJ, 498, 541
- [83] Lacey C. et al., 2002, MNRAS, in preparation
- [84] Lawrence A., 2001, MNRAS, 323, L147
- [85] Ledlow M.J., Smail I., Owen F.N., Keel W.C., Ivison R.J., Morrison G.E., 2002, ApJ, submitted
- [86] Lumb D.H., Warwick R.S., Page M., De Luca A., 2002, A&A, 389, L93
- [87] Lutz, D. et al. 2001, A&A, 378, L70
- [88] Manners J.C. et al., 2002, MNRAS, submitted
- [89] Monet D.G. et al., 1998, USNO-A2.0, United States Naval Observatory, Washington
- [90] Madau P., Ferguson H.C., Dickinson M.E., Giavalisco M., Steidel C.C., Fruchter A., 1996, MNRAS, 283, 1388
- [91] Maiolino R., Rieke G.H., 1995, ApJ, 454, 95
- [92] Moran E.C., Lehnert M.D., Helfand D.J., 1999, ApJ, 526, 649
- [93] Lilly S.J., Le Fevre O., Hammer F., Crampton D., 1996, ApJ, 460, L1
- [94] Page M.J., Stevens J.A., Mittaz J.P.D., Carrera F.J., 2001, Science, 294, 2516
- [95] Peacock J.A. et al., 2000, MNRAS, 318, 535
- [96] Puget J.-L., Abergel A., Bernard J.-P., Boulanger, F., Burton W.B., Desert F.-X., Hartmann D., 1996, A&A, 308, L5
- [97] Read A.M., Ponman T.J., 1998, MNRAS, 297, 143
- [98] Rengarajan T.N., Takeuchi T.T., 2001, PASJ, 53, 433 [RT]
- [99] Roche N.D., Almaini O., Dunlop J.S., Ivison R.J., Willott C.J., 2002, MNRAS, submitted (astro-ph/0205259)
- [100] Schlegel D.J., Finkbeiner D.P., Davis M., 1998, ApJ, 500, 525
- [101] Scott S.E. et al., 2002, 331, 817 [S02]
- [102] Serjeant S. et al., 2002, MNRAS, submitted (astro-ph/0201502)
- [103] Silk J., Rees M.J., 1998, A&A, 333, L1
- [104] Silva L., Granato G.L., Bressan A., Danese L., 1998, ApJ, 509, 103
- [105] Smail I., Ivison R.J., Blain A.W., 1997, ApJ, 490, L5
- [106] Smail I., Ivison R.J., Blain A.W., Kneib J.-P., 1998, ApJ, 507, L21
- [107] Smail I., Ivison R.J., Kneib J.-P., Cowie L.L., Blain A.W., Barger A.J., Owen F.N., Morrison G., 1999, MNRAS, 308, 1061
- [108] Smail I., Ivison R.J., Owen F.N., Blain A.W., Kneib J.-P., 2000, ApJ, 528, 612
- [109] Smail I., Ivison R.J., Blain A.W., Kneib J.-P., 2002a, MNRAS, 331, 495
- [110] Smail I., Owen F.N., Morrison G.E., Keel W.C., Ivison R.J., Ledlow M.J., 2002b, MNRAS, submitted
- [111] Smith G.P. et al. 2002, MNRAS, 330, 1
- [112] Soifer B.T., Houck J.R., Neugebauer G., 1987, ARAA, 25, 187
- [113] Soucail G., Kneib J.-P., Bézecourt L., Metcalfe L., Altieri B., Le Borgne J.-F., 1999, A&A, 343, L70
- [114] Steidel C.C., Adelberger K.L., Giavalisco M., Dickinson M., Pettini M., 1999, ApJ, 519, 1
- [115] Townsend R.H.D., Ivison R.J., Smail I., Blain A.W., Frayer D.T., 2001, MNRAS, 328, L17
- [116] Yan L., McCarthy P.J., Freudling W., Teplitz H.I., Malumuth E.M., Weymann R.J., Malkan M.A., 1999, ApJ, 519, L47
- [117] Yun M.S., Carilli C.L., 2002, ApJ, 568, 88
- [118] Yun M.S., Reddy N.A., Condon J.J., 2001, ApJ, 554, 803
- [119] Webb T.M.A., Eales S.A., Lilly S.J., Clements D.L., Dunne L., Gear W.K., Flores H., Yun M., 2002b, ApJ, submitted (astro-ph/0201180)
- [120] Webb T.M.A. et al., 2002a, ApJ, submitted (astro-ph/0201181)
- [121] White, R.L., Becker R.H., Helfand D.J., Gregg M.D., 1997, ApJ, 475, 479
- [122] Willott C.J. et al., 2002, MNRAS, submitted