1) Istituto Nazionale di Fisica Nucleare INFN, Rome
2) University of Rome ”Tor Vergata” and INFN, Rome 2
3) IFSI-CNR and INFN, Rome
4) University of L’Aquila and INFN, Rome 2
5) IESS-CNR and INFN, Rome
6) University of Rome ”La Sapienza” and INFN, Rome
7) Istituto Nazionale di Fisica Nucleare INFN, Frascati
8) University of Ferrara and IASF-CNR, Bologna
9) University of Ferrara, Ferrara
10) University of Ferrara, Ferrara and ITA “I. Calvi”,
Finale Emilia, Modena
11) University of Rome ”Tor Vergata” and INFN, Frascati
12) IFSI-CNR and INFN, Rome 2
13) IFSI-CNR and INFN, Frascati
Search for correlation between GRB’s detected by BeppoSAX
and gravitational wave detectors EXPLORER and NAUTILUS
Abstract
Data obtained during five months of 2001 with the gravitational wave (GW) detectors EXPLORER and NAUTILUS were studied in correlation with the gamma ray burst data (GRB) obtained with the BeppoSAX satellite. During this period BeppoSAX was the only GRB satellite in operation, while EXPLORER and NAUTILUS were the only GW detectors in operation. No correlation between the GW data and the GRB bursts was found. The analysis, performed over 47 GRB’s, excludes the presence of signals of amplitude , with 95% probability, if we allow a time delay between GW bursts and GRB within s, and , if the time delay is within s. The result is also provided in form of scaled likelihood for unbiased interpretation and easier use for further analysis.
1 Introduction
One of the most important astrophysical phenomena still lacking an explanation is the origin of the celestial gamma-ray bursts (GRB). These are powerful flashes of gamma-rays lasting from less than one second to tens of seconds, with isotropic distribution in the sky. They are observed above the terrestrial atmosphere with X– gamma–ray detectors aboard satellites [1, 2]. Thanks to the BeppoSAX satellite [3], afterglow emission at lower wavelengths has been discovered [4, 5, 6] and we now know that at least long (s) GRB’s are at cosmological distances, with measured red shifts up to 4.5 (see, e.g., review by Djorgovski [7] and references therein). Among the possible explanations of these events, which involve huge energy releases (up to erg, assuming isotropic emission), the most likely candidates are the collapse of a very massive star (hypernova) and the coalescence of one compact binary system (see, e.g., reviews by Piran [8] and Mészáros [9] and references therein). In both cases emission of gravitational waves (GW) is expected to be associated with them (e.g. Ref. [10]). According to several models, the duration of a GW burst is predicted to be of the order of a few milliseconds for a variety of sources, including the coalescing and merging black holes and/or neutron star binaries. Therefore GW bursts can be detected by the present resonant detectors, designed to detect GW through the excitation of the quadrupole modes of massive cylinders, resonating at frequencies near 1 kHz.
At the distances of the GRB sources ( Gpc), the GW burst associated with a total conversion of 1-2 solar masses should have amplitude of the order of . The present sensitivity for 1 ms GW pulses of the best GW antennas with signal to noise ratio (SNR) equal to unity is (see e.g. Ref. [11]), which requires a total conversion of one million solar masses at 1 Gpc. However, although detection of a gravitational signal associated with a single GRB appears hopeless, detection of a signal associated with the sum of many events could be more realistic. Thus we launched a program devoted to studying the presence of correlations between GRB events detected with BeppoSAX and the output signals from gravitational antennas NAUTILUS and EXPLORER.
Searching for correlation between GRB and GW signals means dealing with the difference between the emission times for the two types of phenomena. Furthermore, there is also the fact to consider that the time difference can vary from burst to burst. In the present analysis we use an algorithm based on cross-correlating the outputs of two GW detectors (see [12, 13]), thus coping with the problem of the unknown possible time difference between GRB and GW bursts, and also of the unmodelled noise.
2 Experimental data
The Rome group operates two resonant bar detectors: EXPLORER [14], since 1990, at the CERN laboratories, and NAUTILUS [15], since 1995, at the INFN laboratories in Frascati.
| detector | latitude | longitude | orientation | mass | |||
|---|---|---|---|---|---|---|---|
| kg | Hz | K | Hz | ||||
| EXPLORER | N | E | E | 2270 | 904.7 | 2.6 | |
| 921.3 | |||||||
| NAUTILUS | N | E | E | 2270 | 906.97 | 1.5 | |
| 922.46 |
The two detectors, oriented nearly parallel, are very similar. They have operated over the last few years with various levels of sensitivity, and since March 2001 they have been in operation simultaneously with the best ever reached sensitivity for millisecond bursts, of the order of . The detectors consist of massive cylindrical bars 3 m long made of high quality factor Aluminum alloy 5056. The GW excites the first longitudinal mode of the bar, which is cooled to liquid helium temperature to reduce the thermal noise. To measure the bar strain induced by a GW, a secondary mechanical oscillator tuned to the cited mode is mounted on one bar face and a sensor measures the displacement of the secondary oscillator.
The data have a sampling time of 4.544 ms and are processed with a filter matched to delta-like signals for the detection of short bursts [16] . The filter is adaptive and makes use of power spectra obtained during periods of two hours. The filtered output is squared and normalized using the detector calibration, such that its square gives the energy innovation for each sample. In the presence only of well behaved noise due to the thermal motion of the bar and to the electronic noise of the amplifier, the probability density function of is
| (1) |
where is expressed in kelvin units, and the average value of , , called effective temperature, gives an estimation of the noise. If a signal of energy due to an impulsive force acting on the bar is generated at time , the change of the filtered data energy with time, neglecting the noise contribution, has an envelope which depends on the detector bandwidth as follows:
| (2) |
where the bandwidth is given in Table 1. In addition to the well behaved and modeled noise (electronic and thermal noise), other sources of noise are active, sometimes of unknown origin. This requires more than one detector to be simultaneously used, in order to discriminate a real signal from noise.
For our detectors, the relationship between burst energy expressed in kelvin and dimensionless amplitude is given by [17]
| (3) |
where is the duration of the burst, conventionally assumed to be s.
In the following, for a given signal of energy , we shall use the signal-to-noise ratio
| (4) |
For the GRB’s we consider the observations made with the Gamma Ray Burst Monitor (GRBM, [19]) aboard the BeppoSAX satellite, the only satellite for the GRB detection in operation during 2001. The GRBM is an all sky monitor which operates in the range from 40 to 700 keV, with a GRB detection rate of about 0.7 events/day. For each GRB which triggers the on-board trigger logic, high time resolution (up to ms) time profiles are transmitted. In addition, s count rates from the GRBM in two energy bands ( and ) are continuously recorded and transmitted. From the GRBM data rough information on the GRB direction can also be derived [20].
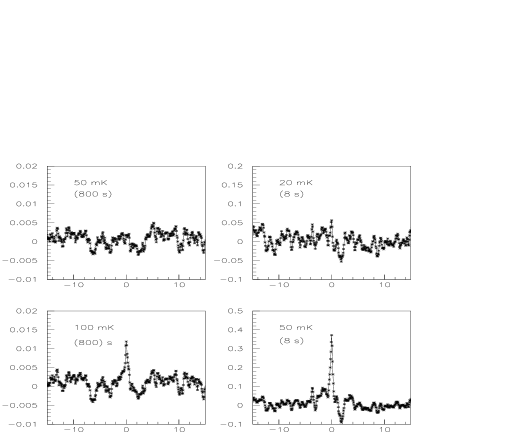
For the present analysis we use two quantities from the GRBM data: the initial time of each GRB and its burst duration. In the period 1 March through 17 July 2001 we have 101 BeppoSAX bursts, but only 51 occur at times when both antennas were operating. The GRB fall into two categories: one of the 38 GRB events with short duration (s) and another one of 63 GRB with longer duration. The short duration events include all the GRB’s which did not trigger the on-board logic, thus their exact duration is not available. Indicating with (trigger time) the initial time for the GRB’s, for each burst we considered the EXPLORER and NAUTILUS data in s intervals centered at the ( s). Each interval is covered by data samples. The average value of the data gives, in absence of signal, noise temperature . The distributions of obtained for these stretches of GW data are shown in Fig. 1.

We note the good behavior of both detectors. In view of this good behaviour we thought to limit our analysis to the 47 stretches with mK on both detectors, losing only four stretches. For these stretches we have the following average values: mK and mK.
3 Cross-correlation analysis
Due to the unknown time gap between GW’s and GRB’s, it is essential to have at least two independent GW detectors at disposal. In such a case we can cross-correlate the two outputs, since we expect that, if any GW burst arrives on the Earth, both detectors respond at the same time within the travel time difference of the GW burst. EXPLORER and NAUTILUS being about km apart, the maximum travel time difference is about ms, shorter than the time uncertainty of the measurements, of the order of 1 sampling time. Since we use resonant transducers, the signal is, for each detector, distributed over the two resonance modes, with a beat period of ms. To cope with this problem we averaged our data over 16 samples, that is over a time of s. Thus during each 800 s interval we have 11004 pairs of data which we can cross-correlate.
The correlation function is defined by
| (5) |
where the summations are extended over the 11004 pairs, refers to the EXPLORER squared data and is the same quantity for NAUTILUS. is dimensionless, by definition. If simultaneous signals due to GW bursts arise both in the EXPLORER and NAUTILUS detectors, no matter when, with respect to the GRB arrival time, but within the time window of s, we should find a larger value of for s.
The 47 values of , one for each GRB, are used to calculate the average cross-correlation , shown in Fig. 2. No significant correlation is visible. In particular, at s we get the negative value of .

We also repeated the above calculations separately for the GRB’s with short (s) and long (s) time duration. Again, no correlation appears between EXPLORER and NAUTILUS using a window of s centered at the GRB arrival times.
3.1 Modeling the average cross-correlation
In order to provide quantitative information out of this null result, we need to model our expectations for the average cross-correlation at zero delay time , hereafter indicated with , under the hypothesis that such signals do exist.
This modeling means going through the following considerations.
Let us suppose that GW generate signals in our two detectors with given signal-to-noise ratios, say SNRexpl and SNRnaut. In the present case, since both detectors have about the same sensitivity (mK and mK) and are parallel, we take, roughly, . We define
| (6) |
where is the standard deviation of our expectations of the dimensionless . This quantity can be estimated from the spread of the many available measurements of for different (see Fig. 2). The distribution of for all delay times, shown in Fig. 3,

can be modeled by a Gaussian (see solid line in the figure), and the standard deviation calculated directly from the histogram coincides with that obtained by a Gaussian fit (0.00189 and 0.00191, respectively).
It is possible to evaluate in an alternative way (see Appendix A) , using the number of GRB’s and the number of independent GW data samples , in each data stretch used for calculating the cross-correlation. The following formula is obtained:
| (7) |
We estimate the number of independent data points by the number of independent data of EXPLORER (the bandwidth of NAUTILUS is much narrower, see Table 1) as follows
| (8) |
since the detector data are correlated within a time . We finally get , in excellent agreement with the value 0.0019 deduced from the distribution of , considering the roughness of our estimation of the number of independent data, .
In Appendix A, the following important relationship between the measured quantity (at s) and the possible signals expressed in term of signal to noise ratio SNR is obtained:
| (9) |
In order to check the model for the average cross-correlation at zero delay time, and thus Eq. 9, we performed a test by adding to the data, for each GRB, signals of given amplitude at the same time for the two detectors. The results are given in Fig.4, where we show the cross-correlation for some applied signals for the two time windows of s and s. The results here are given in terms of the dimensionless average cross-correlation, but in the figure we have also indicated the energies of the input signals. We notice that, as predicted by Eq. 9, the increases by reducing the intervals of the cross-correlation, for a given .
3.2 Relations between , burst energy and dimensionless amplitude
Since we require the result in terms of GW amplitudes , we need to relate cross-correlation quantities to energies.
From Eqs. (4) and (9) we obtain
| (10) |
It would appear that decreases with increasing , i.e. bandwidth, but it can be demonstrated that decreases linearly with increasing bandwidth.
In terms of the dimensionless amplitude, using Eq. (3) with 1 ms we get,
| (11) |
with E expressed in kelvin. We finally get, using Eqs. (6) and (10)
| (12) |
We observe that a negative value of gives a negative value for . To check the validity of Eq. (10), we applied several signals for various time windows of correlation and compared the energies of the input simulated signals to the values calculated using Eq. (10). This is done in the following way: we note that , in the absence of applied signals, is not null for each time window. We determine the signal we must apply in order to increase the value of , obtained before the application of the signals, by two standard deviations. We then use Eq.(10) with the value . The result is shown in Table 2.
| window | [mK] | [mK] |
| s | calculated, Eq. (10) | simulated (input signals) |
| 43.8 | 45 | |
| 24.6 | 27 | |
| 19.6 | 19 | |
| 13.8 | 14 |
The agreement between the values of the simulated input signals and the values calculated using Eq. (10) shows that our model is correct.
4 Inference of the GW burst amplitude
Having presented the experimental method and the model for the averaged correlation at zero delay time , we can infer the values of GW amplitude consistent with the observation. We note that, using Eqs. 10 and 6, energy is related to the measured cross-correlation by
| (13) |
Hence, the data are summarized by an observed average squared energy , at standard deviation from the expected value in the case of noise alone, as calculated with the aid of Eq. (12) where we put . The standard deviation, expressed in terms of squared energy, is obtained from Eq. (12), in the case , which gives .
4.1 Probabilistic result and upper limits
According to the model discussed above, in the case of GW signals of energy , we expect to be a random number, modeled with a Gaussian probability density function around with a standard deviation :
| (14) |
where is the unknown quantity we wish to infer from the observed value of , given in Eq. 13. This probability inversion is obtained using Bayes’ theorem (see, e.g., [22] for a physics oriented introduction):
| (15) |
where is the prior probability density function of observing GW signals of squared energy . In fact, we are eventually interested in inferring the GW’s amplitude , related to the energy by Eq. (11). Therefore we have a similar equation:
| (16) |
where is obtained by a transformation of . As prior for we considered a uniform distribution, bounded to non negative values of , obtained from Eq. 16, i.e. is a step function . This seems to us a reasonable choice and it is stable, as long as other priors can be conceived which model the “positive attitude of reasonable scientists“ (see Ref. [22, 25]) 111A prior distribution alternative to the uniform can be based on the observation that what often seems uniform is not the probability per unit of , but rather the probability per decade of , i.e. researchers may feel equally uncertain about the orders of magnitudes of . This prior is known as Jeffreys’ prior, but, in our case, it produces a divergence for in Eq. 16, a direct consequence of the infinite orders of magnitudes which are equally believed. To get a finite result we need to put a cut-off at a given value of . This problem is described in depth, for example, in [25] and in [26]. .
The probability density function of is plotted in Fig. 5.

The highest beliefs are for very small values, while values above are practically ruled out. From Fig. 5 we obtain an expected value and standard deviation for of and , respectively, which fully account for what is perceived as a null result.
In these circumstances, we can provide an upper limit, defined as value , such that there is a given probability for the amplitude of GW’s to be below it, i.e.
| (17) |
with the chosen probability level. Results are plotted in Fig.6.

For example, we can exclude the presence of signals of amplitudes with 95% probability.
4.2 Prior-independent result and upper sensitivity bound
Probabilistic results depend necessarily on the choice of prior probability density function of . For example, those firmly convinced that GW burst intensities should be in the region would never allow a 5% chance to above . Therefore, in frontier research particular care has to be used, before stating probabilistic results. The Bayesian approach, thanks to the factorization between likelihood and prior, offers natural ways to a present prior-independent result. The simple idea would be just to provide the likelihood for each hypothesis under investigation, in our case . More conveniently, it has been proposed ([23]-[25]) to publish the likelihood rescaled to the asymptotic limit, where experimental sensitivity is lost completely; , in our case. Indicating with this rescaled likelihood, we have
| (18) |
In statistics jargon, this function gives the Bayes factor of all hypotheses with respect to . In intuitive terms, it can be interpreted as a “relative belief updating ratio” or a “ probability density function shape distortion function”, since from Eq. (16) we have
| (19) |
In the present case we get, numerically
| (20) |
where is the rescaling factor, and
The result is given in Fig. 7,

where the choice of the log scale for is to remember that there are infinite orders of magnitudes where the value could be located (and hence the problem discussed in footnote 1). Interpretation of Fig. 7, in the light of Eqs. (18)-(19), is straightforward: up to a fraction of the experimental evidence does not produce any change in our belief, while values much larger than are completely ruled out. The region of transition from from 1 to zero identifies a sensitivity bound for the experiment. The exact value of this bound is a matter of convention, and could be, for example, at , or . We have and , respectively. Note that these bounds have no probabilistic meaning. In any case, the full result should be considered to be the function, which, being proportional to the likelihood, can easily be used to combine results (for independent datasets the global likelihood is the product of the likelihoods, and proportional constants can be included in the normalization factor). Note that the result given in terms of scaled likelihood and sensitivity bound cannot be misleading. In fact, these results are not probabilistic statements about and no one would imagine they were. On the other hand, “confidence limits’, which are not probabilistic statements on the quantity of interest, tend to be perceived as such (see e.g. [28] and references therein).
5 Conclusion
Using for the first time a cross-correlation method applied to the data of two GW detectors, EXPLORER and NAUTILUS, new experimental upper limits have been determined for the burst intensity causing correlations of GW’s with GRB’s. Analyzing the data over 47 GRBs, we exclude the presence of signals of amplitude , with 95% probability, with a time window of . With the time window of s, we improve the previous GW upper limit to about .
The result is also given in terms of scaled likelihood and sensitivity bound, which we consider the most complete and unbiased way of providing the experimental information.
In a previous paper [21] we had given more stringent upper limits, but this was under the hypothesis that the GW signals always occur at the same time with respect to the GRB arrival time. Here, instead, we only require that the time gap between the GRB and the GW burst be within a given time window. Similar comparison can be made with the AURIGA/BATSE result [29], where an upper limit “ with C.L. 95% ” is estimated under the assumption that GW’s arrive at the GRB time within a time window of s.
Finally, we remark that this method can be applied for any expected delay between GRB and GW, with appropriate time shifting of the integration window with respect to the GBR arrival time, according to the prediction of the chosen model.
6 Acknowledgments
We thank F. Campolungo, R. Lenci, G. Martinelli, E. Serrani , R. Simonetti and F. Tabacchioni for precious technical assistance. We also thank Dr. R. Elia for her contribution.
Appendix A
Given two independent detectors, let and be the measured quantities, which are the (filtered) data in our case.
We introduce the variables and where and . We recall that the cross-correlation function is
| (21) |
with summation extended up to the number of independent samples . We calculate . Thus . We easily verify that . In the absence of any correlated signal we also have .
Let us calculate the variance of . We notice that when squaring the numerator of Eq.21 and taking the average, the cross-terms vanish if the data are independent from each other. Then, since also and are independent variables, we obtain
| (22) |
The previous considerations still apply to the cumulative cross-correlation , obtained by averaging independent . The final variance for the cross-correlation is
| (23) |
Let us now consider an energy signal on both detectors at the same time. The expected value of the cross-correlation at will be positive. In the case of independent data the signal will appear in one datum only and we have:
| (24) |
where we put . We note that, in Eq.24, also when a signal is present.
References
- [1] G. J. Fishman and C. A. Meegan, Annual Rev Astr. Astrophys. 33 (1995) 415
- [2] G. J. Fishman and D. H. Hartmann, Scientific American, July (1997).
- [3] G. Boella et al., Astron. Astrophys. Suppl. 122 (1997), 299
- [4] E. Costa et al. Nature, 387 (1997) 783
- [5] J. Van Paradijs et al., Nature, 386 (1997), 686
- [6] D. A. Frail et al., Nature, 389 (1997) 261
- [7] S. G. Djorgovski et al., in: Proc. IX Marcel Grossmann Meeting, eds. V. Gurzadyan, R. Jantzen, and R. Ruffini, Singapore: World Scientific, in press (2001)
- [8] T. Piran, Phys. Rep., 314 (1999), 575
- [9] P. Mészáros, Science 291 (2001), 79
- [10] K. S. Thorne, in Recent Advances in General Relativity, edited by A. Janis and J. Porter, Birkhauser, Boston, (1992), 196
- [11] P. Astone, CQG 19,7 (2002), 1443-1448
- [12] S. Finn et al., Phys.Rev. D 60, 121101 (1999)
- [13] G. Modestino and A. Moleti Phys. Rev. D65, 022005 (2002)
- [14] P. Astone et al. Phys. Rev. D47, 362 (1993)
- [15] P. Astone et al., Astroparticle Phys. 7 (1997), 231-243
- [16] P. Astone, C. Buttiglione, S. Frasca, G.V. Pallottino and G. Pizzella, Il Nuovo Cimento 20,9 (1997)
-
[17]
P.Astone et al. Proc. ”Gravitational Astronomy” pag 189
Ed. D.E.McClelland and H.A.Bachor, World Scientific 1991 - [18] G. Pizzella ”Status of resonant bar detectors” ICTP Conference on Gravitational Waves 2000, Trieste, Italy, 5-9 Jun 2000. Published in “Trieste 2000, Gravitational waves”, 243-255
- [19] F. Frontera et al., Astron. & Astrophys. Suppl. 122 (1997), 357
- [20] C. Guidorzi et al., in: Gamma–Ray Bursts in the Afterglow Era, eds. E. Costa, F. Frontera & J. Hjorth (Springer-Verlag, Berlin), p. 43 (2001).
-
[21]
G. Modestino el al. Proc. Vulcano Workshop 1998
”Frontier Objects in Astrophysics”, pag. 295
Ed. F.Giovannelli and G.Mannocchi Editrice Compositori, Bologna, Italy 1999 - [22] G. D’ Agostini Bayesian reasoning in high-energy physics:principles and applications CERN 99-03 (1999) This report and related references can be found at the URL: http://www-zeus.roma1.infn.it/ agostini/prob+stat.html
- [23] J. Breitweg et al. (ZEUS collaboration), Eur. Phys. J C14 (2000) 239-254 hep-ex/9905039
- [24] G. D’Agostini and G. Degrassi, Eur. Phys. J. C 10 (1999) 663-675 hep-ph/9902226
- [25] P. Astone and G. D’Agostini, CERN-EP/99-126 and hep-ex/9909047
- [26] G. D’Agostini, Overcoming priors anxiety, invited contribution to the monographic issue of the Revista de la Real Academia de Ciencias on Bayesian Methods in the Sciences, ed. J.M. Bernardo (1999) physics/9906048.
- [27] P. Astone, G. Pizzella, Astroparticle Physics 16 (2002) 441-450
- [28] G. D’Agostini, Proc. XVIII International Workshop on Maximum Entropy and Bayesian Methods, Garching (Germany), July 1998, V. Dose, W. von der Linden, R. Fischer, and R. Preuss, eds, Kluwer Academic Publishers, Dordrecht, 1999, physics/9811046.
- [29] P. Tricarico et al., Phys. Rev. D, 63, 082002 (2001)