VLT near-infrared spectra of hard serendipitous Chandra sources
Abstract
We present near-infrared long-slit spectra of eight optically-dim X-ray sources obtained with ISAAC on the Very Large Telescope. Six of the sources have hard X-ray emission with a significant fraction of the counts emerging above 2 keV. All were discovered serendipitously in the fields of three nearby galaxy clusters observed with Chandra, and identified through near-infrared imaging. The X-ray fluxes lie close to the break in the source counts. Two of the sources show narrow emission lines, and a third has a broad line. One of the narrow line-emitting sources has a clear redshift identification at , while the other has a tentative determination based on the highest redshift detection of He I 10830 at . The remainder have featureless spectra to deep limiting equivalent widths of 20–60Å and line flux erg s-1 cm-2 in the K-band. High-quality J, H and Ks–band images of the sources were combined with archival optical detections or limits to estimate a photometric redshift for six. Two sources show complex double morphology. The hard sources have spectral count ratios consistent with heavily obscured AGN, while the host galaxy emits much of the optical and near-infrared flux. The most likely explanation for the featureless continua is that the line photons are being scattered or destroyed by optically-thick gas and associated dust with large covering fractions.
keywords:
diffuse radiation – X-rays: galaxies – infrared: galaxies – galaxies: active1 Introduction
The Chandra observatory11footnotetext: Based on observations made with ESO Telescopes at the Paranal Observatories under programme 67.B-018822footnotetext: Based on observations made with the Chandra X-ray Observatory has largely resolved the 2–10 keV X-ray background (XRB) within two years of its launch, after almost four decades of scientific effort (Giacconi et al. 1962; Mushotzky et al. 2000; Brandt et al. 2001; Giacconi et al. 2002). Follow-up work within the past year has revealed that this Chandra source population can be broadly split into type 1 active galactic nuclei (AGN) , narrow emission-line AGN, optically-normal galaxies with no sign of activity other than in X-rays and optically-faint sources which are difficult to identify (Barger et al. 2001; Alexander et al. 2001; Rosati et al. 2001; Willott et al. 2001). XMM-Newton, with its higher effective area at 10 keV, has also begun to deliver results (Hasinger et al. 2001) which confirm the essential Chandra findings (e.g., Lehmann et al. 2001a; Mainieri et al. 2002).
The individual X-ray spectra of the hard sources are flat enough to account for the XRB spectral slope of 0.4 (Marshall et al. 1980; Gruber et al. 1999), and their integrated flux contributes percent of the XRB intensity. The ambiguity in the absolute intensity, still to be resolved, is caused by cross-calibration mismatches between various X-ray missions and/or cosmic variance of the sources themselves (eg, Barcons et al. 2000; Cowie et al. 2002). Essentially, these observations agree with models which synthesize the XRB through the integrated emission of populations of obscured AGN that are spread over redshift and have a range of intrinsic absorbing column densities of gas (Setti & Woltjer 1989; Gilli, Salvati & Hasinger 2001; Wilman, Fabian & Nulsen 2000; Comastri et al. 1995). Little evidence had been found in pre-Chandra surveys for the existence of highly absorbed, intrinsically powerful objects (e.g., Halpern, Turner & George 1999).
1.1 Obscured ‘type 2’ sources
What would be the observable characteristics of such obscured objects? In the framework of the standard torus model for AGN (Antonucci & Miller 1985), luminous yet narrow emission lines generated at parsec-scale distances from the nucleus should be visible in the optical band. Direct optical nuclear radiation would be scattered out of our line-of-sight, making optically-faint sources good type 2 AGN (and powerful type 2 QSO) candidates. In X-rays, the proportion of sources that are observed through transmitted radiation would depend on the range of inclination angles that are Compton-thin.
While the current Chandra and XMM-Newton surveys have observed such sources, they have also found a substantial number of objects that possess few, or no, emission lines in their optical spectra. Some sources show absorption features characteristic of early-type galaxy spectra, while others are difficult to identify. For examples of these and other type 2 QSOs, refer to Stern et al. (2002), Norman et al. (2002), Gandhi, Fabian & Crawford (2002), Hasinger (2002) and Nakanishi et al. (2001). In the 0.5–10 keV X-ray band, many sources show transmitted flux being reprocessed by absorbing matter of column densities cm-2. Thus, large scale and/or large covering factor absorption is necessary to obscure all optical emission, but this should not be ompton-thick. This raises the question of whether the sources that will emerge in future 10–40 keV surveys will be an entirely new population of even harder X-ray sources, or whether there will be large overlap with the current population.
1.2 Our previous work
We have been studying hard X-ray sources found serendipitously in the fields of massive clusters of galaxies with Chandra (Crawford et al. 2001; 2002; Gandhi et al. 2002). The flux regime that we sample is erg s-1 cm-2. This is an important regime, as the bulk of the XRB intensity is generated in populations with these fluxes (e.g., Cowie et al. 2002). Our work complements surveys such as ChaMP (Wilkes et al. 2001) and XMM-Newton serendipitous surveys (Watson et al. 2001; Barcons et al. 2001; Baldi et al. 2002).
By targeting the hard, optically-dim sources with multi-band imaging leading to photometric redshifts as well as optical spectroscopy, we have been able to discover both broad and narrow-line AGN and find that these lie at a large range of redshift (). The broad-line sources have equivalent-widths and line-fluxes similar to those identified by previous missions such as ROSAT (Lehmann et al. 2001b) and are predominantly associated with the X-ray soft sources. The hard sources have X-ray spectra that suggest high but Compton-thin absorption and possess narrow emission lines (Seyfert 2s). We also find one source which does not fit this pattern: with high X-ray absorption (N cm-2) but a broad strong Mg II 2797Å line, this source probably has a dust:gas ratio different to the Galactic value (Crawford et al. 2002).
The gravitational magnification of the cluster potential well enables us to study, rather than just detect, some sources which lie within 1 arcmin of the cluster centre. Two such sources magnified by factors of 2 and 8 by the cluster Abell 2390 were found to be powerful obscured (N cm-2) sources, even after de-magnification. The first source (A18 in Crawford et al. 2002) has an intrinsic X-ray luminosity L erg s-1, while ISOCAM 6.7 and 15- detections are used to infer an absorbed big blue bump luminosity L erg s-1 for the second source (A15).
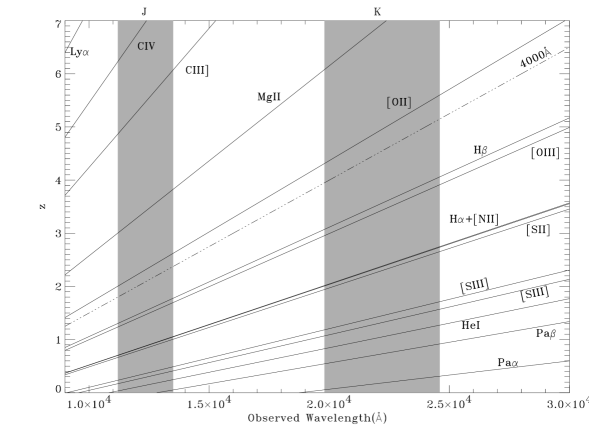
In this work we study a small sample of hard serendipitous sources in the near infrared (NIR) with the ISAAC instrument on the Very Large Telescope (VLT). There are a number of reasons for choosing the NIR regime: 1) as we have previously shown (Crawford et al. 2001), optically-dim sources are relatively bright in the NIR, making their study possible; 2) XRB synthesis models have so far predicted a characteristic source redshift of , where typically strong emission lines such as H or H would be redshifted to the NIR (Fig 1); 3) longer wavelength rest-frame lines are less sensitive to reddening and should be detectable through higher obscuring columns.
This extends our previous work of obtaining UKIRT spectra (Crawford et al. 2001) of such sources to deeper equivalent width limits and provides constraints on the utility of using an 8m class telescope in the NIR for such studies.
Quoted cosmological quantities assume H km s-1 Mpc-1 and q throughout.
2 Sample Selection
We are studying unresolved X-ray sources found serendipitously in Chandra ACIS-S observations of nearby galaxy clusters, preferentially selecting hard sources with count ratios 2 (see section 3). Roughly one-third of the entire ACIS sample is hard by this definition.
Our total sample consists of more than 20 clusters and covers the entire range in right ascension. Thus, our initial follow-up catalogue is the Digitized Sky Survey (DSS)111http://archive.stsci.edu/cgi-bin/dss_form, on which we target the sources that are dim or invisible (22.5; 21; hereafter referred to as optically-dim). At the flux level that we sample, roughly 40 percent of all X-ray sources satisfy this criterion. As our pointings lie in the directions of massive galaxy clusters, we can make use of rich archival resources and often get fainter detections and/or limits. We find that optically-dim sources in 10–20 ksec ACIS exposures cover a wide range in magnitude: 2224 and 1923. Most of these are detected in the NIR at 16.519. For deeper Chandra exposures, our faintest limits are 25.5, 24 and 20.
Our ‘best’ targets are the hard sources that are also optically-dim and we estimate these to be about 50 percent of the hard X-ray serendipitous sample. We also include a few exceptionally hard sources which may have optical counterparts on the DSS.
For the present work, we selected 8 sources found serendipitously in 3 clusters observable from the southern hemisphere (see next section). 6 of these are hard, and 2 soft sources are included for comparison. 6 are optically-dim and 1 soft source has =20. We were forced to observe a relatively bright source with (but very hard) due to poor atmospheric transparency on one night. This small sample represents about 13 percent of all the detected X-ray sources, and 25 percent of the hard sources.
3 X-ray observations
The Chandra cluster observations from which we chose sources for the present work are : MS 2137.3-2353 (sequence number 800104, duration 50 ks), A 1835 (800003 of 19.6 ks) and A 2204 (800007, 10 ks). The effective exposure of the Chandra observation of MS2137.3–2353 was limited by background flaring to 34.7 ks; the other observations were unaffected by background variations. The data were processed with the Chandra Interactive Analysis of Observations (CIAO222http://cxc.harvard.edu/ciao/) software, using versions 2.1 and 1.5. The Galactic line-of-sight column densities in the directions of MS 2137.3-2353, A 1835 and A 2204 are approximately 3.5, 2.3 and 5.6cm-2 respectively (Stark et al 1992).
The source detection was performed in the total 0.5-7 keV band in a very similar manner to that described in Crawford et al (2002), using the standard WAVDETECT package in CIAO. WAVDETECT was run on the data in two forms: the original unbinned pixels (each of half-arcsec width), and binned by two pixels (ie arcsec-long pixels). We used the sequence of wavelet scales (ie 1, 1.414, 2.0 …16.0 pixels), and set the significance threshold for sources at (which implies that the expected number of false sources per ACIS chip is roughly one333WAVDETECT manual at http://cxc.harvard.edu/ciao/). We also checked that the 8 sources studied in this paper were detected with a lower threshold of , thus making them unlikely to be spurious. We discarded all sources within 20 arcsec of the edge of each chip to avoid loss of source counts due to the spacecraft dither, and those with fewer than ten (non-background subtracted) counts. On the ACIS chips from which the present sample of sources was chosen, we found the following total number of sources in the respective cluster fields. MS2137: 11 on S2[chip 6] and 25 on S3[7]; A 1835: 14 on S3[7] and 2 on I2[2]; A 2204: 8 on S2[6] and 3 on I3[3].
We also estimated the counts in each source in 3 energy bands: 0.5-2 keV (soft; S), 2-7 keV (hard; H) and 0.5-7 keV (total). The counts were taken from a box centred around a source, with a length given by the square root of the number of pixels in the source cell (as given from WAVDETECT). The local background was estimated from a concentric box with a length five times longer. The background box was offset if it would otherwise spill over the edge of the chip, or would include a close neighbouring source.
The X-ray properties of the sources are listed in Table 1. None of these are magnified by strong lensing due the cluster potential. Six of the sources are very hard (with S/H ratios of less than 1.6). Fig 2 shows how the S/H ratio can be translated into physical column densities under different assumptions. A simple absorbed power-law () transmission model was adopted within XSPEC (Arnaud 1996) and counts in the soft and hard bands were predicted assuming different Galactic columns appropriate to the cluster line-of-sight and response matrices for each of the two kinds of CCDs on the Chandra ACIS instrument. For the ratios that we observe (0.1–3; Table 1), the implied columns are cm-2 if at ; or the redshifts are consistent with if N cm-2.


Only two sources (A 2204_1 and A 2204_2) have more than 30 counts in the total Chandra band. A2204_2 is relatively soft with most counts lying below 2 keV. A2204_1 is hard and in Fig 3, we show its extracted X-ray spectrum. Despite large errors, the spectrum clearly demonstrates the need for large amounts of X-ray absorption, as compared to the spectrum of a source emitting power-law (photon-index ) radiation modified only by Galactic absorption appropriate to the line-of-sight to A 2204.

4 Follow-up Imaging & Photometry
4.1 Near-Infrared
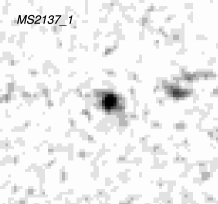
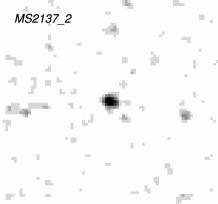
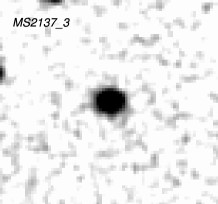
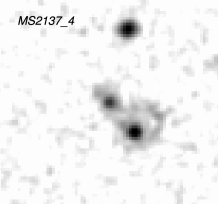
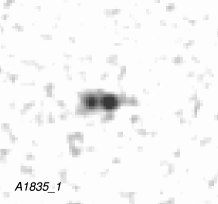
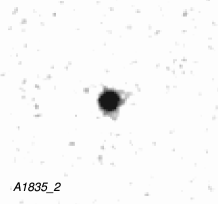
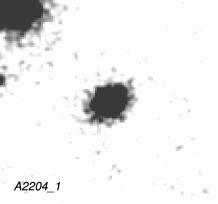
Near-IR images of the selected sources in the MS 2137.3-2353 field were obtained using the imaging spectrograph ISAAC (Moorwoord et al. 1997) on the Very Large Telescope (VLT). Since the field of view is 2.5 arcmin, only 1 Chandra source can be imaged at a time. Thus, imaging was targeted toward a small sample of hard sources (from which 4 were chosen on the subsequent nights for spectroscopy). We observed through the J, H and Ks (hereafter K) filters on 2001 June 28 in seeing of 0.3 arcsec (see Fig 4 for K-band thumbnail images of all the sources). The total integration time used was 600 s in H and K, and 720–900 s in J, with individual exposures of 10 s obtained in jitter mode around a grid with offsets of 30 arcsec. Bad pixel map creation, dark current subtraction and flat-field division were carried out using the jitter routine of the eclipse software package V4.0.4 (Devillard 1997). In addition, jitter was used for background subtraction (using parameters suggested by Iovino 2001) and combination of jittered frames. Three photometric standard stars were observed over the course of the night and the zeropoint in each filter was found to be constant to within an RMS of 0.02 magnitudes.
Magnitudes were computed using the SExtractor package (Bertin & Arnouts 1996). We present the resulting magnitudes of our sources in Table 2 and a log of exposure times in Table 3. These are Kron magnitudes (with a Kron scale of 2.5; Kron 1980) for isolated sources and seeing-corrected isophotal magnitudes (with minimum isophote at 1.5) for blended objects. It has been reported that the jitter pipeline may underestimate the brightness of sources in the K-band due to biasing of the local background in jittered images. We corrected for this by a simple prescription of increasing all the fluxes obtained at the VLT by 10 percent. Refer to Iovino (2001) for more details.
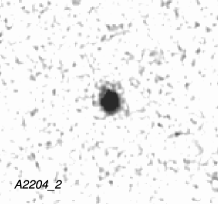
The excellent seeing conditions enabled us to clearly resolve some sources with a double morphology – MS2137_4 and A1835_1 – both possibly interacting (Figure 4). The signal-to-noise decreases in the H and J-bands, but the components are still resolved and separable for photometry. MS2137_3, A1835_1, A2204_1 and A2204_2 show clear ellipticity in the K-band, while the remaining sources – MS2137_1, _2 and A1835_2 are unresolved.
The sources in the field of A 2204 and A 1835 were imaged at UKIRT using the UFTI array (UT date 2000 Aug 11 and Feb 24 respectively; A1835_1 was also observed at ISAAC). A full description of the data reduction is given in Crawford et al. (2001). Essentially, this was carried out using the standard package CGS4DR V2.001 in a manner very similar to that for the ISAAC data. Magnitudes were measured in SExtractor, and are presented in Table 2.
4.2 Optical
DSS (both generation 1 and 2) blue and red images of the X-ray fields were downloaded directly from the ESO mirror of the DSS website444http://archive.eso.org/dss/dss. Deeper identifications of or detection limits to optical counterparts from the AAT, the CFHT and the INT were obtained from the respective archives. These data were calibrated using archival bias-subtraction and flat-fielding frames created on the night of observation. Fringing was removed from the -band data by generating a master fringe frame from six offset frames for the AAT data. Table 4 gives details of the archival datasets used.
Magnitudes were obtained using SExtractor as described in the previous section. Photometric standard stars were used for flux calibration (except one case; see Table 2). DSS magnitudes used a smooth extension of the first generation flux calibration by the Catalogs and Surveys Branch555http://www-gsss.stsci.edu/; based on observations by Lasker et al. (1988) to fainter fluxes. Upper-limits for non-detected objects were defined as the flux corresponding to 3 times the background sky RMS in a 3-arcsec diameter aperture close to the source location. Such an aperture size is typical of the Kron apertures for the fainter of the detected sources. The final magnitudes are listed in Table 2. The INT Wide-Field Camera data was not fringe subtracted; thus apertures were selected by hand and background maps were inspected for consistency.
Typical seeing FWHM diameters for the optical observations were 1 arcsec. Combined with a plate scale which is typically larger than that of ISAAC, the morphology of the sources could not be reliably determined in the optical.
4.3 Source matching
All fields were cross-calibrated with the APM sky survey catalogue666http://www.ast.cam.ac.uk/∼mike/apmcat/ to generate an astrometric solution for each. RMS errors for the solutions were less than a pixel (better than the pixel scale) in all cases over large image regions.
Any astrometric offset between a Chandra source and its corresponding NIR counterpart is typically least ( arcsec) for sources on the ACIS-S3 chip 7, closest to the telescope aim-point. With off-axis PSF degradation, this may increase to several arcsec on the other chips. For example, the centroid determination of A 1835_2 on ACIS chip 2 has large errors (Table 1), which leads to an offset of 5 arcsec from the source that we consider to be the NIR counterpart. There is, however, no source confusion problem (Fig 4) and identification is unambiguous (see also § 6.3.3). In all cases, we could identify a NIR counterpart and associated it with the nucleus of the object.
The probability of a false match occurring by chance was calculated by a ‘randomstep’ method similar to that used by Hornschemeier et al. (2001). Astrometric cross-correlation with DSS images was repeated after all X-ray sources were offset 10 arcsec to the north-east, north-west, south-west and south-east. The number of false source matches, averaged over the four offsets, was small: (zero-offset source match numbers ranged between 10 and 20).
5 Spectroscopic Observations
We acquired spectra of the near-infrared counterparts to the Chandra X-ray sources during the nights of 2001 June 29 and 30, again using ISAAC on the VLT. We used a arcsec slit and the low-resolution grating in the SK (hereafter K) and/or J bands. The choice of the low-resolution grating was made since no apriori information on the redshifts and detectability of the sources was known; the aim was to capture a large amount of source flux through the slit. This resulted in a dispersion of 7.138Å per pixel and a full-width at half-maximum (FWHM) of 45Å for a single narrow night-sky OH emission line assumed to be intrinsically unbroadened (R) in K, and a dispersion of 3.610Å in J, with a limiting FWHM25Å(R). The first night had thick cloud at times, with seeing varying from 1 arcsec to greater than 3 arcsec, whereas the second night was photometric.
The objects were acquired by blind slit offsets from nearby bright stars as measured in pre-imaging. In many cases, the slit was long enough to encompass the star as well as target, thus providing a constant monitor of target acquisition. The targets themselves were nodded on the slit in an A–B–B–A pattern, with a small random jitter offset about each of two nod positions. Typical total exposure times of 2 hr were used, with each integration being 180 s long in order to be background limited. Given the significant loss of data quality on the first, non-photometric night, we only had time to obtain spectra in the and wavelength regimes, covering a wide choice of redshift space with two filters only.
Electrical ghost removal, dark current subtraction, distortion correction of sky lines, background subtraction, flat-fielding and combining of offset images was all performed using the eclipse software, and more specifically isaacp packages written for the ISAAC pipeline. One-dimensional spectra were optimally-extracted with IRAF with a typical extraction aperture of 1.6 arcsec. A wavelength calibration solution was obtained by cross-correlating observed night-sky emission lines with a list of Rousselot et al. (2000).
Each target spectrum was divided by the spectrum of a spectro-photometric solar-analog star (reduced and extracted in an identical manner). Absorption features intrinsic to the star were removed by dividing through a spectrum of the same spectral class (Pickles 1998) or a Solar spectrum777The NSO/Kitt Peak FTS data used here for the solar spectrum were produced by NSF/NOAO which is at a resolution similar to that of the star. Smoothing was performed with a boxcar of typically 5 pixels and finally, flux levels were determined by scaling the count rate in the targets to the count rate of the stars, whose magnitudes are known. The flux density as inferred from the spectra matched well that inferred from imaging in most cases (One notable exception was A2204_1, observed through the slit during cloud cover. The spectral flux density was lower by a factor of 2 than the previous night’s imaging measurement).
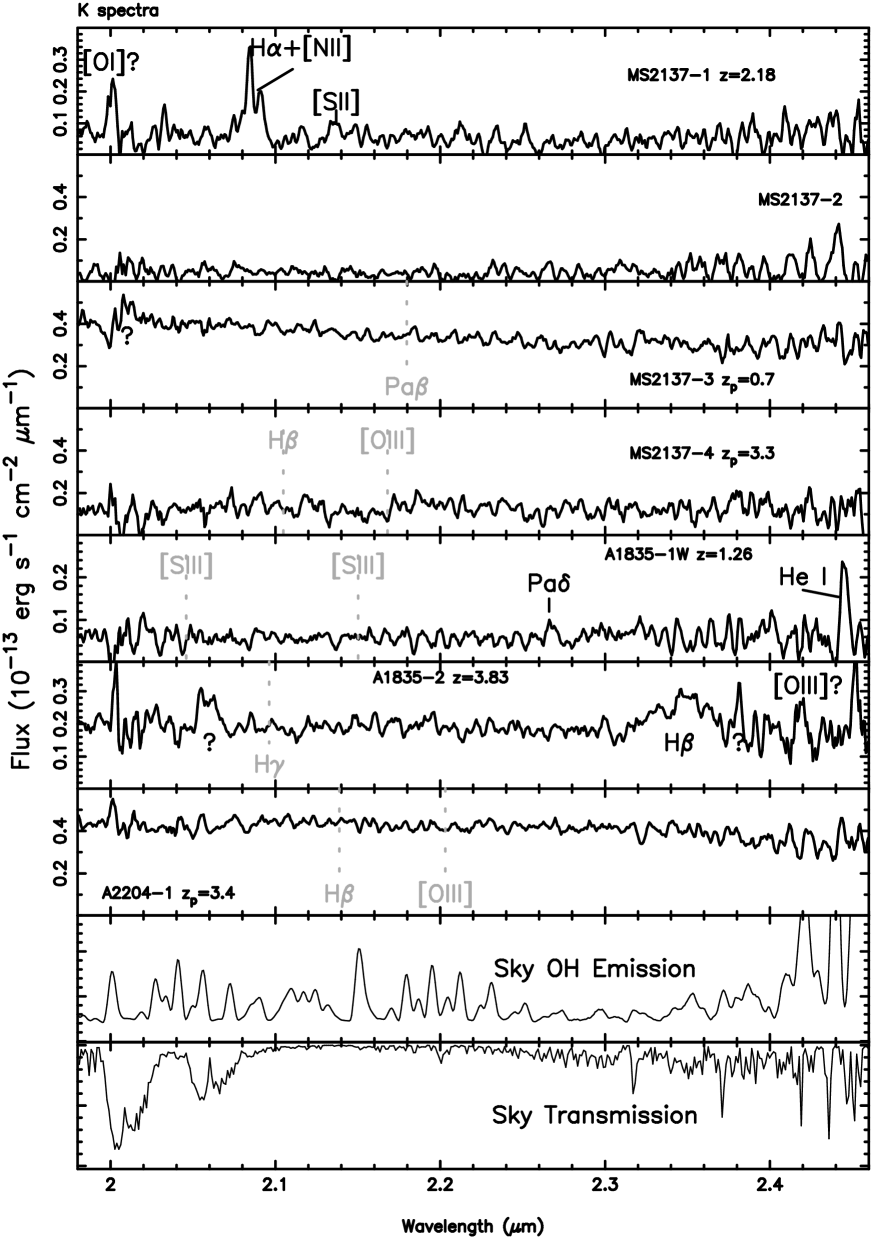
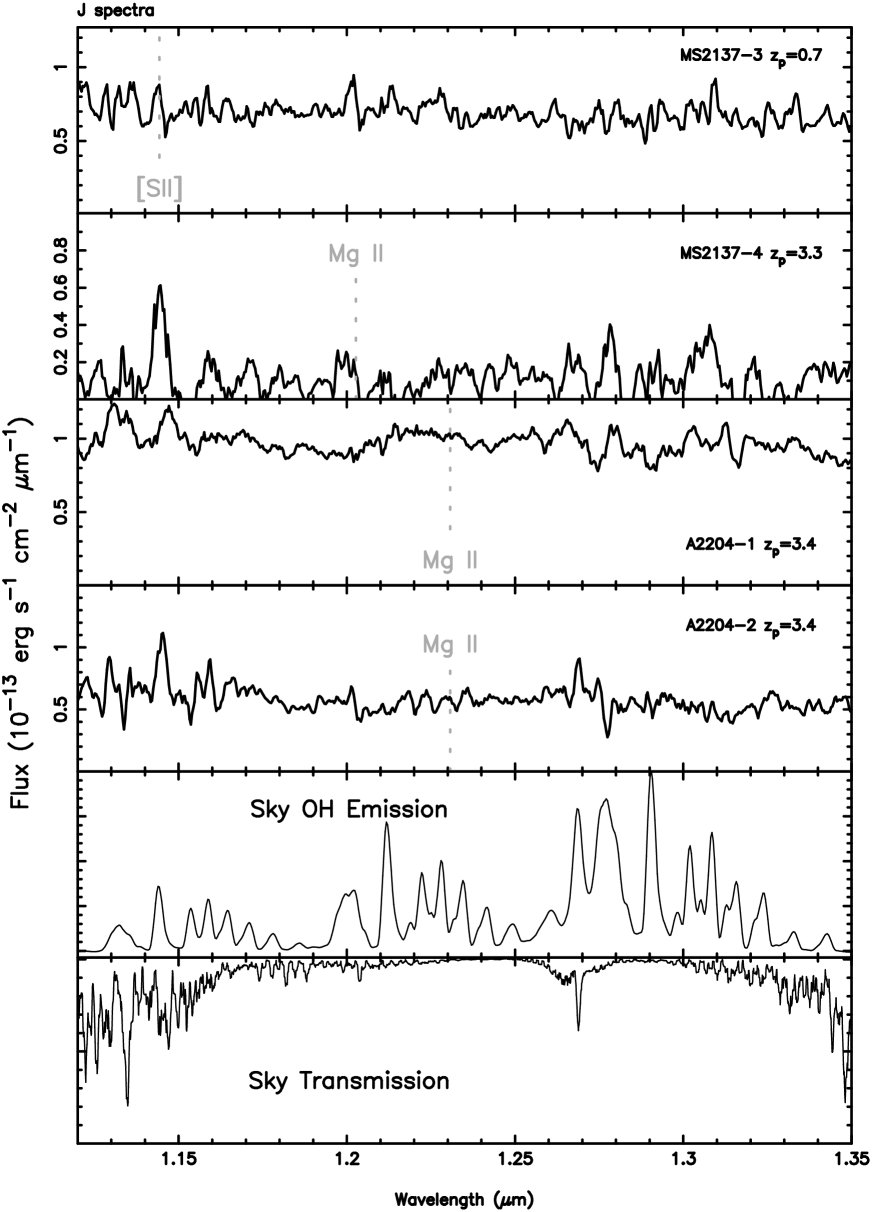
The K and J-band spectra are presented in Figs 5 and 6 and a log of the spectroscopic observations with exposure times and slit position angles is given in Table 3.
6 Results
6.1 Colours and photometric redshifts
The hard S/H ratios argue against any of our targets being stars (The stellar locus is also well separated in vs. colours; c.f. a similar plot for sources in Crawford et al. 2002). The optical–infrared colours in Fig 7 show that most of the sources have colours or limits which are redder than the colour of an unobscured quasar template (Elvis et al. 1994; median of a sample of UV-bright, radio-quiet quasars at low redshift). The red target colours are closer to those predicted for Coleman, Wu, Weedman (1980) redshifted templates (shown without reddening). The three sources with the bluest limits (MS2137_1, MS2137_2 and A 1835_1) are those with only relatively shallow optical lower-limits from the DSS.
We estimated photometric redshifts () for all the sources using the publicly-available code HYPERZ (Bolzonella, Miralles & Pelló 2000), with the input parameters detailed in Crawford et al. (2002). Briefly, HYPERZ varies the redshift and reddening of various synthetic and empirical galaxy and AGN templates in order to best fit the observed fluxes. The synthetic templates used are Bruzual & Charlot (1993) models which are also evolved with redshift. The solutions are listed in Table 5, and shown in Fig 8.
If DSS upper-limits were shallow compared to the flux in the other filters, these were excluded from the HYPERZ fit (MS2137_4 and A 1835_1). Note that 2 of the solutions (A2204_1 and A2204_2) are found at similar . This is primarily due to the large flux seen in the R–band relative to both B and J, placing the Lyman break at . No reliable redshift estimate could be obtained for the two sources (MS2137_1 and MS2137_2) with DSS upper-limits much shallower than the deep J, H and K magnitudes available.


6.2 Spectra
Three sources have strong detectable line emission features in their near-infrared spectra; the rest have no ambiguous emission (or absorption) features above the sky noise (Figs 5, 6 and Table 6). Note that the apparent feature just red of 2 that shows up either as emission or absorption in many of the spectra (Fig 5) is not real. Its wavelength overlaps with that of the OH 20005 and 20008 8–6 Q emission transitions, and also coincides with a strong telluric absorption feature. Since the telluric spectrum is effectively divided out during standard star division, a slight mismatch in the airmass between the target and the star, combined with variation in the intensity of sky OH emission on timescales of minutes, can produce such spurious features which are difficult to remove. Another such spurious emission feature occurs at 1.145 in the J-band (Fig 6).
The limiting equivalent-widths (EW; observed frame) of the spectra range from 20–60Å in the K-band and are close to 15–20Å in the J-band, depending on the exposure time (except for MS2137_4 in the J-band which was observed for 1800 s only and the limiting EW is nearer 100Å). This limit was estimated by measuring the equivalent width of an unresolved gaussian profile with amplitude approximately 3 times the standard deviation of the continuum at various positions along the dispersion axis. Note that this limit is shallower at the positions of sky emission lines.
A discussion of the three sources with unambiguous emission lines follows, while notes for the remaining objects/spectra can be found in the appendix.
6.3 Emission line sources
6.3.1 MS2137_1
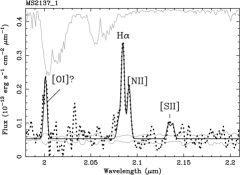
MS2137_1 is invisible on the DSS images, but identified as a point source in the NIR. Its K-band spectrum (top spectrum in Fig 5; Fig 9 for detail) shows an unambiguous H+[NII] complex at 2.0846, implying a redshift of 0.001 for the source. Line emission from [SII]6717,6731 at the same redshift is marginally detected (at 2 above the sky noise). While it appears that [OI]6300 is clearly detected, caution must be applied as this coincides with the spurious feature just beyond 2.
A model with discrete symmetric Gaussian profiles and identical velocity widths fixed to that of H overlaid on a constant continuum was fit using QDP (Tennant 1991). The H line is unresolved and substantially narrower than broad type 1 AGN permitted lines. The [NII]6584:H line intensity ratio is 0.56 and [SII]6717:H intensity is 0.12, which is consistent with that observed both in H II regions and Seyfert 2s (Veilleux & Osterbrock 1987; also Storchi-Bergmann 1991).
While observations of additional emission lines (e.g., redshifted [OIII]5007 in the H-band) may help to distinguish between starburst or AGN origin for the observed K-band emission lines, the hard X-rays must originate from a Seyfert 2. The implied X-ray (2–10 keV restframe) luminosity, assuming a power-law at affected only by Galactic absorption, is L erg s-1. If instead, we assume a crude model based on the observed S/H ratio of 1.1, implying an obscuring column of cm-2 for at (Fig 2), the implied L erg s-1, after correcting for the obscuring column density.
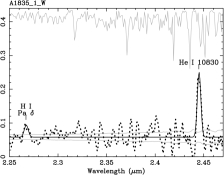
6.3.2 A 1835_1
A 1835_1 is clearly resolved into two components on the ISAAC K-image (Fig 4). An astrometric solution associates the brighter westerly component (A 1835_1W) with the X-ray source (though only marginally). The ISAAC spectrum of this brighter component has a single strong emission line at 2.4452 , again unresolved (fifth spectrum from top in Fig 5). Although the night sky thermal emission begins to dominate beyond , the narrow line is very significant (Fig 9) and lies fortuitously between two bright OH emission lines. The line connects both components of the source and is thus spatially extended (we were able to obtain the spectra of both components simultaneously with a slit orientation of 90∘).
We attempted to identify weak features in the spectrum without much success, before trying to use the photometric redshift estimated from HYPERZ as a first guide towards possible line identification. =1.2 [1.0, 1.5] (Table 5) suggests that the strong line at 2.4452- and a weak 3 emission feature at 2.2673 could be He I 10830 and Pa 10049 respectively (Fig 9), implying a tentative redshift , well within the 90 percent confidence interval. The He I transition has been observed previously in Seyfert 2s with intensity approaching H (and even exceeding it in NGC 1068 and Mrk 3; Rudy et al. 1989; Osterbrock, Shaw & Veilleux 1990). Its strength is enhanced due to collisional excitation from the metastable level to , followed by radiative decay (Osterbrock 1989). The other strong feature expected in this regime ([SIII]9531) is not observed by us. This may imply that the density of the narrow-line region is much greater than the critical density to collisional de-excitation N cm-3. If our identification is confirmed, this would be the highest redshift observation of He I 10830 to date.
Estimating the intrinsic luminosity by correcting for a column-density of cm-2 as implied by the S/H ratio of 0.41 (on a front-illuminated chip) at the inferred redshift, we deduce the presence of a powerful Seyfert emitting power-law radiation ( fixed) with L erg s-1.
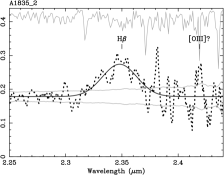
6.3.3 A 1835_2
The large 5 arcsec offset between the Chandra source A 1835_2 and its counterpart is most likely due to the difficulty of centroiding with off-axis (12 arcmin) PSF degradation. The formal probability of a match at such a large offset is 1%. However, if this were not the counterpart, a large X-ray:optical flux ratio and corresponding optical/NIR extinction would be inferred since the counterpart would be invisible in our images. This is unlikely given the softness of the X-ray source.
The spectrum (sixth from top in Fig 5) – is not easy to interpret. There is a clear broad (FWHM4600 km s-1) feature centred at 2.3480 and two ambiguous features marked with a ‘?’ in the figure. No obvious emission line pattern fits these data, and it is likely that the ambiguous lines are spurious and caused by telluric absorption in the first case, and increased thermal noise in the second.
The presence of a broad feature (Fig 9 for detail), the high S/H ratio (Table 1) and the point-like morphology (Fig 4) suggests that we are viewing a quasar. Fitting a QSO template to the broad-band colours gives an acceptable fit at =3.4 [3.0, 4.0] (Table 5). Thus a potential match for the broad feature is with H for =3.8300.005 (within the 90 percent interval). Any [OIII]5007 emission would overlap with an OH emission feature close to 2.1488 (refer to Fig 5; if this [OIII] line exists, it must have EW40Å in the observed frame). We do not see any H4340 emission. Its predicted photoionization recombination intensity is 0.47 times that of H, though we note that Vanden Berk et al. (2001) found that EW(H) EW(H), which implies an H strength close to our limiting EW (Table 6). Moreover, any reddening is likely to further decrease the H:H intensity ratio. Thus, its absence may not be surprising.
Again, assuming and correcting for a column-density of cm-2 (S/H = 3.1), the implied L erg s-1at =3.830, which is consistent with quasar luminosity.
7 Discussion
Of the 8 objects, we detect a broad K-band emission line in one source (A 1835_2) and narrow lines in two sources (MS2137_1 and A 1835_1). The spectrum of the narrow-line source MS2137_1 places a firm redshift constraint of . The other two sources have only a single unambiguous line in their spectra and tentative identifications (at and 3.8) for these lines are determined in conjunction with the photometric redshifts. Two sources (MS2137_3 and A2204_1) have high signal:noise J and K-band featureless continua. The limiting observed-frame equivalent-widths (EW) for these are 20Å in both bands. For the remaining sources, the limiting EW range over 30–60Å in the K-band. Few useful constraints can be obtained from the noisy spectra of MS2137_2 and MS2137_4 (J-band).
The high quality NIR images reveal that the sources have a mixture of unresolved (MS2137_1, MS2137_2 and A1835_2), galaxy-like (MS2137_3, A2204_1 and A2204_2) and double (MS2137_4 and A1835_1) morphologies.
To investigate the lack of significant spectral features in some sources, we ask the question: how likely is it that an emission line from a Seyfert galaxy at a randomly chosen redshift would be redshifted into the or bandpasses? Fig 1 goes some way in answering this question. Most of the transitions mentioned in the figure are strong lines in Seyfert spectra, and all can easily have an EW greater than our best limiting value of 20Å. There are few regions in redshift space where no redshifted lines are observed in either (or both) of the ISAAC bandpasses. Especially important is the redshift regime , as suggested by recent Chandra and XMM-Newton findings (e.g., Rosati et al. 2001, Brandt et al. 2002, Hasinger 2002). If the sources are at , we would see lines ranging from H6563 to Pa18756. Table 7 lists these lines and their typical strengths. H and [NII] are the strongest expected lines, followed by He I and forbidden transitions of Sulphur.
In summary, at , we would observe H[NII]. Detection of other (typically weaker and/or lower ) lines is also likely, as they have been observed in the literature with large strengths and EW. Thus, although we cannot rule out the possibility that we miss the lines at , we consider alternative possibilities as well.
Early-type galaxies with little on-going star-formation show many absorption features in their spectra (that we would not detect due to signal:noise constraints) but few (if any) emission features. This is especially true for extremely-red objects (EROs). In a sample of ISAAC spectra of galaxies selected for their extremely red colours, Cimatti et al. (1999) found neither strong emission lines nor continuum breaks. While it may be the case that our NIR spectra are dominated by galactic light, the hard X-ray luminosities (assuming redshifts as determined from photometric or spectroscopic constraints) range over erg s-1. The X-rays must, therefore, originate in an active Seyfert-like nucleus, and the absence of any optical/NIR lines associated with the AGN must be accounted for. We consider the possibility that large column density gas and associated dust scatters / absorbs these line photons.
As discussed in section 3, the hard S/H ratios (Table 1) suggest high obscuration of the nucleus. Intrinsic columns below cm-2 will result in S/H ratios which are softer than observed () for all , if . The 6 hard sources must have N cm-2 if at or N cm-2 ( mags assuming a Galactic dust:gas ratio) if at . We note that evidence for such a dusty environment was found for at least one type 2 QSO in the field of A 2390 by Wilman, Fabian & Gandhi (2000) through radiative transfer modelling based on photometric detections in the ISOPHOT mid-IR bands (cf. Crawford et al. 2002). The column density of the gas as inferred by the optical depth of the dust was found to be consistent with the X-ray measurements. A model incorporating dust in narrow-line region clouds was proposed by Netzer & Laor (1993).
The very hard ratio of 0.16 for A2204_1 (a source with high signal:noise featureless continuum) suggests a column cm-2 for all . In fact, extrapolating the de-absorbed flux at 1 keV for a power-law model to -band flux assuming a ‘typical’ quasar broad-band energy distribution (i.e. spectral index; Elvis et al. 1994) implies if A2204_1 lies at , or , if at . For the observed DSS limit of 22.5, this implies at least 2.5 optical magnitudes of extinction to the nucleus.
Compact, very optically-thick obscuration of the kind proposed by Pier & Krolik (1992) will obscure emission from the nucleus itself. If obscuration is in the form of moderately thick tori spread over tens or hundreds of parsecs (Granato, Danese & Franceschini 1994), line emission from star-forming regions could be partially absorbed as well. However, the distinct lack of emission lines (in both the optical and NIR), in these and other recently-found hard X-ray sources, requires covering fractions that are close to 4. As opposed to low-redshift seyferts, obscuration at high redshift would then be mostly independent of orientation. Indeed, large covering fractions (85 percent) have been predicted by Fabian & Iwasawa (1999), by correcting for absorption in the spectrum of the XRB. Forthcoming observations in the far-IR will significantly improve our understanding of the scale and extent of the enshrouding gas/dust distribution (e.g., SIRTF; Brandl et al. 2000).
8 Conclusions
We have obtained VLT ISAAC spectra of 8 Chandra X-ray sources and detect continuum emission from all. These include 7 spectra in the K-band and 4 in J. 6 of these are optically-dim and the remaining 2 are dim in the -band. The X-ray spectral count ratios constrain the obscuring column; 6 sources are very hard with the hardest being consistent with an intrinsic obscuring column density N cm-2. These are typical of the population which contributes the maximum flux per source to the X-ray background.
We have been able to identify 2 narrow-line AGN (one at and one possibly at ; both consistent with luminous Seyfert 2s) and one broad-line AGN possibly at for which intrinsic quasar luminosity is inferred. This includes possible detection of the most distant He I 10830 emission to date. Spectra in other wavebands will help to confirm these. Photometric redshifts have also been determined.
Even in the above long integrations ( 1 or 2 hours long) on an 8-m telescope, we are able to detect significant emission lines in only 3 of the 8 sources and identify the redshift of one of these unambiguously. This extends our previous 4-m UKIRT observations to better equivalent-width limits and confirms our earlier findings that although such sources are readily observed in the near-infrared, detailed identification of the source type is not straightforward. The absence of emission lines in many type 2 AGN, which contribute a large fraction of the XRB intensity, is evidence for high covering fractions of intrinsic obscuring gas.
9 Acknowledgements
The work presented here is based on observations obtained with the Chandra telescope and the VLT. In addition, use is made of archival imaging data from a number of telescopes (the AAT, INT, WHT and CFHT) and the DSS. It is a pleasure to acknowledge the support received from all these organizations in the process of acquiring our data. The eclipse team at ESO is thanked for constant help with ISAAC data reduction. We are grateful to the referee for thorough and constructive criticism. PG would like to thank Andrew Bunker for useful discussions and the Isaac Newton Trust and the Overseas Research Trust for support. CSC and ACF acknowledge financial support from the Royal Society.
Appendix: Notes on sources without significant emission lines
MS2137_2
By an appropriate orientation of the long slit, MS2137_2 (second spectrum from top in Fig 5) was observed simultaneously with MS2137_1. Unfortunately, the only optical photometric data available to us is the DSS, on which, like MS2137_1, the source is invisible. Compared to the deeper ISAAC , and detections of this source, the and the upper-limits are too shallow to obtain a satisfactory photometric redshift solution. The source is very dim and point-like in , with no obvious spectral features down to a 3 limit on the EW of Å.
MS2137_3
MS2137_3 (third K spectrum from top in Fig 5 and top spectrum in Fig 6) is the only source to show an obvious slope in the continuum, which rises gently toward the blue in the K-band and drops suddenly at 2. Though reminiscent of a P-Cygni profile, the proximity of the ‘break’ to the OH emission at 2.0008 as well as the deep telluric absorption strongly suggests that this drop is due to the sky. The signal:noise in the continuum is per pixel, which may also explain the lack of significant absorption features. (The typical depth of such features expected at in the K-band is also about 10 percent of the continuum; e.g., the temple NIR galaxy spectrum of Mannucci et al. 2001)
MS2137_4
MS2137_4 lies in an apparently interacting system (Fig 4) of galaxies with very red colour and diffuse tidal structure in the -band image. Astrometric calibration associates the X-ray source with the fainter, more north-easterly component. The signal:noise in the continuum spectrum (fourth from top in Fig 5) is comparable to that of MS2137_1; however, unlike MS2137_1, we do not detect any emission features, though H would lie in the K-band, if =3.3. The source is then red in due to the -correction of the Lyman break (Fig 8). Due to time constraints, only a 30-minute exposure could be obtained in the J-band (fourth spectrum from top in Fig 6). This is also the faintest J-band source observed spectroscopically, which implies a poor equivalent width lower-limit EWÅ for any real features.
A 2204_1 and A 2204_2
A 2204_1 has a flat, featureless spectrum in both the J and K bands (seventh spectrum from top in Fig 5 and third spectrum from top in Fig 6), despite being the brightest NIR source in our sample (It is also the second brightest and the hardest X-ray source; Fig 3 for the X-ray spectrum). Unfortunately, the ISAAC spectra of this source were observed on a non-photometric part of the night with seeing arcsec, which led to severe degradation of the signal:noise, thus precluding possible identification of absorption features (The 1 photon noise variation is percent of the continuum in the best part of the spectrum close to 2.2). Intriguingly, the blue colour predicts a relatively young system (Fig 8), though we see no emission lines due to young stars. At 3.4 (Table 2), H and the [OIII]4959,5007 doublet are expected to fall in the K-band and Mg II 2797 in the J-band. Note that the K-band morphology clearly indicates an extended source. At , a half-light diameter 7 kpc is implied, which is large; but such large values have been reported in the literature (e.g., Ivison et al. 2001).
A 2204_2 is a soft source (Table 1). It is also at =3.4, since its colours and red limit are similar to A2204_1. A single J-band spectrum only 1-hour long was obtained due to time-constraints and no significant (non-spurious) features are found down to an EW 17Å (fourth spectrum from top in Fig 6).
References
- Antonucci & Miller (1985) Antonucci R.R.J. & Miller, J.S., 1985, ApJ, 297, 621
- Alexander et al. (2001) Alexander D.M., Brandt W.N., Hornschemeier A.E., Garmire G.P., Schneider D.P., Bauer F.E., Griffiths R.E., 2001, AJ, 122, 2156
- Arnaud (1996) Arnaud K.A., 1996, Astronomical Data Analysis Software and Systems V, eds. Jacoby G. and Barnes J., p17, ASP Conf. Series volume 101.
- Baldi et al. (2002) Baldi A., Molendi S., Comastri A., Fiore F., Matt G. & Vignali C., 2002, ApJ, 564, 190
- Barcons et al. (2001) Barcons X. et al., 2002, A&A, 382, 522
- Barcons et al. (2000) Barcons X., Mateos S., Ceballos M.T., 2000, MNRAS, 316, L13
- Barger et al. (2001) Barger A.J., Cowie L.L., Mushotzky R.F., Richards E.A., 2001, AJ, 121, 662
- Bertin & Arnouts (1996) Bertin E. & Arnouts S., 1996, A&AS, 117, 393
- Bolzonella, Miralles & Pelló (2000) Bolzonella M., Miralles J.-M., Pelló, 2000, A&A, 363, 476
- Brandt et al. (2001) Brandt W.N. et al., 2001, AJ, 122, 2810
- Brandt et al. (2002) Brandt W.N., Alexander D.M., Bauer F.E., Hornschemeier A.E., 2002, Philosophical Transactions of the Royal Society (Series A: Mathematical, Physical, and Engineering Sciences), astro-ph/0202311
- Brandl et al. (2000) Brandl B., et al., 2000, ASP Conf. Series “From Darkness to Light”, eds. T. Montmerle, P. Andre, Cargese, astro-ph/0007300
- Bruzual & Charlot (1993) Bruzual G.A. & Charlot S., 1993, ApJ, 405, 538
- Cimatti et al. (1999) Cimatti A. et al., 1999, A&A, 352, L45
- Comastri et al. (1995) Comastri A., Setti G., Zamorani G., Hasinger G., 1995, A&A, 296, 1
- Coleman, Wu & Weedman (1980) Coleman G.D., Wu C.-C. & Weedman D.W., 1980, ApJS, 43, 393
- Cowie et al. (2002) Cowie L.L., Garmire G.P., Bautz M.P., Barger A.J., Brandt W.N., Hornschemeier W.E., 2002, ApJ, 566, L5
- Crawford et al. (2001) Crawford C.S., Fabian A.C., Gandhi P., Wilman R.J., Johnstone R.M., 2001, MNRAS, 324, 427
- Crawford et al. (2002) Crawford C.S., Gandhi P., Fabian A.C., Wilman R.J., Johnstone R.M., Barger A.J., Cowie L.L., 2002, MNRAS, 333, 809
- Devillard (1997) Devillard N., March 1997, ”The eclipse software”, The messenger No 87
- Elvis et al. (1994) Elvis M., Wilkes B.J., McDowell J.C., Green R.F., Bechtold J., Willner S.P., Oey M.S., Polomski E., Cutri R., 1994, ApJS, 95, 1
- Fabian & Iwasawa (1999) Fabian A.C. & Iwasawa K., 1999, MNRAS, 303, L34
- Fabian et al. (2000) Fabian A.C. et al., 2000, MNRAS, 315, L8
- Francis et al. (1991) Francis P.J., Hewett P.C., Foltz C.B., Chaffee F.H., Weymann R.J., Morris S.L., 1991, ApJ, 373, 465
- Gandhi, Fabian & Crawford (2002) Gandhi P., Fabian A.C., Crawford C.S., 2002, Proc. Symposium ”New Visions of the X-ray Universe in the XMM-Newton and Chandra Era”, astro-ph/0201543
- Giacconi et al. (1962) Giacconi R. et al., 1962, PRL, 9, 439
- Giacconi et al. (2002) Giacconi R. et al., 2002, ApJS, 139, 369
- Gilli, Salvati & Hasinger (2001) Gilli R., Salvati M. & Hasinger G., 2001, A&A, 366, 407
- Goodrich, Veilleux & Hill (1994) Goodrich, R.W., Veilleux, S. & Hill G.J., 1994, ApJ, 422, 521
- Granato, Danese & Franceschini (1996) Granato G.L., Danese L. & Franceschini A., 1996, ApJ, 460, L11
- Gruber et al. (1999) Gruber D.E., Matteson J.L., Peterson L.E., Jung G.V., 1999, ApJ, 520, 124
- Halpern, Turner & George (1999) Halpern J.P., Turner T.J., George I.M., 1999, MNRAS, 307, L47
- Hasinger et al. (2001) Hasinger G., 2001, A&A, 365, L45
- Hasinger et al. (2002) Hasinger G., 2002, ESA SP-488, August 2002, ed. F. Jansen, astro-ph/0202430
- Hornschemeier et al. (2001) Hornschemeier A.E. et al., 2001, ApJ, 554, 742
- Iovino (2001) Iovino A., 2001, Jitter and Photometry, available from http://www.eso.org/projects/aot/eclipse/jitterphot/
- Ivison et al. (2001) Ivison R.J., Smail I., Frayer D.T., Kneib J.-P., Blain A.W., 2001, ApJ, 561, L45
- Kron (1980) Kron R.G., 1980, ApJS 43, 305
- Lasker (1988) Lasker B.M., Sturch C.R. et al., 1988, ApJS, 68, 1
- Lehmann et al. (2001a) Lehmann I., Hasinger G., Murray S.S., Schmidt M., 2001a, Proceedings for X-rays at Sharp Focus Chandra Science Symposium, astro-ph/0109172
- Lehmann et al. (2001b) Lehmann I. et al, 2001b, A&A, 371, 833
- Mainieri et al. (2002) Mainieri V., Bergeron J., Rosati P., Hasinger G., Lehmann I., 2002, Proc. Symposium “New Visions of the X-ray Universe in the XMM-Newton and Chandra Era”, astro-ph/0202211
- Mannucci et al. (2001) Mannucci F., Basile F., Poggianti B.M., Cimatti A., Daddi E., Pozzetti L., Vanzi L., 2001, MNRAS ,326, 745
- Marshall et al. (1980) Marshall et al., 1980, ApJ, 235, 4
- Moorwood (1997) Moorwood A. et al., 1997, SPIE, 2871, 1146
- Mushotzky et al. (2000) Mushotzky R.F., Cowie L.L., Barger A., Arnaud K.A., 2000, Nature, 404, 459
- Netzer & Laor (1993) Netzer H. & Laor A., 1993, ApJ, 404, L51
- Nakanishi et al. (2000) Nakanishi, K., Akiyama M., Ohta K., Yamada T., 2000, ApJ, 534, 587
- Norman et al. (2001) Norman C. et al., 2002, ApJ, 571, 218
- Osterbrock (1989) Osterbrock D.E., 1989, Astrophysics of Gaseous Nebulae and Active Galactic Nuclei, University Science Books, Sausalito, CA
- Osterbrock, Shaw & Veilleux (1990) Osterbrock D.E., Shaw R.A., Veilleux S., ApJ, 1990, 352, 561
- Pickles (1998) Pickles A.J., PASP, 110, 863
- Pier & Krolik (1992) Pier E.A & Krolik J.H., 1992, ApJ, 401, 99
- Rosati et al. (2002) Rosati P. et al., 2002, 566, 667
- Rousselot (2000) Rousselot P., Lidman C., Cuby J.-G., Moreels G., Monnet G., 2000, A&A, 354, 1134
- Rudy et al. (1989) Rudy R.J., Cohen R.D., Rossano G.S., Puetter R.C., Chapman S.C., 1989, ApJ, 341, 120
- Setti & Woltjer (1989) Setti G. & Woltjer L., 1989, A&A, 224, L21
- Stark et al. (1992) Stark A.A., Gammie C.F., Wilson R.W., Bally J., Linke R.A., Heiles C., Hurwitz M., 1992, ApJS, 79, 77
- Stern D. et al. (2001) Stern D. et al., 2002, ApJ, 568, 71
- Storchi-Bergmann T. (1991) Storchi-Bergmann T., 1991, MNRAS, 249, 404
- Tennant (1991) Tennant A.F., 1991, The QDP/PLT User’s Guide. NASA Technical Memorandum 4301
- Vanden Berk et al. (2001) Vanden Berk D.E. et al., 2001, AJ, 122, 549
- Veilleux & Osterbrock (1987) Veilleux S. & Osterbrock D.E., 1987, ApJS, 63, 295
- Watson et al. (2001) Watson M.G. et al., 2001, A&A, 365, L51
- Wilkes et al. (2001) Wilkes B.J. et al., 2001, The new era of wide field astronomy, eds. R.G. Clowes, A.J. Adamson, G.E. Bromage, ASP, 232, 47, astro-ph/0011377.
- Willott et al. (2001) Willott C.J. et al., 2001, astro-ph/0105560, Proceedings of the XXI Moriond Astrophysics Meeting: ”Galaxy Clusters and the High Redshift Universe Observed in X-rays”, edited by D. Neumann, F.Durret & J. Tran Thanh Van
- Wilman, Fabian & Gandhi (2000) Wilman R.J., Fabian A.C. & Gandhi P., 2000, MNRAS, 318, L11
- Wilman, Fabian & Nulsen (2000) Wilman R.J., Fabian A.C. & Nulsen P.E.J., 2000, MNRAS, 319, 583
![[Uncaptioned image]](/html/astro-ph/0206433/assets/x25.png)
| Object | RA | DEC | Spectroscopic Observations | Imaging Exposures | ||||
|---|---|---|---|---|---|---|---|---|
| J2000 | J2000 | J (s) | K (s) | Slit PA (∘) | J (s) | H (s) | K (s) | |
| MS2137_1 | 21 40 29.3 | –23 47 39 | – | 6120 | 111.0 | 720 | 600 | 600 |
| MS2137_2 | 21 40 30.8 | –23 47 47 | – | 6120 | 111.0 | 720 | 600 | 600 |
| MS2137_3 | 21 40 12.2 | –23 35 03 | 7200 | 7200 | 113.5 | 900 | 600 | 600 |
| MS2137_4 | 21 39 52.4 | –23 37 38 | 1800 | 7200 | 39.0 | 720 | 600 | 600 |
| A1835_1 | 14 01 06.9 | +02 49 33 | – | 7200 | 90.0 | 540 | 540 | 540 |
| A1835_2 | 14 01 49.9 | +02 48 36 | – | 5400 | 306.0 | 540 | 540 | 540 |
| A2204_1 | 16 32 37.4 | +05 29 42 | 3780 | 7200 | 356.5 | 540 | 540 | 540 |
| A2204_2 | 16 31 58.8 | +05 39 02 | 3600 | – | 47.0 | 540 | 540 | 540 |
The coordinates denote the position measured in the near-IR pre-imaging, which was carried out at the VLT for objects in the field of MS2137, and at UKIRT for the rest of the sources.
The slit position angles are given in degrees east of North.
| Band | UT Date | Telescope & Instrument | Plate Scale | Filters | Seeing | Typical Exposure | mlim |
|---|---|---|---|---|---|---|---|
| (arcsec/pixel) | (arcsec) | (seconds) | |||||
| B | 1993 Aug 12 | AAT Prime Focus | 0.391 | KPNO 1 | 1.3 | 600 | 25.4 |
| R | 1994 Jun 07 | INT Prime Focus | 0.590 | Kitt Peak 3 | 2.8 | 600 | 20.7 |
| R | 1998 Feb 26 | CFHT STIS2 | 0.439 | CFHT #4609 | 1.1 | 600 | 25.5 |
| I | 1993 Aug 12 | AAT Prime Focus | 0.391 | KPNO 3 | 1.0 | 600 | 23.9 |
| I | 2000 May 01 | INT WFC Prime | 0.333 | Sloan i | 2.0 | 1198 | 22.9 |
| J, H, K | 2000 Aug 10/11 | UKIRT UFTI | 0.091 | J98, H98, K98 | 0.6 | 540 | 21.4, 20.7, 20.0 |
| J, H, K | 2001 Jun 28 | VLT ISAAC | 0.148 | J, H, Ks | 0.3 | 600 | 22.6, 21.6, 20.7 |
The last column states the limiting magnitude as defined by 3 times the background sky RMS in a 3 arcsec aperture.
| Source | (filters) | Galaxy Type | Age | MB | |||
|---|---|---|---|---|---|---|---|
| (90 percent interval) | (Gyr) | ||||||
| MS2137_3 | 0.70 (0.6, 0.9) | 2.5 (6) | Burst | 0.7 | 0.6 | -21.7 | 3.7 |
| MS2137_4 | 3.33 (3.1, 3.4) | 2.7 (5) | Burst | 0.3 | 0.0 | -24.6 | 4.1 |
| A 1835_1 | 1.23† (1.0, 1.5) | 8.7 (5) | Burst | 0.4 | 0.2 | -21.5 | 4.6 |
| A 1835_2 | 3.40 (3.0, 4.0) | 5.0 (6) | QSO | – | 0.6 | -25.2 | 3.6 |
| A 2204_1 | 3.40 (3.3, 3.6) | 0.8 (5) | Burst | 0.1 | 0.0 | -27.3 | 0.5 |
| A 2204_2 | 3.39 (2.9, 4.1) | 1.2 (5) | Burst | 0.1 | 0.0 | -26.4 | 0.5 |
The 90 percent confidence interval in parentheses in column 2 assumes .
The ‘filters’ parentheses in column 3 states the number of photometric data points used in the fit.
MB in column 8 is the absolute Vega Magnitude in the B Bessell filter.
The Burst template is a single burst of star-formation at zero age followed by passive evolution.
The QSO template is from Francis et al. (1991).
†With the inclusion of the -flux, HYPERZ prefers this solution to the one inferred by Crawford et al. (2001; based on 4 filters).
| Object | Feature | Width () | FWHM | EW | Flux | Notes | |
|---|---|---|---|---|---|---|---|
| Å | km s-1 | Å | erg s-1 cm-2 | ||||
| MS2137_1 | 2.0846 | 18.5 [17, 20] | U | 240 | 12.8 [12, 14] | H 6563 | |
| 2.0916 | 18.5† | U | 134 | 7.2 [6, 8] | [NII] 6584 | ||
| 2.1355 | 18.5† | U | 134 | 3.9 [2, 6] | [SII] 6717 6731 | ||
| A 1835_1 | 2.4452 | 18.1 [16, 20] | U | 157 | 8.7 [8, 10] | He I10830 | |
| 2.2673 | 20.9 [11, 32] | U | 32 | 1.9 [1, 3] | H I Pa 7 10049 | ||
| A 1835_2 | 2.3480 | 152.5 [134, 176] | 4580 | 207 | 36.9 [33, 41] | H4861 | |
‘U’ in column 3 implies unresolved.
†Velocity width fixed to that of H.
The numbers in square brackets give the 90 percent confidence interval for a single parameter.
Strengths stated in row 3 are for the combined [SII] doublet.
The line width and equivalent-width in the rest-frame will be lower than the above values by a factor of .
| Transition | J | K | I(transition)/I(H) | Reference |
|---|---|---|---|---|
| H6563 | 2.87 | (1) | ||
| [NII]6584 | 2.8 | (2),(1) | ||
| [SII]6731 | 0.5 | Mrk 1073; (3) | ||
| [SIII]9069 | 0.1 | (4),(5) | ||
| [SIII]9531 | 0.25 | (5) | ||
| He I | 0.78 | (3) | ||
| Pa12822 | 0.17 | (1) | ||
| Pa18756 | – | 0.35 | (1) |
Column 4 denotes the intensity with respect to that of H. Any observed reddening has been corrected for. The last column gives the reference for the intensity calculation and/or measurement as follows:
(1) Case B photoionization prediction
(2) Storchi-Bergmann 1991
(3) Rudy et al. 1989
(4) Osterbrock & Veilleux 1989
(5) Goodrich, Veilleux & Hill 1994