Study of Spectral Lag for Short GRBs
Abstract
This paper reports statistically significant correlations between various burst parameters, observed in a sample of 156 GRBs belonging to BATSE 4B catalog with T90 less than 2 s. The number of subpulses in a burst is strongly correlated not only with the object’s duration but also with its fluence and hardness ratio, suggesting that when the central engine is more powerful, ejecting matter with typically higher values of Lorentz factor, the bulk energy is dissipated on longer time scales in the form of larger number of gamma pulses. We estimate hard-to-soft lag in bursts by taking the difference between centroids corresponding to time profiles at energies keV and keV. The number of short GRBs that show soft-to-hard spectral evolution is slightly over one quarter of the total, in the sample considered here.
Bursts that exhibit hard-to-soft spectral change appear to form a distinct class, with strength as well as hardness of individual subpeaks tending to decrease with peak position. Opposite is true for objects with softer photons arriving earlier than the harder ones, implying some kind of a rejuvenation of the central engine (may be due to enhanced accretion of matter towards the end). The two classes also show other diverging trends. For instance, objects belonging to the larger of the two classes display strong correlations between spectral lag and the fluence, the hardness ratio as well as the number of pulse, respectively. While no such correlations are seen in bursts that evolve from soft to hard. However, the magnitude of lag is strongly correlated with burst duration in both the classes.
1 Introduction
More than circumstantial evidence point towards short GRBs forming a distinct subclass of bursts. Bursts with T90 less than 2 s are harder [1] and their fluences are about 20 times weaker than their longer counterparts [2,3]. From the lag obtained by cross correlating TTE data corresponding to 25-50 KeV and 100-300 KeV channels, Norris, Scargle & Bonnell found that GRBs with duration 2.6 s not only exhibit about an order of magnitude lower values of lag than those of long bursts but also these values appear to be discontinuous across 2 s [4]. Another study by Paciesas et al. seems to indicate that the average spectral break energy for short bursts is larger than that of long duration GRBs by a factor of about 2 signifying for the former either larger bulk Lorentz factors or spatially closer location [5].
However, while studying various pulse parameters for a sample of 100 bright short GRBs, McBreen et al. recently concluded that most of the strong correlations observed are similar to those found in the case of long bursts suggesting identical gamma-emission mechanism for both the classes [6]. Absence of directly measured redshifts due to lack of observed optical afterglows in the case of short bursts makes it difficult to verify the lag-luminiosity relation as seen by Norris, Marani & Bonnell in some of the long duration GRBs [7]. Evidently, a lot of work still needs to be carried out in order to properly understand short bursts.
In this paper, we focus on a sample of short bursts belonging to the BATSE 4B catalog. Individual peaks in a burst are identified using a zero crossing algorithm developed by Bhat et al. [8]. A simple measure to characterize lag between hard and soft gamma rays is considered in the present work to study correlations among various burst parameters.
2 Data set and ‘hard-soft’ time lag
We begin with all the category A bursts (defined to be those lying completely within the TTE window) listed in the BATSE 4B catalog with T90 less than 2 s [9]. There are about 182 such objects. Since we require post-burst background with duration equal to that of the actual GRB, for identifying individual pulses in a burst [8,10], the final sample that is subjected to various analysis in this paper consists of 156 objects. For the purpose of peak detection in a burst, TTE data for all the 4 energy channels are combined. Fluence, hardness ratio and T90 along with the respective errors are taken from the available BATSE catalog itself.
If represents the arrival time of photon in the detector then the time-centroid is simply expressed as,
| (1) |
where is the number of photons detected between the starting () and the end () instants of the burst.
Spectral lag, in GRB literature, is usually estimated by cross-correlating time histories of a burst determined at distinct energy bands (e.g. [11,4]). In the present work, we use a simple definition of ‘hard-soft’ time lag for a given burst. This lag is computed by taking the difference between time-centroids obtained from arrival times corresponding to photon energies larger than 100 keV and from those less than 100 KeV, so that
| (2) |
where the subscripts 1,2,3 and 4 represent the four distinct BATSE energy channels. This simple characterization of lag is similar to a definition of energy evolution parameter used by Bhat et al.[8]. A negative value of correspond to harder photons arriving earlier than those with energy 100 keV, and vice versa. As the photon arrival times are recorded with a high resolution of 2 s, the statistical error in the determination of is given by,
| (3) |
which typically is 2 orders of magnitude lower than the arrival time uncertainty.
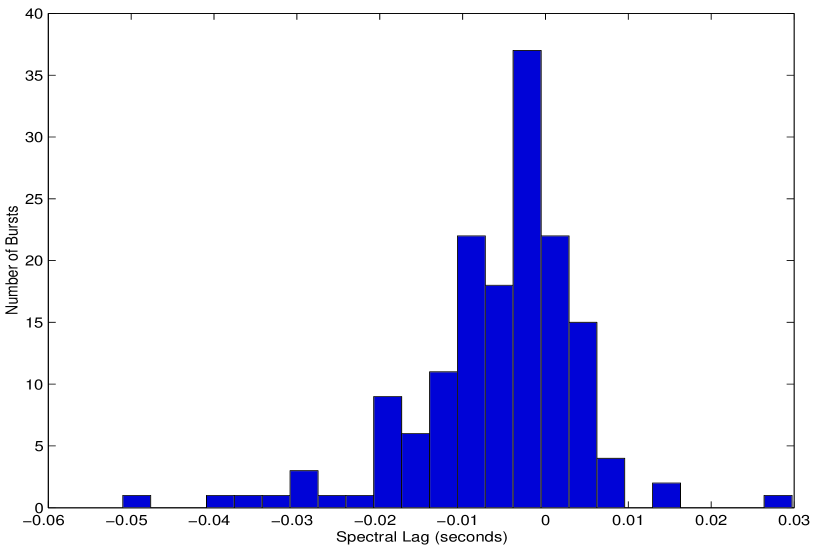
We find 116 short bursts with negative ranging from s (for GRB trigger no.3215) to s (for trigg.no.2395). While rest of the 40 objects exhibit positive values, indicating a soft-to-hard evolution, lying in the interval (s, s) with the boundary points corresponding to trigger no.s 1308 and 1791, respectively. A histogram of for all the 156 bursts is shown in Fig.1. The gross features of the distribution are similar to the ones seen by Norris et al. [4]. Unlike in the case of long bursts where one finds a small fraction (less than 0.1) of sources displaying soft-to-hard evolution [11], the percentage of short GRBs with positive is , which is larger by about a factor of three. Since a substantial number of short bursts appear to undergo soft-to-hard spectral change, we also present many of the significant statistical correlations in the following section separately for and cases, respectively.
3 Burst Parameters and Linear Correlations
Using the peak detection method (for details see [10]), the subpulses present in a burst are identified at an optimum resolution (defined to be the time resolution at which the algorithm returns the largest number of peaks for that burst). Once this is done, the peak position relative to the starting instant of the burst as well as the peak height for each subpulse can be determined. The total number of peaks found in a given burst has been termed as its complexity index (CI) in this paper.
In our sample, we find that the average value of CI is between 2 and 3, with most bursts having fewer than 5 subpulses. There are 45 single peaked GRBs, while only about of the total have CI lying in the range 5 to a maximum value of 8. In contrast, long duration bursts tend to be much more complex with CI usually exceeding 10 [12,13]. Among the short bursts, for both negative as well as positive cases, we find that CI is strongly correlated each with T90, fluence and hardness ratio (HR). Similarly, T90 displays significant correlation with as well as fluence over the entire sample. For all the 156 short bursts, there is also a strong correlation between fluence and HR. The results are listed in table 1, where the correlation coefficients have been computed using the weighted linear correlation analysis (see e.g.[14]).
Weighted correlation incorporates error for each data pair (,),
| (4) |
where and are the errors on and , respectively. For CI, we have set the error to be zero. Whenever variables carry different physical dimensions (like T90 and fluence, for instance), in order that eq.(4) remains meaningful we redefine the quantities by taking ratios of and with and , respectively, where and are the corresponding maximum values in the sample. The redefined variables along with the respective errors are dimensionless, and are therefore amenable to weighted correlation analysis.
For the sample of 156 objects studied in this paper, though T90 information is available for each, the 4B BATSE catalog lists the measured values of fluence and HR for 149 (of which 37 burst have positive ) and 133 (33 objects of these show soft-to-hard evolution) bursts, respectively. These numbers have been used in tables 1 and 2 to compute chance probabilities to check for significant correlations.
It may be appropriate at this juncture to speculate on a general picture of short GRBs that the correlations in table 1 appear to be throwing light on. A central engine which pumps energy into the ambient medium at a variable rate followed by internal shocks developing due to collision of multiple winds is presently the most promising theoretical scenario to describe GRB phenomena [15,16]. In view of such models, the observed strong correlation between CI and T90 appears to suggest that when the central engine is active for a longer duration, the resulting gamma emission is often in the form of several subpulses instead of taking the shape of a broad single peak. Therefore, the result seems to favour a multiple collisions of wind-like ejecta scenario for longer short bursts.
One needs to exercise caution regarding the correlation we observe between T90 and fluence, mainly because of two factors. Firstly, although for the rest of the pairs of burst parameters, the correlation coefficients are large as well as consistent with results presented in table 1, when one carries out a linear correlation analysis without errors, there is a difference in the case of T90-fluence pair. If one considers a linear correlation analysis for this pair without including errors then the coefficient is only 0.05, which is statistically insignificant. However, according to an older study on a sample of 400 GRBs by Lee and Petrosian, longer bursts statistically tend to of higher fluence [17]. So one is tempted to accept the strong correlation we observe in our analysis.
But then, one needs to be careful as another factor comes into the picture. It has been recently pointed out by Hakkila et al. that fluence-duration bias in the BATSE data may cause underestimation of fluence as well as duration for faint GRBs [18]. However, this bias may not cause high fluence, long duration GRBs to appear as low fluence, short and hard bursts [19]. In a sense, it is unlikely that short bursts as a class may get contaminated due to this bias.
Keeping the above discussion in mind, we may proceed with our analysis. It is evident from table 1 that harder the burst, more complex it is. Also, higher the fluence, harder is the burst. In a way these trends are natural, since if the amount of energy released by the central engine is larger then Lorentz factors as well as degree of activity and complex interactions between multiple winds are expected to be higher. Similarly, T90 displays a strong correlation with over the entire sample. We will touch upon this point again when we discuss positive and negative cases as distinct subclasses.
In table 2, we present correlation coefficients separately for bursts showing soft-to-hard and hard-to-soft spectral changes. What is striking is that for negative cases (we define them to be Class A bursts, not to be confused with category A objects of BATSE data [9]), the spectral lag shows a strong anti-correlation with CI, HR as well as fluence. In contrast, no significant correlation is exhibited by the corresponding quantities for bursts with (termed as Class B objects henceforth). Hence, larger the magnitude of lag, higher is CI, HR and fluence in the case of Class A events, while no such trend is seen among Class B bursts. On the other hand, though HR and T90 hardly appear to be correlated among bursts demonstrating hard-to-soft spectral progress, this pair show a strong correlation in the smaller sample of GRBs with reverse evolutionary trend.
Now, between and T90, there is strong statistical anti-correlation (correlation) among Class A (Class B) GRBs. So, what we have here is that irrespective of the sign of the lag, its magnitude is very strongly correlated with duration of bursts of A or B type. This basically reflects the correlation between T90 and presented already in table 1. This feature could be useful in constraining gamma-emission models. In general, one may argue that if the energy injected by the central engine is large then not only the burst duration is expected to be longer but also typical time scale separating high and low velocity wind is likely to be greater.
In the next section, we will encounter further differences between Class A and B sources.
4 Pulse Parameters versus Lag for multi-peaked GRBs
In order to study how peak heights change statistically with peak instants in a burst, we consider a subsample of multi-peaked (CI ) short bursts consisting of 111 objects (of the 156 sources, 45 contain single pulses). There are 80 multi-peaked sources with negative , while rest of the 31 objects are of Class B type. It is interesting to note that only 9 out of 45 single peaked bursts are of Class B type.
For each burst in the subsample, we normalise the peak counts and positions by dividing them with the maximum observed peak height and T90 of that burst, respectively. The correlation coefficient between normalised and for Class A objects is -0.31. As there are a total of 250 pulses for 80 of these GRBs, the chance probability of finding a value of -0.31 if and are uncorrelated is only . On an average, therefore peak height decreases with time for bursts that show hard-to-soft evolution. When a similar exercise is undertaken for 31 multi-peaked Class B bursts, one finds a positive correlation between and . The correlation coefficient turns out to be 0.19 corresponding to a chance probability of 0.05, since the total number of peaks are 107. Although, the correlation is not as strong as in the case of Class A objects, one sees a trend of increasing peak height with time at about 95 percent confidence level.
Of this sample of 111 bursts with multiple pulses, we now consider those objects with well separated peaks. A pulse is defined to be well separated if its height is more than double the value of photon counts of the valley on each side of the peak, after the background counts are subtracted from the time profile (also see [13]). There are 61 such bursts with all peaks well separated according to the above criteria. Of these, 41 short GRBs fall in the category of Class A. Since the pulses have almost well defined beginning and end instants, determined from the position of valleys on either side of the peak maximum, we may estimate the hardness ratio of individual peaks.
The hardness ratio () of a pulse is defined in this paper as the ratio of background subtracted photon number with energy 100 keV counted between the instants and characterising the pulse, and the corresponding number with energy 100 keV. Total number of photons for each peak is estimated by summing the counts in the interval (, ) from all four energy channels. The peak flux corresponding to a pulse is simply the peak height divided by the time resolution. We quantify the symmetry of a pulse profile by taking the ratio,
| (5) |
where and are the time intervals and , respectively, being the time instant at which peak maximum occurs. Similarly, we may also characterize the width of a peak as follows,
| (6) |
In a crude sense, and represent the rise and decay time scales for a pulse. These parameters as well as the definition of symmetry indicator , which rely only on measured quantities in the present work, somewhat differ from the ones we employed in our earlier study that made use of lognormal fitting of pulses [20]. In order to fit subpulses with, say lognormal functions, one requires starting instants of these peaks (see [10]), which in general are rather uncertain. These errors then get carried over to the parameters that are derived from the fits, resulting in large systematic errors, particularly for not so well separated peaks. The rational behind the present direct approach is simply to avoid such systematic errors.
The correlation coefficients along with chance probabilities for various burst parameters and are listed in table 3. Pulse hardness ratio and photon number were normalised by dividing each of them by the respective maximum value in a given burst, while is normalised by taking its ratio with burst duration. We find from the table that while in the case of Class A bursts both hardness ratio and photon number corresponding to individual peaks tend to decrease with peak position, an opposite trend seems to be present in Class B objects. It may be recollected that similar behaviour is exhibited by peak height for 111 multi-peaked bursts.
Class A bursts appear to exhibit some interesting trends like larger the lag (i.e. more negative the ), harder,wider and more asymmetric is the first peak. In the case of Class B sources, as increases the first peak tends to be softer and wider (at 90 confidence level) while its decay time relative to the last peak is larger, although its symmetry has no significant correlation with the lag. Also, for cases, if the first peak is harder it tends to be more symmetric. Whether Class A or B, ratio of of the first peak to last is strongly correlated with corresponding ratios of rise time, decay time and width.
For Class A objects, since peak hardness ratio is anti-correlated with , the preceding sentence points towards a consistent picture in which the first peak is frequently harder and wider relative to the last peak. While, in the case of Class B bursts, more often than not first peaks tend to be relatively narrower, weaker and softer. However, flux and hardness ratio of peaks are strongly correlated in both the groups.
5 Conclusion
Studying bursts with T90 less than 2 s, we observe that irrespective of hard-to-soft evolution or vice-versa, there exists a statistically significant correlation between number of subpulses and burst duration, indicating that if injection of energy from central engine takes place in the form of multiple spurts of wind then longer the activity of the engine, more is the number of shocked shells that give rise to pulses of gamma emission.
If one were to accept a genuine duration-fluence correlation (see the discussion in Sec.3) then from the results listed in table 1 one may sketch a general picture as follows. When total amount of energy available is larger, it is natural for Lorentz factors of ejecta as well as fluence to be greater, providing a plausible explanation for the strong correlation observed between HR and fluence. Then, the T90-fluence correlation appears to indicate that when total energy involved is more in magnitude, instead of an instaneous conversion to gamma photons, it tends to be released and dissipated over a longer time-scale resulting in larger number of pulses as well as higher values of .
We find from tables 2 and 3 that bursts with lag show different behaviour from the ones with . Among the Class A objects, the height, count and hardness ratio of a pulse show strong trend of decreasing with time, which is more or less expected from progressive dissipation of energy. In contrast, the tendency of peak height, number of photons and HR of individual pulses to increase with peak position among Class B bursts seems to suggest that the conversion of available energy into stronger pulses consisting of harder gamma photons takes place during the later part of GRB activity. One may surmise that the central device becomes vigorously active towards the later part before getting switched off completely, possibly due to a delayed accretion of matter on to a compact object that makes up the engine.
It appears to be significant that only one-fifth of the set of single peaked bursts happen to be of Class B type. A flare up of the central source in the later half is likely to give rise to additional pulses of radiation. Hence, in this picture, it is not surprising for CI to be often in Class B category.
Unlike the Class A bursts, the objects with soft-to-hard evolution hardly display any correlation between and fluence, CI and HR, respectively. Moreover, pulse parameters related to , , etc. exhibit dissimilar trends for the two classes. On the whole, we may conclude that the sources demonstrating hard-to-soft spectral decay and those with opposite behaviour form two distinct categories of GRBs.
References
- [1] Kouveliotou,C.,Meegan,C.A.,Fishman,G.J.,Bhat,P.N.,Briggs,M.S.,Koshut,T.M., Paciesas,W.S. and Pendleton,G.N., Ap.J.413,L101 (1993)
- [2] Mukherjee,S. et al., Ap.J.508,314 (1998)
- [3] Panaitescu,A.,Kumar,P. and Narayan,R., astro-ph/0108132
- [4] Norris,J.P.,Scargle,J.D. and Bonnell,J.T.,astro-ph/0105108
- [5] Paciesas,W.S,Preece,R.D.,Briggs,M.S. and Mallozzi,R.S., astro-ph/0109053
- [6] McBreen,S.,Quilligan,F.,McBreen,B.,Hanlon,L. and Watson,D., astro-ph/0112517
- [7] Norris,J.P.,Marani,G. and Bonnell,J.,Ap.J.534,248 (2000)
- [8] Bhat,P.N.,Fishman,G.J.,Meegan,C.A.,Wilson,R.B. and Paciesas,W.S.,AIP Conference Proceedings 307, Second Workshop on Gamma Ray Bursts, Huntsville, 1994,p-197
- [9] ftp://cossc.gsfc.nasa.gov/batse
- [10] Bhat,P.N.,Gupta,V. and Das Gupta,P.,5th Compton Symposium, AIP Conference Proceedings 510, 2000,p-538
- [11] Band,D.L.,Ap.J.486,928 (1997) and the references there in.
- [12] Norris,J.P. et al., Ap.J.459, 393 (1996)
- [13] Quilligan,F. et al., astro-ph/0112515
- [14] Bevington,P.R.,Data Reduction and Error Analysis for the Physical Sciences, McGraw-Hill Book Company, New York, 1969.
- [15] Rees,M.J. and Meszaros,P., Ap.J.430,L93 (1994)
- [16] Fenimore,E.E. et al. Nature 366,40 (1993)
- [17] Lee,T. and Petrosian,V.,Ap.J.474,37 (1997)
- [18] Hakkila,J. et al., in AIP Conf.Proc.526, Gamma Ray Bursts,2000,p-48
- [19] Hakkila,J. et al., in AIP Conf.Proc.526, Gamma Ray Bursts,2000,p-33
- [20] Gupta,V., Das Gupta,P. and Bhat,P.N., in AIP Conf.Proc.526, Gamma Ray Bursts, 2000,p-215
| X | Y | N | Correl. | Chance |
|---|---|---|---|---|
| Coeff. | Prob. | |||
| 156 | 0.59 | |||
| Fluence | 149 | 0.43 | ||
| HR | 133 | 0.49 | ||
| 156 | 0.48 | |||
| Fluence | 149 | 0.43 | ||
| Fluence | HR | 133 | 0.51 |
| 0 | 0 | ||||||
|---|---|---|---|---|---|---|---|
| X | Y | N | Correl. | Prob. | N | Correl. | Prob. |
| CI | 40 | -0.016 | 0.92 | 116 | -0.20 | 0.03 | |
| 40 | 0.56 | .0002 | 116 | -0.52 | |||
| Fluence | 37 | 0.09 | 0.6 | 112 | -0.41 | ||
| HR | 33 | -0.03 | 0.87 | 100 | -0.27 | .006 | |
| HR | 33 | 0.53 | .002 | 100 | 0.09 | 0.2 |
| 0 | 0 | ||||||
| X | Y | Correl. | N | Prob. | Correl. | N | Prob. |
| 0.23 | 69 | .06 | -0.42 | 123 | |||
| 0.3 | 69 | .012 | -0.36 | 123 | |||
| -0.45 | 20 | 0.05 | -0.35 | 41 | 0.02 | ||
| 0.38 | 20 | 0.1 | -0.34 | 41 | 0.03 | ||
| -0.04 | 20 | 0.87 | 0.29 | 41 | 0.07 | ||
| 0.34 | 20 | 0.007 | -0.045 | 41 | 0.74 | ||
| 0.21 | 69 | 0.08 | 0.67 | 123 | |||
| 0.45 | 20 | 0.05 | -0.16 | 41 | 0.32 | ||
| 0.43 | 20 | 0.06 | 0.32 | 41 | 0.04 | ||
| 0.45 | 20 | 0.05 | 0.46 | 41 | 0.002 | ||
| 0.55 | 20 | 0.01 | 0.48 | 41 | 0.001 |