Age, Metallicity and Star Formation History of Cluster Galaxies at 111Based on observations collected at European Southern Observatory (ESO n. 62.O-0369, 63.O-0257, 64.O-0236)
Abstract
We investigate the color-magnitude distribution in the rich cluster AC 118 at . The sample is selected by the photometric redshift technique, allowing to study a wide range of properties of stellar populations, and is complete in the K-band, allowing to study these properties up to a given galaxy mass. We use galaxy templates based on population synthesis models to translate the physical properties of the stellar populations - formation epoch, time-scale of star formation, and metallicity - into observed magnitudes and colors. The distributions of galaxies in color-magnitude space thus map into distributions in the space of physical parameters. This is achieved by means of a statistical procedure which constrains the photometric properties of AC 118 galaxies to reproduce those of a nearby rich cluster once evolved at . In this way we show that a sharp luminosity-metallicity relation is inferred without any assumption on the galaxy formation scenario (either monolithic or hierarchical). Our data exclude significant differences in star formation histories along the color-magnitude relation, and therefore confirm a pure metallicity interpretation for its origin, with an early () formation epoch for the bulk of stellar populations. The dispersion in the color-magnitude diagram implies that fainter galaxies in our sample (K) ceased to form stars as late as , in agreement with the picture that these galaxies were recently accreted into the cluster environment. The trend with redshift of the total stellar mass shows that half of the luminous mass in AC 118 was already formed at , but also that 20% of the stars formed at .
1 Introduction
The color-magnitude relation (CMR) of cluster early-type galaxies has been extensively investigated at to trace their star formation history and hence to constrain their formation epoch (e.g. e.g Kodama & Arimoto 1997, hereafter KA97; Ellis et al. 1997; Gladders et al. 1998; Stanford, Eisenhardt, & Dickinson 1998; Kodama & Bower 2001, hereafter KB01; Smail et al. 2001; van Dokkum et al. 2001).
The most important observational results are: i) the slope of the CMR does not depend on redshift; ii) the optical-NIR rest-frame colors of early-type cluster members become bluer with increasing redshift; iii) the intrinsic scatter in the optical-NIR colors of early-type galaxies is small at all redshifts (e.g. Ellis et al. 1997; Stanford et al. 1998; van Dokkum et al. 1998, 2000; Kodama et al. 2001). These points lead to explain the color-magnitude (CM) sequence as a correlation between galaxy mass and metallicity, while the age of galaxies play only a marginal role, if any (e.g. KA97). Two different scenarios can successfully explain the CMR as function of redshift: the monolithic collapse (e.g. Eggen, Lynden-Bell, & Sandage 1962; Tinsley & Gunn 1976) and the hierarchical merging (e.g. Kauffmann 1996, Kauffmann & Charlot 1998). In the former, the trend of the mass-metallicity sequence is explained by the fact that the more massive galaxies retain supernova ejecta more effectively, resulting in higher metallicities and hence in redder colors for more luminous galaxies (e.g. Arimoto & Yoshii 1987; KA97). The unchanged scatter of the colors of early-type galaxies with redshift indicates either that the galaxies assembled synchronously over redshifts (at least for ) or that they stochastically formed at much earlier times (see Ellis et al. 1997). For what concerns the alternative picture, Kauffmann & Charlot (1998) claimed that the CMR can be reproduced in a hierarchical merging picture, where the more massive/metal-rich ellipticals result from mergers of massive/metal-rich progenitor disk galaxies. In both scenarios the color evolution of early-type cluster galaxies is in agreement with the passive evolution of an old stellar population formed early in the past (see also Stanford et al. 1998; Kodama et al. 1998).
Both the main evolutionary scenarios have to face with the evidence for the presence of a significant population of blue galaxies in rich cluster environments at 0.2, as shown for the first time by Butcher & Oelmer (1978) and has confirmed by several photometric and spectroscopic observations (e.g. Butcher & Oelmer 1984; Couch & Newell 1984; Ellis et al. 1985; Dressler & Gunn 1982; Couch & Sharples 1987, Couch et al. 1994; Dressler et al. 1994). Taking into account a representative sample of the whole cluster population, KB01 re-investigated the photometric Butcher-Oelmer (B-O) effect in distant clusters. They found that the passive evolution of galaxy populations can reconcile the B-O effect with the tight CMR of the Coma cluster. Furthermore, KB01 found that the distribution in the color-magnitude diagrams suggests a scenario where star formation of galaxies accreted by the cluster declines on a 1 Gyr time-scale and it is not sharply truncated by interaction with the cluster environment. In this scenario, the B-O effect depends on the decline of star formation of field galaxies when they are accreted into the cluster and on the decline of the rate of accretion of new galaxies at lower redshifts.
In the present work we will apply the CM diagram to gain insight into the star formation history in the galaxy cluster AC 118 at . We will use population synthesis models in order to describe the observed CM distribution of galaxies in AC 118 in terms of stellar populations parameters. The cluster sample is selected according to the photometric redshift technique, and is complete in K-band, avoiding biases introduced by measuring the blue wavelengths in the cluster rest-frame. The early-type galaxy population in the core of AC 118 was already analyzed by Stanford et al. (1998) who found evidence in favor of the passive evolution scenario. A spectroscopic study of the cluster was performed by Couch & Sharples (1987) and Barger et al. (1996) who claimed for recent ( Gyr) bursts of star formation.
The layout of the paper is the following. In § 2 we describe the sample of galaxies at . In § 3 we introduce the galaxy templates that will be used to interpret the observed photometry in terms of physical properties of stellar populations and we describe our approach. The resulting distribution of the physical parameters is analyzed in § 4, where we also discuss the origins of the CMR and the global star formation history. In § 5 we summarize the main aspects of the work and draw the conclusions. In the following we assume , and . With this cosmology the age of the universe is , and the redshift of AC 118 corresponds to a look-back time of . We verified that changing the cosmology does not affect the results of the present work.
2 The Sample at
The present analysis is based on VRIK photometry for a sample of galaxies in a field of ( at ) centered on the galaxy cluster AC 118. The optical (VRI) data are taken from the catalog in Busarello et al. (2002), which also includes photometric redshifts, while the K-band photometry is described in Andreon (2001). The present sample was selected according to the following criteria: a) galaxies are cluster members according to their photometric redshifts and b) the sample is complete in the K-band. In Figure 1 we compare the distribution of the K-band magnitudes for the 459 member galaxies from Busarello et al. (2002) with the K-band luminosity function of AC 118 by Andreon (2001), obtained by statistically subtracting field counts. The Figure shows that the trend of our counts and the luminosity function of AC 118 are consistent down to , suggesting, therefore, that the sample of member galaxies is fairly complete down to this limit. This leads to a final sample of galaxies brighter than . In order to quantify the field contamination in the redshift range adopted to select cluster members (i.e. ), we note that the field population at is dominated by late-type galaxies bluer than , and therefore, the field contaminants in our sample are expected to be brighter than . According to the Canada France Redshift Survey (Lilly et al. 1995), we expect galaxies down to in the cluster area and redshift range, amounting to of the galaxies in the final sample. Since this estimate is an upper limit of the number of field contaminants, we conclude that foreground/background contamination is not statistically relevant to the present analysis.
The color indices were measured within a fixed circular aperture of diameter ( at ). In the following, we will also use the colors derived by Bower, Lucey, & Ellis (1992a) for galaxies in the Coma cluster within an aperture of , which corresponds to kpc. Since galaxies are known to have internal color gradients, a suitable comparison between different redshifts must take into account the physical size of the aperture within which galaxy colors are derived. However, as shown by Kodama et al. 1998 (see their Figure 3), the correction from the aperture to the aperture turns out to be negligible for the Coma galaxies.
In order to estimate the total magnitude, we used adaptive apertures of radius , where is the Kron radius (see Kron 1980). We chose , for which the Kron magnitude is expected to enclose of the total flux of the object (see Bertin Arnouts 1996), and to correct for this factor, we added to the Kron magnitudes the term . Since the bright cluster galaxies have extended halos222High values of the Sersic index ., the estimate of the total magnitude requires a large extrapolation of the light profile. To account for this fact, it is necessary to correct the Kron magnitudes of the brightest galaxies. To this aim, we compared the values with those derived by the two-dimensional fit of the surface brightness distribution for the subsample of galaxies analyzed in La Barbera et al. (2002). The comparison is shown in Figure 2 as a function of . We found that the Kron magnitude underestimates the galaxy luminosity for values of brighter than . The trend in Figure 2 is described by the relation (), that was used to correct the values of for each galaxy in our sample.
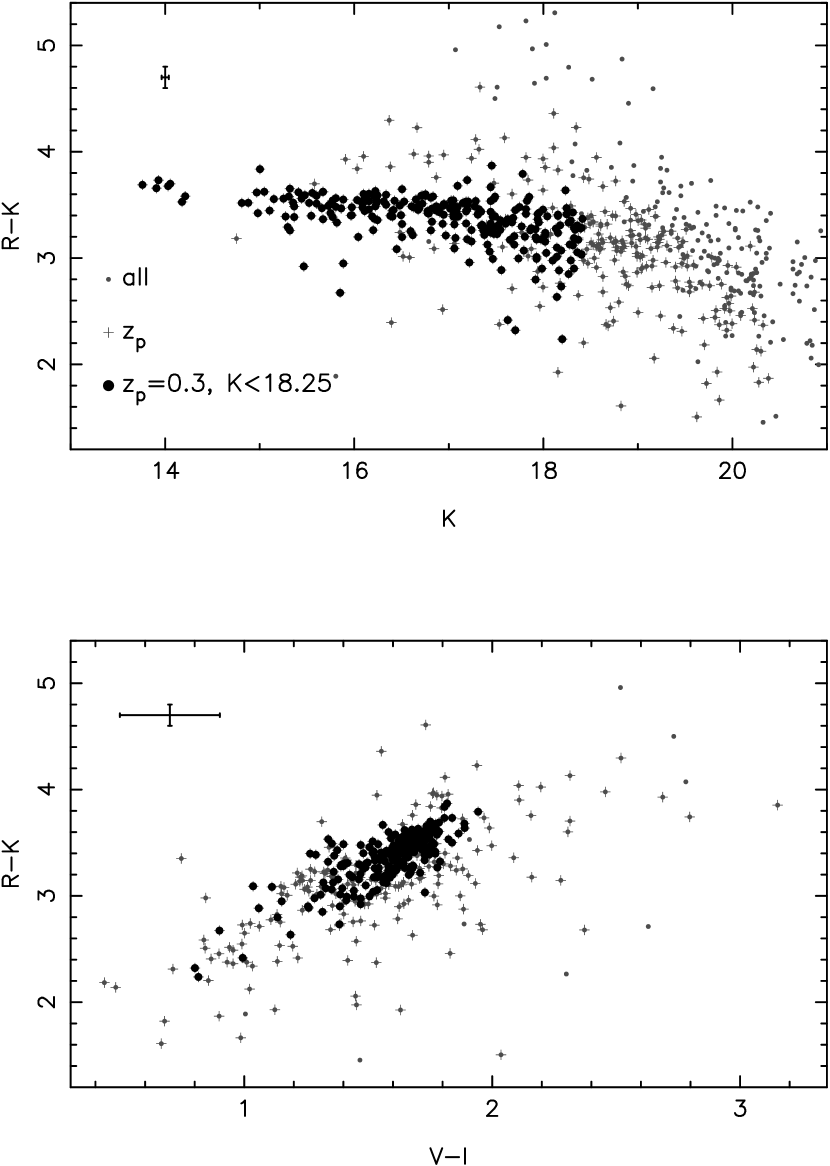
In Figure 3 we show the CM distributions of 1) all the galaxies in the K-band field, 2) the galaxies with available photometric redshift and 3) the galaxies of the sample considered in the analysis.
3 Modelling the Evolution of Stellar Populations
Our goal is to fit the colors and magnitudes of galaxies in AC 118 by imposing that their evolution at reproduces the properties of the CM diagram of a nearby galaxy cluster. To this aim, we use stellar population models at different evolutionary stages.
Since AC 118 is a rich, Coma-like, cluster with high X-ray luminosity, the properties of its galaxy population have to be compared with those of galaxies in a rich cluster at . The sample of galaxies at covers the central cluster region (), which corresponds to an area of radius . In this region, rich nearby clusters are very similar in their photometric properties. The galaxy population is dominated by early-type galaxies which follow a tight CM relation (see Bower et al. 1992a, Bower, Lucey, & Ellis 1992b), with few percents of galaxies having bluer colors (see Butcher & Oemler 1978). Therefore, we can constrain the properties of the galaxies using only the overall features of the CM diagrams at , without comparing the properties of AC 118 galaxies with those of a specific nearby cluster.
We describe the stellar populations in terms of their formation epoch , time scale of star formation and metallicity . We do not assume any a priori probability distribution of , but instead we derive it by comparison of a set of model (template) galaxies with the observed CM distributions.
3.1 Galaxy templates and the constraints at
The galaxy templates were obtained by the GISSEL98 synthesis code of Bruzual & Charlot (1993). Each template is defined by the three physical parameters , and . The code allows to build galaxy templates with metallicity in the range 0.0001 – 0.1 333With intermediate values . and predicts the template properties at 220 steps in age ranging from to . The star formation rate is chosen in the form , with in the range 0.01 – 15.0 Gyr, with a Scalo (1986) initial mass function. For each value of in the grid of input parameters, we computed the magnitudes in the V-, R-, I- and K-band. For all other values of , the magnitudes were derived by interpolation.
Since the magnitudes of the GISSEL98 templates are arbitrarily normalized to one solar mass, they are defined within an additive term, and therefore they cannot be directly compared to the observed magnitudes. We derived the additive term by using the properties of the CM distribution at . To this aim, for each template we computed the color at and compared the template magnitude in the K-band with that expected for a galaxy in a rich nearby cluster with the same color. We used the () CM distribution at because i) the CM relation in the () plane has well known properties (Bower et al. 1992a, Bower et al. 1992b) and ii) the V- and K-band at correspond approximately to the same rest-frame of R- and K-band444The K-band at matches the H-band rest-frame. However, the color is almost independent of the galaxy spectral type, and therefore the difference between the K- and the H-band rest-frame magnitudes is not relevant for the present analysis. at .
In order to derive the magnitude expected for a galaxy at with a given color, we took advantage the following properties of galaxies in the Coma cluster.
1–Red sequence. To describe the () red sequence, we used of the CM relation by Bower et al. (1992a):
| (1) |
The intrinsic dispersion of this relation is mag along the color direction.
2–Blue galaxies. We described the distribution of galaxies below the red sequence by using the properties of the CM diagram for the Coma cluster recently studied by Terlevich, Caldwell, & Bower (2001). The sample is complete down to ( for E/S0 templates at ), that corresponds approximately to the completeness limit of AC 118 evolved to . In Figure 5 of Terlevich et al. (2001) we notice that most of the objects within the completeness limit follow a tight CMR, while a small fraction of Sp/Irr galaxies () are located in a rectangular region with () and with significantly bluer colors () with respect to the red sequence.
3–Luminosity function. We adopted the luminosity function (LF) in the K-band for the Coma cluster. To this aim, we used the H-band LF by de Propris et al. (1998) and Andreon & Pelló (2000) for the central regions of the Coma cluster, corrected (see note 4) by the color term .
Each template describes either i) a galaxy of the red sequence, or ii) a blue (Sp/Ir) galaxy if it lies below the CM sequence of Eq. 1. In case i), the K magnitude is obtained by a normal deviate of width , where is the slope of the () CM relation (see point 1), while in case ii) the magnitude is obtained by a uniform distribution with extremes K=11.5 and K=13 (see point 2). In both cases, the magnitudes were extracted by the adopted distributions (normal or uniform), using as weighting factor the K-band LF at (see point 3).
The magnitudes of each template at were corrected by taking into account the corresponding additive terms and the luminosity distance term relative to the redshift of AC 118.
3.2 The fitting procedures
For each galaxies in AC 118, we derived the ‘best’ values of by two different fitting procedures. In case a), we obtained by minimizing for each galaxy the distance of the models from the observed point in color-color space at , that is by minimizing the function:
| (2) |
where the subscript denotes the galaxies of the AC 118 sample, while the subscript refers to the photometric quantities of the templates, which are functions of , and . In this case, the choice of the best templates depends only on the photometric properties of galaxies at without any constraint at . We point out that this procedure is completely independent of the photometric properties of the local cluster.
In case b) the ‘best’ values of were obtained by minimizing the function:
| (3) |
In this case the choice of is also driven by the template K-band magnitudes, which were scaled as described in the previous section. In such a way, we are constraining the template of each galaxy in AC 118 to occupy the red sequence locus or the region populated by blue galaxies (points 1 and 2 of Section 3.1) when evolved to . This constrains, therefore, AC 118 to belong to the same evolutionary sequence of a rich nearby cluster. We point out that this procedure does not imply that the set of N=252 best fitting templates of AC 118 galaxies, when evolved to , reproduces a CM diagram with the same properties of that observed for a nearby rich cluster, i.e. the slope and the intrinsic scatter of the CM relation, the fraction of blue galaxies and the LF. In fact, our unique constraint is that each template is bounded by the same region of galaxies in the CM diagram at . This point will be further discussed in Section 5.
To account for measurement errors, the fitting procedures were iterated by shifting colors and magnitudes of galaxies in AC 118 according to their photometric uncertainties555The shifts were assigned by taking into account also the correlation between the measurement errors on colors and magnitudes.. In this way, for each iteration we obtained a distribution of ‘best’ parameters which describes the photometric properties of all the galaxies in our sample at . Since the distributions of coming from the different iterations are practically identical, in the following we will discuss the results by averaging the properties of the different distributions of ‘best’ parameters.
4 Ages, Star Formation Rates and Metallicities
In Figure 4 we compare the distributions in the CM space of the best fitting templates obtained according to case b) of Section. 3.2 with those of the sample at and with the CM distributions expected for a nearby rich cluster. This local sample is obtained by using the same recipe used for deriving the additive terms of galaxy templates in Section. 3.1. First, we generated a set of magnitudes according to the Coma K-band LF (see point 3 of Section. 3.1). Then we assigned to each magnitude a color according to the CMR of the Coma cluster (see point 1 of Section. 3.1) and by imposing that the number of blue galaxies in the CM plane amounts to (see point 2 of Section. 3.1).
In Figure 4, the distributions of the model match those observed for AC 118, with the exception of few points whose colors are too red with respect to the templates. In order to address this problem, we introduced a red envelope of the CMR of AC 118, defined as the locus in the plane () corresponding to the reddest stellar populations among the considered templates (cfr. KB01). To this aim, we considered simple stellar populations with formation epoch equal to the age of the universe and different metallicities. It turns out that of the galaxies in AC 118 are located above the red envelope. Six objects deviate by more than , while the photometric errors are not large enough to explain this difference. We will come back to this point at the end of Section 4.4.
When evolved to z0, the CM distribution of the best models for AC 118 gives a reliable description of the CM distribution of the local simulated sample: most of galaxies follow a tight CMR with slope and scatter consistent with those of the CMR of Coma, while few galaxies (4%) lie in the blue-faint area of the CM diagram. It is worth to be noticed that the derived luminosity function also matches that of the Coma cluster.
4.1 Distributions in the Parameter Space
In order to analyze the allowed ranges of physical parameters, we compare the distributions of obtained in case a), by considering only the sample at , and in case b), by considering the properties of both the distant sample and a nearby rich cluster, as discussed in the Section. 3.2.
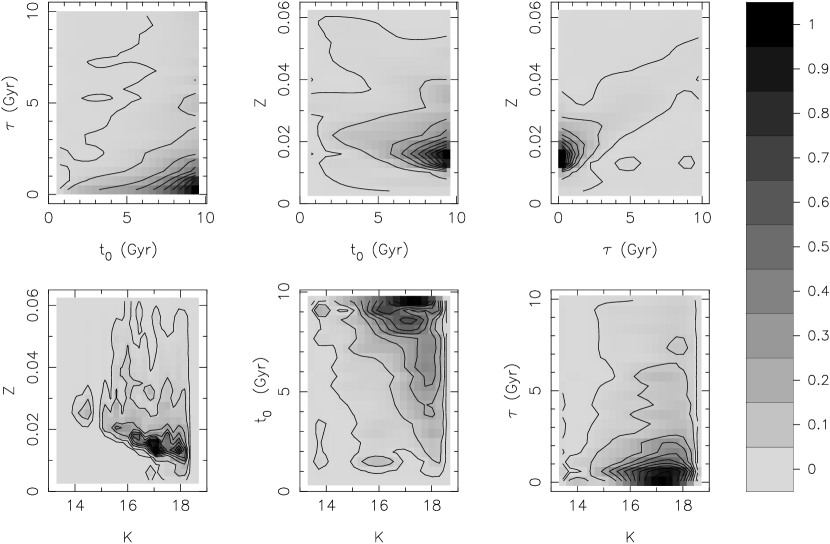
In Figure 5 we show the frequency distributions relative to case a) in all the planes that can be constructed from the quantities , where both and refer to . Figure 5 clearly shows the well known age–metallicity degeneracy for which the photometric properties of older (younger) stellar populations are equivalent to those of the more metal rich (poor) ones. This is particularly evident in the upper middle and lower left panels as indicated by the elongation of the contours and from the fact that very extended regions of the parameter space are populated.
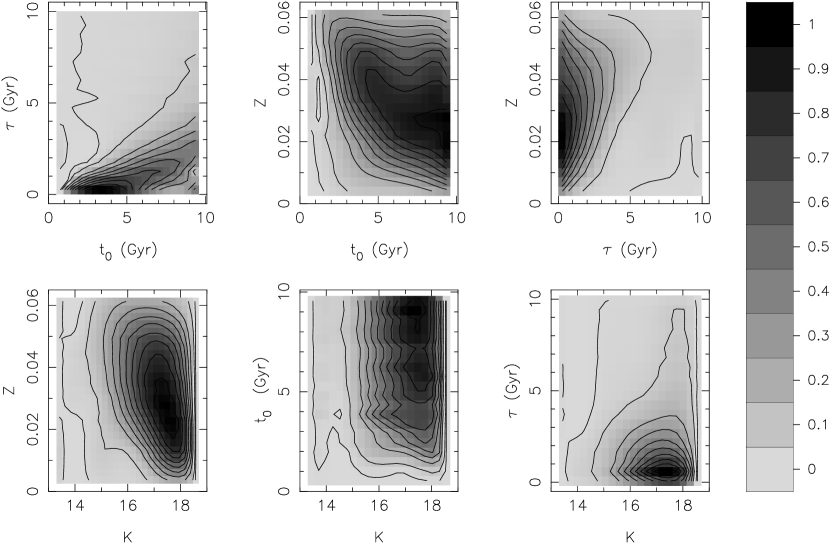
The most remarkable feature that arises from the comparison of the cases a) and b) is the segregation in the space of parameters obtained by constraining AC 118 to belong to the same evolutionary sequence of the local cluster. Figure 6 shows that a large fraction () of the points are constrained to the region , and . The constraints at produce a sharp metallicity sequence in the plane (,), constraining brighter galaxies to have higher values of . It is also interesting to notice that about of the templates are not constrained to follow a tight luminosity–metallicity relation, but are described by higher values of the metallicity. A deeper inspection of Figure 6 shows that these objects are mostly found in the region and (formation redshift ). Moreover, they do not show any significant difference in their photometric properties with respect to the other points of the model.
4.2 Origins of the Color-Magnitude Relation
KA97 and Kodama et al. (1998), by means of a population synthesis code that accounts for chemical evolution in a self-consistent manner (Arimoto & Yoshii 1987), proved that the small evolution of the CMR with look-back time constrains this relation to be a metallicity-luminosity sequence. In Figure 7 (upper panel) we compare the relation between the luminosity-weighted mean stellar metallicity and the absolute V-band magnitude at given by KA97 (see their Table 2), with the same relation for our models. The points of the models were binned in the plane (,) with respect to V-band magnitudes and the biweight estimator (e.g. Beers, Flynn & Gebhardt 1990) was applied to derive the location of the peak of the metallicity distribution at a given magnitude. Absolute magnitudes were computed by a distance modulus for the Coma cluster of (see KA97). It is evident that the observed trend is fully consistent with the findings of KA97. By using a least squares analysis, we find:
| (4) |
In order to investigate possible variations with luminosity of the age of galaxies, we derive the relation between magnitude and formation redshift for the objects that lie within of the metallicity–luminosity relation. This distribution is shown in Figure 7, bottom panel. The formation epoch does not change along the sequence, and is constrained to be greater than at the confidence level of .
4.3 The Scatter of the Color Magnitude Relation
So far, we have not yet discussed the constraints set by the present analysis on the origin of the dispersion in the CMR. To this aim, we computed for each galaxy the age at which a given fraction of its stellar mass formed. The parameter is given by the following combination of and :
| (5) |
In Figure 8 we plot the mean value of (expressed as redshift ) as a function of the K-band magnitude at , and the relative percentiles of and (corresponding to a interval for a normal deviate). We chose , that corresponds to the age at which galaxies formed of their stellar mass, and included only the points within the metallicity sequence. For , the value of is greater than for almost all the points in the model, while it decreases progressively at fainter magnitude. At () the redshift at which some galaxies ceased to form most of their stars can be as low as . On the contrary, the templates that lie outside the metallicity sequence have larger values of , and therefore describe objects with a more recent star forming activity. By applying Eq. 5, we find that all these objects did not complete to form their stars at .
4.4 Global Star Formation History
Finally we consider the global formation history of the stellar populations in the galaxies of AC 118. In Figure 9 we show, as a function of redshift, the total (cumulative) stellar mass already formed at a given epoch in cluster galaxies. The function was obtained by summing the K-band luminosity-weighted mass already formed at a given redshift . Most of the luminous mass () present in the cluster at was formed at although star formation continued at for of the stars.
As noticed in previous studies (e.g. Poggianti et al. 1999, KB01), a crucial role in estimating the star formation rate of cluster galaxies can be played by the dust absorption. To investigate this subject, we construct a simple model by assuming that all galaxies redder than the red envelope of AC 118 are obscured by a uniform screen of dust. We use the differential dust extinction law introduced by Seaton (1979) and adopt a color excess value . Therefore, the intrinsic magnitudes and colors of the templates are transformed according to the equations and . In Figure 10 we compare the CM diagram of AC 118 with the corresponding distribution of templates obtained by including the dust effect in the model. As can be seen, all the galaxies of AC 118 are properly represented by the model, including the red outliers of the CM envelope. These objects are described by dusty blue spirals with extensive on-going star formation activity. As a consequence, about (instead of ) of stars formed at in this model, while the cumulative mass function decreases at higher redshifts (see the dotted line in Figure 9). We note that, if the red outliers are actually blue dusty spirals, the adopted value for the color excess corresponds to the minimum contribution of the dust.
5 Discussion and conclusions
We have studied the star formation history of galaxies in the rich cluster AC 118 at redshift by constraining their photometric properties to reproduce, once evolved at , those of a local rich cluster. The analysis is based on a large wavelength baseline including accurate VRIK photometry for a large sample of cluster galaxies (N=252). The sample was selected by the photometric redshift technique and is complete in the NIR, thus reducing possible biases towards objects with more recent/intense star formation activity.
One of the main current issues in the comparison of the properties of local and intermediate–redshift clusters concerns the selection criteria of the samples. Studies of the CM relation based on pure morphological selection can be biased towards the older progenitors of nearby early-type galaxies (see van Dokkum et al. 2000 for a detailed discussion). On the other side, the application of a statistical field subtraction approach requires a wide area around the cluster field to be observed, while the use of a spectroscopically selected sample at faint luminosities is very expensive in terms of observing time (but not impossible, see Abraham et al. 1996; van Dokkum et al. 2000). The main advantage of a selection based on photometric redshifts is that it allows to estimate the typical luminosity-weighted formation epoch of a stellar population irrespective of the past history of the host galaxy (such as, for example, clustering through a merging hierarchy), and it is therefore an ideal tool to define cluster membership for large samples of galaxies without any tie to a particular scenario of galaxy formation.
A more tricky point is represented by the areas of the clusters to be compared at different redshifts. In a hierarchical clustering picture, clusters of galaxies are likely to accrete a significant fraction of their population from the field even at relatively modest redshifts (, see Kauffmann 1996). As a consequence, cluster richness tends to increase with time, while the population accreted at an old epoch becomes concentrated in a progressively smaller area (see e.g. KB01). On the other hand, the cores of rich nearby clusters are very similar in their photometric properties: the galaxy population is dominated by E/S0 galaxies with few Sp/Irr having bluer colors. Moreover, early-type galaxies seem to follow a universal well defined CM relation (see Bower et al. 1992a, Bower et al. 1992b). For such reasons, we have analyzed the constraints on the properties of the stellar populations of the galaxies in AC 118 by imposing that their evolution at mimics the overall distribution in the () plane for a local rich cluster.
With the aim of constraining the galaxy evolution scenarios, several studies have adopted a purely parametric approach, by comparing the observed properties in the CM diagram with those predicted by models that are based on different sets of parameters and that explore different assumptions on the probability distributions of such parameters. These studies also assume that the scatter in the CM diagram arises merely from age (but see Ferreras, Charlot, & Silk 1999). Although the first epoch of star formation for the cluster early-type population seems to be constrained to high redshifts for almost all such models, further properties, as the last epoch and the spread of star formation activity, are more model dependent.
The procedure we adopted describes each galaxy of AC 118 by a stellar population model, which is constrained, when evolved to , to be bounded by the red sequence locus or by the region of blue galaxies of a rich nearby cluster (see Section 3.1). This is achieved by a suitable procedure which scales the magnitudes of the galaxy templates. We find that the best fitting models of AC 118 galaxies are able to match both the distributions in the () and (,) planes at , and the properties of the () color-magnitude distribution at , i.e. slope and intrinsic scatter of the CM sequence, fraction of blue galaxies and luminosity function. It is important to notice that such a result is not implicit in the method we used to scale the template magnitudes (see Section 3.2).
The constraint at largely reduces the region of input parameters available to the model. In particular, a sharp sequence arises in the metallicity-luminosity diagram (cfr. lower left panels of Figures 5 and 6), for which brighter galaxies are described by higher values of . The slope of the sequence is in full agreement with that derived by KA97 in the framework of the monolithic collapse/galactic wind model. It is interesting to notice that if we adopt the luminosity–weighted mean stellar metallicity of the KA97 models, the zero-points of the relations also coincide. The main difference between the results of KA97 and those of the present work is that we do not obtain the metallicity sequence on the basis of a particular galaxy evolution scenario.
The present data seem to exclude significant variations of star formation history along the CMR, and therefore confirm a pure metallicity interpretation, in which the bulk of the populations formed at high redshift (). These results, however, do not describe the properties of all the stellar populations in AC 118: we find that about of the points of our model do not follow any metallicity–luminosity relation, but are characterized by higher values of Z and more prolonged star formation activity (). Since these objects do not show peculiar photometric properties in the colors-magnitude space, this result could be the consequence of a residual age–metallicity degeneracy. However, other possibilities can be explored. For instance, the scatter of the CM relation at a given luminosity could be partly due to the fact that more recently assembled galaxies have higher metallicity than older systems of similar luminosity (see Ferreras et al. 1999).
To study the dispersion in the CM diagram at , we computed the epoch at which galaxies completed to form of their stars. While for the corresponding redshift is greater than , at faintest magnitudes () we find that some galaxies ceased to form stars at epochs as low as . These results are in agreement with the general picture that fainter galaxies were more recently accreted from the field to the cluster environment and therefore ceased to form stars at later epochs (see KB01 for a wide discussion).
One half of the luminous mass present at formed at , and star formation continued at for of the stars. This result changes if we are neglecting the effect of the dust obscuration in a significant fraction of cluster galaxies. To investigate this subject, we adopted a simple model in which all the galaxies redder than the CM envelope at are obscured by a uniform screen of dust. The introduction of this model is also supported by the presence of few galaxies of AC 118 whose R-K color is too red with respect to the CMR. These objects may be accounted for as dusty galaxies with extensive on-going star formation activity (cfr. KB01). In the model with dust, the fraction of mass that forms at increases from to .
References
- Abraham et al. (1996) Abraham, R.G., van den Bergh, S., Glazebrook, K., Ellis, R.S., Santiago, B.X., Surma, P., & Griffiths, R.E. 1996, ApJS, 107, 1
- Andreon & Pelló (2000) Andreon, S., & Pelló, R. 2000, A&A, 353, 479
- Andreon (2001) Andreon, S. 2001, ApJ, 547, 623
- Arimoto & Yoshii (1987) Arimoto, N., & Yoshii, Y., 1987, A&A, 173, 23
- Barger et al. (1996) Barger, A.J., Aragón-Salamaca, A., Ellis, R.S., Couch, W.J., Smail, I., & Sharples, R.M. 1996, MNRAS, 279, 1
- Bertin & Arnouts (1996) Bertin, E., & Arnouts, S. 1996, A&AS, 117, 393
- Beers et al. (1990) Beers, T.C., Flynn, K., & Gebhardt, K. 1990, AJ, 100, 32
- Bower et al. (1992a) Bower, R.G., Lucey, J.R., & Ellis, R.S. 1992a, MNRAS, 254, 601
- Bower et al. (1992b) Bower, R.G., Lucey, J.R., & Ellis, R.S. 1992b, MNRAS, 254, 589
- Bruzual & Charlot (1993) Bruzual, G.A., & Charlot, S. 1993, ApJ, 405, 538
- Busarello et al. (2002) Busarello, G., Merluzzi, P., La Barbera, F., Massarotti, M., & Capaccioli, M. 2002, A&A, 389, 787
- Butcher & Oelmer (1978) Butcher, H., & Oelmer, A. 1978, ApJ, 219, 18
- Butcher & Oelmer (1984) Butcher, H., & Oelmer, A. 1984, ApJ, 285, 426
- Couch & Newell (1984) Couch, W.J., & Newell, E.B. 1984, ApJS, 56, 143
- Couch & Sharples (1987) Couch, W.J., & Sharples, R.M. 1987, MNRAS, 229, 423
- Couch et al. (1994) Couch, W.J., Sharples, R.M., Ellis, R.S., &, Smail, I. 1994, ApJ, 430, 121
- de Propris et al. (1998) de Propris, R., Eisenhardt, P.R., Stanford, S.A., & Dickinson, M. 1998, ApJ, 503, 45L
- Dressler & Gunn (1982) Dressler, A., & Gunn, J.E. 1982, ApJ, 263, 533
- Dressler et al. (1994) Dressler, A., Oelmer, A., Butcher, H., & Gunn, J.E. 1994, ApJ, 430, 107
- Eggen et al. (1962) Eggen, O.J., Lynden-Bell, D., & Sandage, A.R. 1962, ApJ, 136, 748
- Ellis et al. (1985) Ellis, R.S., Couch, W.J., MacLaren, I., & Koo, D.C. 1985, MNRAS, 217, 239
- Ellis et al. (1997) Ellis, R.S., Smail, I., Dressler, A., Couch, W.J., Oemler, A.Jr., Butcher, H., & Sharples, R.M. 1997, ApJ, 483, 582
- Ferreras et al. (1999) Ferreras, I., Charlot, S., & Silk, J. 1999, ApJ, 521, 81
- Gladders et al. (1998) Gladders, M.D., Lopez-Cruz, O., Yee, H.K.C., & Kodama, T. 1998, ApJ, 501, 571
- Kauffmann (1996) Kauffmann, G. 1996, MNRAS, 281, 487
- Kauffmann & Charlot (1998) Kauffmann, G., & Charlot 1998, MNRAS, 294, 705
- Kodama & Arimoto (1997) Kodama, T., & Arimoto, N. 1997, A&A, 320, 41 (KA97)
- Kodama et al. (1998) Kodama, T., Arimoto, N., Barger, A.J, & Aragón-Salamanca, A. 1998, A&A, 334, 99
- Kodama & Bower (2001) Kodama, T., & Bower, G. 2001, MNRAS, 321, 18 (KB01)
- Kodama et al. (2001) Kodama, T., Smail, I., Nakata, F., Okamura, S., & Bower, R. G. 2001, ApJ, 562, 9L
- Kron (1980) Kron, R.G. 1980, ApJS, 43, 305
- La Barbera et al. (2002) La Barbera, F., Busarello, G., Merluzzi, P., Massarotti, M. & Capaccioli, M. 2002, ApJ, 571, 790
- Lilly et al. (1995) Lilly, S.J., Tresse, L., Hammer, F., Crampton, D., & Le Fèvre, O. 1995, ApJ, 455, 108
- Poggianti et al. (1999) Poggianti, B.M., Smail, I., Dressler, A., Couch, W.J., Barger, A.J., Butcher, H., Ellis, R.S., & Oemler, A.Jr. 1999, ApJ, 518, 576
- Scalo & (1986) Scalo, J.M. 1986, Fundamentals of Cosmic Physics, 11, 1
- Seaton (1979) Seaton, M.J. 1979, MNRAS, 187,73
- Smail et al. (2001) Smail, I., Kuntschner, H., Kodama, T., Smith, G.P., Packham, C., Fruchter, A.S., & Hook, R.N. 2001, MNRAS, 323, 939
- Stanford et al. (1998) Stanford, S.A., Eisenhardt, P.R.M., & Dickinson, M. 1998, ApJ, 492, 461
- Terlevich et al. (2001) Terlevich, A.I., Caldwell, N., & Bower, R.G. 2001, MNRAS, 326, 1547
- Tinsley & Gunn (1976) Tinsley, B.M., & Gunn, J.E. 1976, ApJ, 203, 52
- van Dokkum et al. (1998) van Dokkum, P.G., Franx, M., Kelson, D.D., Illingworth, G.D., Fisher, D., & Fabricant, D. 1998, ApJ., 500, 714
- van Dokkum et al. (2000) van Dokkum, P.G., Franx, M., Fabricant, D., Illingworth, G.D., & Kelson, D.D. 2000, ApJ, 514, 95
- van Dokkum et al. (2001) van Dokkum, P.G., Stanford, S.A., Holden, B.P., Eisenhardt, P.R., Dickinson, M., &Elston, R. 2001, ApJ, 552, 101L