Parkes H I observations of galaxies behind the southern Milky Way.
As part of our program to map the large-scale distribution of galaxies behind the Milky Way, we used the Parkes 210 ft (64 m) radio telescope for pointed H I observations of a sample of low surface-brightness (due to heavy obscuration) spiral galaxies selected from the deep optical Zone of Avoidance (ZOA) galaxy catalog in the Hydra/Antlia region (Kraan-Korteweg 2000a). Searching a simultaneous velocity range of either 300 to 5500 km s-1 or 300 to 10 500 km s-1 to an rms level of typically m Jy resulted in detections in 61 of the 139 pointings, leading to a total of 66 detections (an additional detection was made in a reference position, and two other pointings revealed two and four independent signals respectively). Except for 2 strong H I emitters identified in the shallow Zone of Avoidance H I survey (Henning et al. 2000), all H I detections are new. An analysis of the properties of the observed and detected galaxies prove that pointed H I observations of highly obscured galaxies allow the tracing of a population of nearby, intrinsically large and bright spiral galaxies that otherwise would not be recovered. The new data identified a previously unrecognized nearby group at km s-1, the continuation of the Hydra/Antlia filament on the opposite side of the Galactic plane, and helped to delimit a distinct void in the ZOA centered at 2000 km s-1.
Key Words.:
catalogs – surveys – ISM: dust, extinction – galaxies: fundamental parameters – Radio lines: galaxies cosmology: large-scale structure of the Universe1 Introduction
Until recent years, galaxy surveyors have avoided the difficult territory of the Milky Way. Great strides toward filling in the low-galactic-latitude gap in our knowledge of the galaxian distribution have been made by optical, radio, near- and far-infrared, and X-ray surveys (see review by Kraan-Korteweg & Lahav 2000, and the many contributions in “Mapping the Hidden Universe”, ASP Conf. Ser. 218, eds. Kraan-Korteweg et al. 2000). The first step in this cartography (with the exception of 21-cm surveys which immediately yield the angular coordinates and redshift of galaxies) is the two-dimensional mapping of galaxies. Follow-up redshift measurements are required to map the distribution of galaxies in three dimensions. The two-dimensional galaxy distribution alone can be misleading. For instance, the prominent overdensity of galaxies in Vela () made apparent by the optical search by Kraan-Korteweg (2000a) in the Hydra/Antlia extension was found to be due to a superposition of a nearby ( km s-1) filament connecting to the Hydra cluster, a more distant ( km s-1) shallow extended supercluster, and a very distant ( km s-1) wall-like structure crossing the ZOA (Kraan-Korteweg et al. 1995).
In this paper, we will present the results from pointed H I observations of a sample of low surface-brightness (LSB) obscured spiral galaxies selected from the deep optical galaxy catalog in the ZOA () in the extension of the Hydra and Antlia clusters (Kraan-Korteweg 2000a). The optical catalog is the first of a series of five systematic galaxy searches covering the southern Milky Way between Galactic longitudes and (see Fig. 1 in Kraan-Korteweg 2000a). Galaxies were identified by eye through the systematic inspection of 50-times amplified images of the IIIaJ film copies of the ESO/SRC sky survey. Although the majority of the newly uncovered galaxies are small and faint, many of them may be intrinsically large and nearby but reduced in apparent size, magnitude and classifiable morphology due to the increasing foreground dust absorption at lower latitudes.
An analysis of the catalogs (see Kraan-Korteweg 2000a and Woudt & Kraan-Korteweg 2001 for details) show that galaxies above a diameter limit of (determined at an isophote of approximately 24.5 mag/arcsec2) can be discovered “easily” through obscuration layers of 3 magnitudes of extinction. Up to that extinction level of , the catalogs are complete for galaxies with intrinsic diameters of arcmin (extinction-corrected, i.e. the diameter they would have if they were not lying behind the Milky Way). The optical searches succeed in a reduction of the solid angle of the ZOA by a factor of about , respectively from to (see also Fig. 4).
In order to also reduce the gap in redshift space, redshifts are required for a representative sample of this newly optically filled-in part of the ZOA. For the determination of the peculiar velocity of the Local Group and the mapping of the velocity flow field, the nearby galaxy population is particularly important. We obtain individual optical spectroscopy of the brightest galaxies with the SAAO 1.9 m telescope (Kraan-Korteweg et al. 1995 for the Hydra/Antlia ZOA region; Fairall et al. 1998, and Woudt et al. 1999 for the Crux and Great Attractor regions respectively) and 21-cm line observations of extended LSB spirals with the 64m Parkes radio telescope (this paper), and finally, low resolution, multifiber spectroscopy for the high-density regions (Felenbok et al. 1997, Woudt et al. 2002). We typically measure recession velocities for about 15% of our ZOA galaxies.
These three observing methods are complementary in galaxy populations, characteristic magnitude, diameter range, and the depth of volume they probe: whereas the multifiber spectroscopy gives a good description of clusters and dense groups in the ZOA out to recession velocities of 25 000 km s-1, the SAAO and H I observations cover the bright end of the galaxy distribution and provide a fairly homogeneous sampling of galaxies out to 10 000 km s-1(Kraan-Korteweg et al. 1994).
The H I observations are vital in recovering an important fraction of the nearby spiral galaxy population which would otherwise be impossible to map. In addition to the extremely obscured and/or LSB galaxies, some of the brighter spiral galaxies with redshifts known from optical spectroscopy were reobserved with the Parkes radiotelescope, as their H I data are relevant to our program of mapping the peculiar velocity field in the ZOA via the Tully–Fisher relation.
Our pointed H I observations are complementary to the ongoing blind H I survey in the ZOA, conducted with the multibeam receiver on the Parkes telescope (Henning et al. 2000, Staveley-Smith et al. 2000b). Unlike the current work, the blind H I ZOA survey is not optically selected, but is rather a fully-sampled survey over the region , . The velocity coverage of the blind survey is to 12 700 km s-1, and the sensitivities obtained by the deep blind survey will be similar to those obtained in the current work. Note that most of our objects lie outside of the blind H I survey region.
In the following section, a description of the observations is given. Sect. 3 then provides the H I data and profiles of the detected galaxies, including details about a number of pointings which revealed more than one signal, two of which do not seem to have an optical counterpart even though the extinction is not extreme at those positions. In Sect. 4 the observed galaxies that were not detected in H I are listed with the searched velocity range. This is followed by an analysis of the properties of the detected (and non-detected) galaxies (Sect. 5) and a brief discussion of the resulting galaxy distribution in redshift space in relation to known features adjacent to the ZOA (Sect. 6), and finally, a summary is provided in Sect. 7.
2 Observations
The Parkes 64 m radio telescope111The Parkes telescope is part of the Australia Telescope which is funded by the Commonwealth of Australia for operation as a National Facility managed by CSIRO. was used over four observing periods of about 10 – 14 days each (June 1993, April 1994, July 1995 and September 1996). Here, we report on the observations that cover the Hydra/Antlia ZOA region, which were made mainly during the first 2 observing periods (see Fig. 4 for an outline of the search area).
All observations were carried out in total power mode. Ten minute ON-source observations were preceded by an equal length OFF-source observation at the same declination but 10.5 minutes earlier in right ascension, so as to traverse the same path in topocentric coordinates during both the reference and the signal observation. Such ON/OFF-observations were typically repeated three times, less for strong sources with a clear detection after a shorter integration time, and more in a few cases when a weak possible detection was identified after this sequence. In those cases, observations were repeated until the reality of the signal was unambiguous.
At 21 cm, the telescope has a half-power beamwidth (HPBW) of 15′, and the system temperature was typically 39 K at the time of these observations. In 1993, we used the 1024-channel autocorrelator to cover a bandwidth of 32 MHz, using the two orthogonal linear polarizations. With the bandwidth generally centered at 3000 km s-1, we obtained good S/N coverage for the velocity range km s-1. In a second step, we reobserved some of the non-detections at a central velocity of 7500 km s-1. With this set-up, the channel spacing was 6.6 km s-1 and the velocity resolution after Hanning smoothing was 13.2 km s-1. From 1994 on, we used two IF’s and offset 512 channels of each polarization by 22 MHz. This resulted in an instantaneous velocity coverage of about km s-1 with a channel spacing of 13.2 km s-1, and a velocity resolution after Hanning smoothing of 27.0 km s-1. Although the lower frequencies were often badly disturbed by interference around 8300 km s-1, this increased the average detection rate considerably.
The online control program automatically corrected for the zenith angle dependence of the telescope sensitivity. The pointing and primary flux calibration was obtained (by local personnel) from observations of the continuum source Hydra A (Davies et al. 1989). As an added check of system performance, secondary H I flux calibrators, chosen from the General Catalog of H I Observations by Huchtmeier & Richter (1989) were observed regularly in all the runs (mainly NGC 1232, IC 5201, Anon 0203-55, ESO 501-23, as well as a few others). Based on those data the internal consistency of the flux scale is of the order of 15%.
The data were reduced using the Spectral Line Analysis Program (“SLAP”; Staveley-Smith 1985). In all cases the two orthogonal polarizations were averaged during data reduction. Usually a third- to fifth-order polynomial baseline was subtracted from the spectra. With a few exceptions for the 512 channel observations, the spectra were then generally Hanning-smoothed once.
3 Detections
In the following, we present the parameters of the detected galaxies. The reduced H I spectra of the detected galaxies are shown in Fig. 1. The optical properties (observed and extinction-corrected) as well as the H I parameters are then given Table 1. The columns in the Table are explained below.
Col. 1: Identification as given in the optical Hydra/Antlia ZOA galaxy catalog (Kraan-Korteweg 2000a). The superscript “a” indicates that the Parkes telescope was actually not pointed towards the galaxy listed in Table 1 but towards another galaxy at small angular separation (see also galaxies marked with “a” in Table 2). Based on independent optical redshift information, the detected signal could be unambigously assigned to this galaxy instead of the galaxy centered in the beam. The signal of the galaxy RKK 1288 was obtained from the pointing to RKK 1284 at an angular separation of ; RKK 2546 from RKK 2525 at (see further details in Sect. 4.1). Obviously the H I fluxes of these detections will be slightly underestimated as the measurements were obtained off-center. This is indicated by a “*” in the columns describing the H I parameters (column 14 – 17).
While disentangling these ambiguities it was noted that the optical parameters of the galaxies RKK 2544 and RKK 2546 are interchanged in the ZOA catalog and thus also in the SAAO redshift paper (Kraan-Korteweg et al. 1995). It has been corrected in Table 1.
Col. 2: Second name. Most of the second identifications given in Column 2 of Table 1 originate from the ESO/Uppsala Survey of the ESO(B) Atlas (Lauberts, 1982), recognizable as ’L’ plus the respective field and running number. FGCE# stands for the Flat Galaxy Catalog (Karenchentsev et al. 1993), AM# for Arp Madore (1987), and HIZSS for the shallow H I Parkes All Sky Survey (HIPASS) ZOA survey behind the southern Milky Way (Henning et al. 2000). In three of the pointed observations (RKK1037, RKK1919 and RKK1947) more than one 21-cm detection was identified within the beam and covered velocity range. Some of these H I detections do not have an optical counterpart (INV#). These special cases will be discussed in further detail later in this section.
Col. 3: Identification in the IRAS Point Source Catalog (IRAS PSC hereafter). The entries indicate I (certain identification), P (possible identification), and Q (questionable). See Table 3 and Sect. 5 in Kraan-Korteweg (2000a) for further details.
Col. 4: Right Ascension RA (J2000.0).
Col. 5: Declination Dec (J2000.0). The ’:’ signifies that the coordinates have a lower accuracy compared to the 1 arcsec precision of the galaxies in the ZOA catalog.
Col. 6: Galactic longitude .
Col. 7: Galactic latitude .
Col. 8: Morphological type. The morphological types are coded similarly to the precepts of the RC2 (de Vaucouleurs et al. 1976) with the addition of the subtypes E, M and L. They stand for early spiral (S0/a-Sab), middle spiral (Sb-Sd) and late spiral or irregular (Sdm-Im).
Col. 9: Large diameter and small diameter in arcsec.
Col. 10: Apparent magnitude . These magnitudes are eye-estimates from the ESO/SERC IIIaJ film copies. They compare well with the Lauberts & Valentijn (1989) magnitudes and have a 1 dispersion of less than .
Col. 11: The Galactic reddening at the position of the galaxy, as given by the DIRBE/IRAS extinction maps (Schlegel et al. 1998). See the catalog paper for a more detailed discussion (Kraan-Korteweg 2000a).
Col. 12: Extinction-corrected large diameter. The corrections are based on Cameron’s (1990) law and use the conversion value to extinction in the blue, , according to Cardelli et al. (1989).
Col. 13: Extinction-corrected apparent magnitude, again applying the laws as given in Cameron (1990).
Col. 14: Heliocentric H I radial velocity in km s-1 taken at the midpoint of the H I profile at the 20% level. The velocity is given in the optical convention .
A “:” indicates an uncertain value whereas a “*” means that a signal was measured off the center of the beam.
Col. 15: Velocity width in km s-1 of the H I profile measured at the level of the peak intensity.
Col. 16: Velocity width in km s-1 of the H I profile measured at the level of the peak intensity.
Col. 17: H I flux integral, in Jy km s-1, uncorrected for finite beam size.
Col. 18: RMS noise level in m Jy measured over the region used to fit a baseline, typically of a width of 1500 km s-1 centered on, but not including, the detection.
| Ident. | Other | IR | R.A. | Dec. | gal | gal | Type | x | ||||||||||||||||||
|---|---|---|---|---|---|---|---|---|---|---|---|---|---|---|---|---|---|---|---|---|---|---|---|---|---|---|
| (h m s) | (∘ ′ ′′) | (∘) | (∘) | (′′) | (m) | (m) | (′′) | (m) | km/s | km/s | km/s | Jy km/s | m Jy | km/s | ||||||||||||
| (1) | (2) | (3) | (4) | (5) | (6) | (7) | (8) | (9) | (10) | (11) | (12) | (13) | (14) | (15) | (16) | (17) | (18) | (19) | ||||||||
| RKK0347 | FGCE0717 | 08 42 36.8 | -55 23 34 | 272.44 | -8.03 | S | 60x | 7 | 17.2 | 0.28 | 81 | 15.9 | 2786 | 106 | 129 | 1.60 | 2.2 | |||||||||
| RKK0718 | 08 56 04.5 | -55 04 02 | 273.39 | -6.32 | S | 67x | 60 | 15.1 | 0.38 | 108 | 13.4 | 3905 | 127 | 164 | 1.38 | 2.8 | ||||||||||
| RKK0764 | L165-008 | 08 57 54.2 | -53 52 31 | 272.65 | -5.35 | D | 60x | 54 | 15.1 | 0.41 | 109 | 13.2 | 5802 | 164 | 195 | 3.97 | 6.3 | |||||||||
| RKK1037 O | 08 57 45. | -61 49.0 : | 278.78 | -10.47 | 0.19 | 2881 | * | 133 | * | 149 | * | 3.23 | * | 6.8 | ||||||||||||
| RKK1037 | 09 08 18.8 | -61 49 35 | 279.61 | -9.54 | S | 4 | 67x | 60 | 15.0 | 0.21 | 80 | 14.1 | 2242 | 128 | 147 | 2.94 | 4.5 | |||||||||
| RKK1287 | L091-010 | 09 23 28.7 | -62 52 56 | 281.61 | -8.98 | S | 3 | 74x | 20 | 15.5 | 0.26 | 97 | 14.3 | 4562 | 268 | 291 | 7.42 | 2.9 | ||||||||
| RKK1288a | L091-011 | I | 09 23 26.8 | -63 40 46 | 282.18 | -9.54 | S | 3 | 101x | 12 | 15.8 | 0.22 | 124 | 14.8 | 3197 | * | 277 | * | 306 | * | 13.04 | * | 5.2 | 3192 (1) | ||
| RKK1312 | 09 25 19.0 | -59 30 14 | 279.36 | -6.43 | S | 54x | 7 | 17.1 | 0.36 | 85 | 15.4 | 2973 | 208 | 244 | 5.35 | 5.4 | ||||||||||
| RKK1328 | L126-011 | 09 26 24.3 | -60 36 54 | 280.25 | -7.12 | S | L | 74x | 27 | 15.7 | 0.28 | 99 | 14.4 | 2119 | 124 | 143 | 21.63 | 7.6 | ||||||||
| RKK1371 | L126-014 | 09 28 26.9 | -60 48 05 | 280.56 | -7.08 | E | 5 | 87x | 47 | 14.3 | 0.29 | 126 | 13.0 | 2196 | 263 | 290 | 8.33 | 6.9 | 2273 (1) | |||||||
| RKK1402 | L091-014 | 09 30 12.9 | -63 05 13 | 282.31 | -8.59 | S | 7 | 74x | 27 | 15.6 | 0.26 | 95 | 14.5 | 3047 | 188 | 213 | 3.81 | 3.9 | ||||||||
| RKK1419 | L126-018 | 09 31 09.6 | -59 47 53 | 280.10 | -6.13 | S | L | 40x | 16 | 16.8 | 0.44 | 75 | 14.7 | 2955 | 193 | 229 | 6.15 | 5.1 | ||||||||
| RKK1445 | FGCE0751 | 09 32 35.7 | -59 53 34 | 280.30 | -6.07 | S | 87x | 4 | 17.1 | 0.39 | 144 | 15.3 | 2978 | 189 | 207 | 5.98 | 4.5 | |||||||||
| RKK1464 | L126-019 | I | 09 34 13.5 | -61 16 59 | 281.40 | -6.95 | S | 6 | 108x | 81 | 14.2 | 0.36 | 168 | 12.6 | 2625 | 156 | 184 | 35.45 | 5.2 | 2569 (2) | ||||||
| RKK1479 | L126-020 | 09 35 50.2 | -62 00 21 | 282.04 | -7.35 | S | 5 | 54x | 47 | 15.3 | 0.38 | 90 | 13.5 | 2818 | 171 | 187 | 10.75 | 5.2 | ||||||||
| RKK1486 | L091-015 | 09 36 32.4 | -63 56 44 | 283.42 | -8.73 | S | 7 | 81x | 40 | 15.1 | 0.25 | 103 | 14.0 | 2932 | 233 | 254 | 7.86 | 3.3 | ||||||||
| RKK1492 | L126-022 | 09 37 00.9 | -60 55 55 | 281.41 | -6.47 | S | B | 4 | 81x | 34 | 14.9 | 0.38 | 134 | 13.1 | 2787 | 268 | 291 | 11.26 | 4.0 | 2918 (3) | ||||||
| RKK1499 | 09 37 30.7 | -60 18 49 | 281.04 | -5.97 | S | L | 54x | 5 | 17.6 | 0.34 | 80 | 16.1 | 3077 | 160 | 177 | 4.90 | 5.2 | |||||||||
| RKK1541 | 09 40 03.7 | -64 13 32 | 283.90 | -8.68 | S | M | 54x | 8 | 17.2 | 0.28 | 72 | 16.0 | 4589 | 372 | 415 | 4.44 | 3.8 | |||||||||
| RKK1561 | I | 09 41 44.0 | -60 47 54 | 281.75 | -5.98 | E | 4 | 34x | 20 | 16.2 | 0.46 | 67 | 14.1 | 3107 | 270 | 299 | 9.38 | 4.9 | 3070 (1) | |||||||
| RKK1610 | HIZSS056 | 09 45 24.8 | -48 08 29 | 273.90 | 3.96 | 54x | 13 | 16.9 | 0.48 | 117 | 14.5 | 878 | 75 | 94 | 8.25 | 11.8 | 880 (7) | |||||||||
| RKK1717 | 09 51 43.2 | -63 14 36 | 284.24 | -7.09 | 34x | 30 | 16.4 | 0.26 | 44 | 15.2 | 3126 | 108 | 128 | 1.94 | 3.7 | |||||||||||
| RKK1766 | 09 55 09. | -60 40.3 : | 282.94 | -4.84 | S | 4 | 40x | 27 | 16.1 | 0.53 | 89 | 13.6 | 3294 | 252 | 265 | 9.45 | 5.9 | |||||||||
| RKK1856 | L092-003 | 09 59 28.3 | -67 18 18 | 287.45 | -9.76 | S | 1 | 101x | 34 | 14.9 | 0.21 | 122 | 14.0 | 1491 | 182 | 200 | 6.19 | 7.5 | 1478 (1) | |||||||
| RKK1862 | L092-004 | 09 59 45.1 | -67 38 33 | 287.68 | -10.01 | S | 1 | 114x | 47 | 14.6 | 0.24 | 143 | 13.5 | 1857 | 175 | 198 | 12.35 | 5.9 | ||||||||
| RKK1864 | 10 00 03.1 | -64 26 26 | 285.72 | -7.46 | S | M | 81x | 8 | 17.0 | 0.24 | 102 | 15.9 | 9857 | 404 | 425 | 6.26 | 5.2 | |||||||||
| RKK1877 | 10 00 50.9 | -65 06 08 | 286.20 | -7.93 | 38x | 30 | 16.4 | 0.27 | 50 | 15.2 | 6040 | : | 225 | : | 251 | : | 3.60 | : | 5.2 | |||||||
| RKK1909 | L092-007 | 10 03 32.6 | -67 26 54 | 287.85 | -9.63 | I | 134x | 34 | 15.0 | 0.21 | 161 | 14.1 | 2006 | 109 | 138 | 6.68 | 7.1 | |||||||||
| RKK1919 | AM1002 | 10 04 47.3 | -48 44 26 | 276.80 | 5.49 | S | 6 | 40x | 40 | 15.3 | 0.47 | 84 | 12.9 | 6714 | 198 | 210 | 2.13 | 3.4 | ||||||||
| RKK1919 B | INV1 | 10742 | 265 | 276 | 2.35 | 3.7 | ||||||||||||||||||||
| RKK1938 | L062-002 | I | 10 05 14.7 | -67 44 52 | 288.17 | -9.78 | S | X | 3 | 60x | 54 | 15.1 | 0.21 | 72 | 14.2 | 5196 | : | 41 | : | 75 | : | 3.42 | : | 7.7 | 5194 (3) | |
| RKK1939 | L213-006 | 10 06 06.6 | -50 36 38 | 278.09 | 4.11 | I | 54x | 16 | 16.0 | 0.44 | 106 | 13.8 | 5299 | 296 | 317 | 8.01 | 4.6 | 5262 (1) | ||||||||
| RKK1945 | 10 06 29.6 | -50 14 33 | 277.92 | 4.44 | S | B | R | 4 | 47x | 40 | 15.1 | 0.44 | 93 | 12.9 | 5268 | 246 | 283 | 6.37 | 5.4 | |||||||
| RKK1947 | L092-009 | 10 06 02.1 | -67 03 48 | 287.81 | -9.18 | I | 81x | 13 | 16.3 | 0.24 | 101 | 15.2 | 1461 | 123 | 144 | 4.82 | 5.2 | 1455 (9) | ||||||||
| RKK1959 | 10 06 37.3 | -67 06 49 | 287.89 | -9.19 | 20x | 20 | 17.6 | 0.23 | 25 | 16.6 | 1623 | * | 75 | * | 92 | * | 2.32 | * | 5.2 | 1612 (9) | ||||||
| Obj.B | 10 06 20. | -67 09.2 : | 287.89 | -9.24 | 0.23 | 1743 | * | 46 | * | 78 | * | 2.38 | * | 5.2 | 1721 (9) | |||||||||||
| INV 2 | 10 04 45. | -66 56.0 : | 287.63 | -9.15 | 0.22 | 1877 | * | 65 | * | 155 | * | 2.61 | * | 5.2 | ||||||||||||
| RKK2043 | L092-015 | I | 10 11 00.6 | -67 08 40 | 288.26 | -8.96 | S | X | 3 | 60x | 47 | 15.0 | 0.19 | 70 | 14.2 | 5252 | 191 | 211 | 3.84 | 5.4 | 5169 (2) | |||||
| RKK2063 | L127-011 | I | 10 12 11.9 | -62 32 03 | 285.69 | -5.12 | S | 3 | 67x | 27 | 15.1 | 0.29 | 92 | 13.8 | 3403 | 238 | 376 | 4.19 | 5.9 | 3370 (4) | ||||||
| RKK2097 | 10 13 10.1 | -62 16 52 | 285.63 | -4.85 | 40x | 24 | 15.6 | 0.35 | 62 | 14.0 | 3784 | : | 188 | : | 235 | : | 1.62 | : | 4.4 | |||||||
| RKK2136 | 10 14 08.8 | -65 30 13 | 287.57 | -7.44 | S | M | 74x | 22 | 16.0 | 0.28 | 100 | 14.7 | 5858 | 261 | 275 | 7.74 | 7.8 | |||||||||
| RKK2192 | L092-019 | I | 10 16 16.3 | -64 51 60 | 287.39 | -6.79 | S | 67x | 8 | 16.9 | 0.29 | 92 | 15.6 | 3884 | 228 | 241 | 5.40 | 6.5 | ||||||||
| RKK2247 | 10 17 47.0 | -65 52 03 | 288.08 | -7.53 | S | X | M | 60x | 40 | 16.0 | 0.29 | 82 | 14.7 | 4588 | 123 | 169 | 3.21 | 6.1 | ||||||||
| RKK2249 | 10 17 59.0 | -62 45 07 | 286.36 | -4.93 | S | 5 | 60x | 7 | 17.3 | 0.39 | 103 | 15.4 | 3421 | 201 | 218 | 4.77 | 7.4 | |||||||||
| RKK2276 | 10 18 33.5 | -63 37 25 | 286.90 | -5.62 | S | L | 60x | 8 | 17.3 | 0.36 | 95 | 15.6 | 3615 | 307 | 338 | 3.73 | 5.3 | |||||||||
| RKK2426 | L214-002 | I | 10 23 11.6 | -49 28 14 | 279.71 | 6.60 | S | 2 | 77x | 44 | 14.8 | 0.30 | 105 | 13.5 | 5443 | 335 | 364 | 17.58 | 11.9 | 5411 (5) | ||||||
| RKK2507 | I | 10 25 58.8 | -53 52 21 | 282.44 | 3.11 | S | B | 5 | 51x | 34 | 15.4 | 0.55 | 133 | 12.5 | 6805 | 93 | 115 | 4.67 | 8.7 | |||||||
| RKK2508 | L062-010 | I | 10 25 33.2 | -67 44 43 | 289.77 | -8.68 | S | X | 7 | 60x | 60 | 14.9 | 0.25 | 76 | 13.8 | 6030 | : | 88 | : | 100 | : | 5.18 | : | 9.3 | 6011 (1) | |
| RKK2546a | 10 27 19.8 | -49 06 57 | 280.10 | 7.26 | S | 2 | 67x | 16 | 16.1 | 0.31 | 93 | 14.7 | 5584 | * | 172 | * | 187 | * | 2.25 | * | 7.6 | |||||
| RKK2585 | L214-008 | I | 10 28 25.1 | -50 41 29 | 281.08 | 6.01 | S | M | 65x | 47 | 14.9 | 0.29 | 90 | 13.6 | 7005 | 373 | 391 | 5.59 | 6.2 | 6868 (6) | ||||||
| RKK2652 | L214-013 | I | 10 31 01.4 | -49 02 51 | 280.58 | 7.63 | S | 3 | 87x | 48 | 14.5 | 0.33 | 129 | 13.0 | 4886 | 324 | 353 | 5.29 | 4.1 | 4780 (5) | ||||||
| RKK2684 | L092-022 | I | 10 31 57.4 | -63 42 30 | 288.21 | -4.90 | S | 7 | 128x | 47 | 14.6 | 0.48 | 266 | 12.2 | 3762 | 318 | 341 | 14.05 | 7.1 | 3671 (1) | ||||||
| RKK2687 | 10 32 20.0 | -50 42 30 | 281.62 | 6.32 | S | M | 51x | 38 | 15.8 | 0.30 | 72 | 14.4 | 6097 | 138 | 155 | 2.01 | 5.0 | |||||||||
| RKK2740 | I | 10 35 52.5 | -54 06 28 | 283.81 | 3.65 | S | 5 | 54x | 5 | 17.6 | 0.52 | 124 | 15.0 | 6285 | : | 359 | : | 436 | : | 6.78 | : | 6.2 | ||||
| RKK2754 | L168-009 | I | 10 37 18.0 | -54 56 07 | 284.40 | 3.04 | S | 5 | 54x | 24 | 16.1 | 0.73 | 273 | 11.7 | 2674 | 306 | 327 | 19.47 | 5.6 | 2754 (7) | ||||||
| RKK2763 | L214-016 | 10 38 09.5 | -50 09 33 | 282.15 | 7.26 | S | 4 | 148x | 15 | 15.8 | 0.53 | 359 | 13.1 | 7074 | 436 | 469 | 8.67 | 4.5 | ||||||||
| RKK2771 | 10 38 09.9 | -66 06 13 | 289.99 | -6.64 | S | 47x | 43 | 16.2 | 0.38 | 77 | 14.4 | 7558 | 209 | 241 | 7.76 | 6.2 | ||||||||||
| RKK2847 | L169-002 | I | 10 48 14.9 | -53 18 10 | 285.04 | 5.23 | S | L | 94x | 27 | 15.2 | 0.50 | 204 | 12.7 | 2683 | 301 | 324 | 10.26 | 6.2 | 2712 (1) | ||||||
| RKK2879 | L169-005 | 11 02 31.3 | -53 38 36 | 287.11 | 5.85 | S | B | 1 | 67x | 47 | 14.8 | 0.34 | 96 | 13.4 | 3917 | 386 | 408 | 4.66 | 5.5 | 3766 (1) | ||||||
| RKK2991 | L170-002 | I | 11 26 03.7 | -52 46 47 | 290.09 | 7.95 | S | B | R | 5 | 81x | 81 | 14.5 | 0.26 | 106 | 13.3 | 5192 | 204 | 232 | 8.07 | 3.9 | 4941 (8) | ||||
| RKK2992 | L170-003 | 11 26 08.6 | -54 14 08 | 290.58 | 6.58 | S | 2 | 94x | 40 | 14.6 | 0.26 | 125 | 13.4 | 5697 | 480 | 516 | 16.90 | 5.7 | 5369 (1) | |||||||
| RKK3017 | 11 28 59.7 | -58 25 21 | 292.30 | 2.74 | S | X | 3 | 74x | 34 | 15.3 | 0.63 | 255 | 11.8 | 4531 | 516 | 542 | 4.88 | 4.7 | 4639 (1) | |||||||
| RKK3165 | L170-009 | I | 11 39 16.4 | -53 33 12 | 292.23 | 7.81 | S | 2 | 74x | 27 | 15.8 | 0.22 | 90 | 14.8 | 5027 | 347 | 369 | 4.45 | 5.2 | |||||||
| RKK3176 | L170-010 | I | 11 40 04.7 | -54 23 51 | 292.58 | 7.03 | S | B | 4 | 60x | 54 | 15.1 | 0.29 | 82 | 13.8 | 4558 | 273 | 303 | 7.75 | 3.6 | 4677 (8) | |||||
| RKK3204 | L216-035 | 11 44 04.3 | -52 36 39 | 292.67 | 8.91 | S | S | 5 | 74x | 67 | 14.9 | 0.20 | 88 | 14.0 | 4538 | 153 | 178 | 3.98 | 3.9 | 4446 (6) | ||||||
| RKK3245 | L170-012 | 11 47 57.8 | -53 54 13 | 293.57 | 7.81 | S | 5 | 47x | 34 | 16.0 | 0.22 | 58 | 15.0 | 5067 | 243 | 277 | 7.63 | 5.2 | ||||||||


Col. 19: Independent velocity determinations come from the following sources:
(1) Kraan-Korteweg et al. (1995)
(2) Visvanathan & Yamada (1996)
(3) Fairall et al. (1998)
(4) Strauss et al. (1992)
(5) Fisher et al. (1995)
(6) The NED data compilation (prior to 1992)
(7) Henning et al. (2000)
(8) Dressler (1991)
(9) Gordon (in prep.), Gordon et al. (in prep.)
Obviously we did not repeat observations at
Parkes for galaxies with existing H I data. Therefore, most of
the independent velocities listed in column 19 originate from optical
spectroscopy. Overall, the agreement with the radio data is excellent.
The two strong H I sources RKK1610 and RKK2754 were also detected with the shallow ZOA H I survey (HIZSS 056 and HIZSS 064). The H I parameters measured by the HIZSS are in very good agreement with our pointed observations.
3.1 Special cases
3.1.1 An OFF-detection in the RKK 1037 beam
The detection labelled RKK 1037OFF in Fig. 1 was first seen as an unexpected negative signal in the scan directed towards RKK 1037. A pointed observation towards the reference (or “OFF”) position at a 105 lower RA then yielded the equivalent positive signal which is displayed in Fig. 1.
At this position no galaxy is known in the literature. With its Galactic latitude of it lies outside the optically searched ZOA region. Considering that the optical extinction at this position, , is quite low, we are confident that such a spiral galaxy should be visible. Indeed, its H I mass of (the inequality is due to the galaxy’s not lying at the center of the beam, where sensitivity is at a maximum) would suggest for a typical spiral galaxy an absolute magnitude of at least as bright as . Using its velocity km s-1 corrected to the centroid of the Local Group following Yahil, Sandage & Tammann (1977) and a Hubble constant of km s-1 Mpc-1 gives a value of and, when observed through the extinction layer at that position, .
A close inspection of the ESO/SERC IIIaJ film copy of the field F125 revealed four galaxies (C1 C4) in the vicinity of the OFF-pointing. Their likelihood of being the optical counterpart for the H I emission will be discussed in order of increasing distance from the pointing.
C1: Closest to the center of the beam, at only from the OFF pointing, we found the first galaxy at RA , Dec (J2000.0). However, this galaxy seems an unlikely counterpart. It is a very small, edge-on spiral of very low-surface brightness. With an estimated magnitude of , this object does not match the values expected for this spiral galaxy at all. Furthermore the profile is atypical for an edge-on galaxy.
C2: At a distance of another faint very low surface brightness, edge-on spiral galaxy was identified (C2 at , ). As it is has a similar magnitude and size as C1, it is equally improbable to have produced the observed H I emission, particularly as the observed flux is underestimated by a factor of 2 for the offset of from the pointing center.
C3: Close to C2, at 77 from the pointing, we found another possible galaxy counterpart at , . With a size of about , we estimate its magnitude to be of the order of . However, this galaxy looks more like an early type galaxy, possibly S0 or S0/a. This is independently confirmed by near infrared DENIS222The DEep Near-Infrared Survey of the Southern Sky (Epchtein 1997, Epchtein et al. 1997, Fouqué et al. 2000) images which were available to us and which we have also consulted for possible cross-identifications. It is the only counterpart seen on the NIR DENIS survey, therewith confirming its early-type morphology through its intrinsic red color. We derived an -band magnitude for C3 with the automated galaxy pipeline for DENIS (Mamon et al. 1997) of . Taking account of extinction effects and intrinsic color, the -band magnitude and estimate agree reasonably well. However, with its probable early-type morphology and magnitude, C3 does not match the expectations from the observed H I flux either even when corrected for the positional offset ().
C4: A final candidate was found at a considerable distance () from the beam center. At RA , Dec , this object is a prominent (at least by ZOA standards) nearly edge-on spiral galaxy. It measures . With an intermediate surface-brightness, we estimate its magnitude in the blue as , respectively . This is close to the expected value deduced from the H I observations, even after the flux is corrected with the factor 5 due to the offset of from the center of the beam. With a morphology of Sbc, this galaxy thus seems the most likely counterpart of the RKK 1037OFF detection.
3.1.2 Two detections in the RKK 1919 beam
The pointing towards RKK 1919 revealed two well-separated 21-cm detections, one at km s-1 and one at 10 370 km s-1, both consistently recovered in the individual scans. No other galaxy besides the one described in Table 1 is visible on the sky surveys within the area of the HPBW of the Parkes antenna, and no independent redshift measurement is available to assign one of the two values to the optical galaxy. Determining and comparing the absolute parameters for the two redshift values make the nearer redshift the more likely value for the optically visible galaxy. Furthermore, a low-surface brightness galaxy at a redshift of over 10 000 km s-1 behind an obscuration layer of might easily remain invisible in the optical.
3.1.3 Four detections within the beam of ESO 92-9
The spectrum obtained at the pointing towards RKK 1947 = ESO 92-9 reveals four distinct peaks in the velocity range of km s-1, one peak adjacent to the next one and not, or just barely, overlapping (see Figs. 1 and 2). In order to confirm the reality and the discreteness of the four individual peaks, we reobserved this galaxy with higher resolution and a narrower bandwidth (2048 channels over 16 MHz centered on km s-1). The resulting spectrum, which is shown in Fig. 2, clearly confirms the four individual peaks – although the highest redshift one seems slightly weaker here – and also suggests that the four signatures seem to originate from four different sources.

The region around ESO 92-9 is quite a busy region with a number of known nearby galaxies at similar velocities. However, only two spiral galaxies, ESO 92-9 itself, an edge-on spiral of , and RKK 1959, a small, face-on irregular galaxy (), lie within or close to the beam of the Parkes telescope (see solid circle centered on ESO 92-9 in Fig. 3). These galaxies hence might be the sources of two of the four peaks in the observed profile. No independent velocity is known for either of these two spiral galaxies so it remains unclear which H I signal belongs to which galaxy.
A further interesting question was whether the remaining part of the signal could be ascribed to the nearby () strong H I-emitting, interacting galaxy IC 2554 with a flux of Jy km s-1, a heliocentric velocity of km s-1, and the broad linewidth of km s-1 (Huchtmeier & Richter 1989).
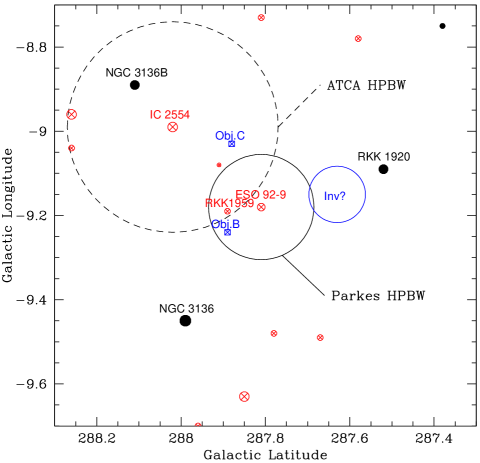
A clarification of this confusing area was possible only through the ATCA observations of the interacting galaxy IC 2554 (see dashed circle in Fig. 3) by Gordon (in prep.), and Gordon et al. (in prep.) which they kindly made available to us prior to publication. Their observations revealed that none of the peaks in our spectrum are due to IC 2554. But the first two peaks centered on km s-1 and 1605 km s-1 are matched exactly by their detections (profiles and intensities) at the positions of ESO 92-9 and RKK 1959.
In their 21-cm maps they had two additional detections, although for two of them they did not find an optical counterpart – a bit surprising for an extinction of less than 1 magnitude in the optical. But were they responsible for the two higher velocity peaks? In fact, the data for their Object B (Obj. B) resembled the third signal in our profile, however, their Obj. C was at a distinctly higher velocity than our fourth peak.
Due to the fact that the fourth peak in the spectrum of Figs. 1 and 2 could be reproduced consistently with our scans and that Gordon et al. did find two H I clouds without optical counterparts, we considered the option that maybe yet another invisible H I cloud could exist that gives rise to the last peak, an H I cloud beyond the ATCA beam but not too far away from the Parkes beam. Using the HIPASS (Staveley-Smith, Engel & Webster 2000) we inspected spectra at larger and larger distances from the two beams in the elongation of the axis defined by IC 2554 to ESO 92-9, and indeed could recover the same signal in the HIPASS data. It is strongest ( Jy) at RA , Dec, respectively , with a positional uncertainty of . Hence, we believe it to be an H I cloud in the direction of RKK 1920, a lenticular galaxy at 2081 km s-1. At an offset of from the center of the beam, the flux of this H I cloud would be a factor of 5 higher compared to what we observed.
A renewed inspection of this whole area on the sky survey, as well as the fits-file of the second generation red DSS image – which permits the detection of very low surface brightness features by varying the contrast – did unveil a previously unrecognized, extremely low-surface brightness spiral galaxy of about and partly covered by foreground stars, hence difficult to recognize, at RA , Dec, (). This faint galaxy is indicated in Fig. 3 as the tiny circled cross without further name which lies just outside the Parkes beam about from Obj. C in the direction of IC 2554. It does not seem to be the counterpart for any of the three H I signals for which so far no luminous counterpart has been found, i.e.: Obj. B and C by the ATCA observations of Gordon et al. , and Obj. B and the new object labelled “Inv” evident in the Parkes observations.
So we seem to have three isolated, optically invisible H I clouds in this highly interactive region - and possibly even more? This certainly is a region that merits further sensitive H I synthesis mapping, as well as deep infrared imaging.
4 The non-detections
In Table 2 the galaxies that were observed in the Hydra/Antlia region but not detected (N = 82) are listed with the searched velocity range as well as the rms within that interval. Some spectra did reveal a signal, but careful investigation showed them to be due to close neighbors rather than the targeted galaxies. These few cases are marked with the superscript “a” in Column 1 of Table 2 and discussed in further detail in Sect. 4.1.
Col. 1 - 13: Same explanations as given for Table 1, where the superscript “a” in column 1 indicates that a signal of another galaxy is visible in the scan (see also Table 1).
Col. 14: The searched velocity range.
Col. 15: The rms noise of the searched velocity range, typically of the order of 3 m Jy. These values were determined after baseline fitting over a width of
| Ident. | Other | IR | R.A. | Dec. | gal | gal | Type | x | ||||||||||||||||
|---|---|---|---|---|---|---|---|---|---|---|---|---|---|---|---|---|---|---|---|---|---|---|---|---|
| (h m s) | (∘ ′ ′′) | (∘) | (∘) | (′′) | (m) | (m) | (′′) | (m) | km/s | m Jy | km/s | km/s | ||||||||||||
| (1) | (2) | (3) | (4) | (5) | (6) | (7) | (8) | (9) | (10) | (11) | (12) | (13) | (14) | (15) | (16) | (17) | ||||||||
| RKK0142 | 08 36 48.2 | -56 28 55 | 272.83 | -9.33 | S | B | 5 | 40x | 27 | 16.4 | 0.19 | 47 | 15.6 | 500 | – | 13000 | 4.0 | 8100 | – | 8300 | ||||
| RKK0230 | 08 38 35.5 | -58 03 52 | 274.27 | -10.07 | S | M | 51x | 27 | 16.2 | 0.17 | 58 | 15.5 | 400 | – | 12800 | 3.5 | ||||||||
| RKK0349 | 08 42 42.7 | -53 55 26 | 271.27 | -7.12 | S | M | 67x | 7 | 17.3 | 0.38 | 112 | 15.5 | 600 | – | 12800 | 3.3 | 1100 | – | 1300 | |||||
| RKK0385 | 08 43 53.4 | -56 34 31 | 273.50 | -8.60 | S | B | 5 | 40x | 40 | 16.0 | 0.20 | 48 | 15.1 | 600 | – | 10000 | 3.7 | 7900 | – | 8400 | 13786 (M) | |||
| RKK0476 | 08 47 17.1 | -54 26 25 | 272.10 | -6.91 | S | 34x | 34 | 16.4 | 0.37 | 54 | 14.7 | 600 | – | 5600 | 3.2 | |||||||||
| RKK0566 | 08 50 33.9 | -59 58 54 | 276.77 | -10.00 | S | M | 60x | 13 | 16.9 | 0.18 | 69 | 16.1 | 600 | – | 10000 | 3.6 | 7900 | – | 8400 | 23980 (M) | ||||
| RKK0654 | L165-006 | 08 53 36.3 | -54 05 07 | 272.40 | -5.97 | D | 134x | 121 | 13.7 | 0.34 | 216 | 12.1 | 600 | – | 10000 | 3.4 | ||||||||
| RKK0677 | 08 54 06.4 | -58 20 55 | 275.77 | -8.62 | S | 5 | 34x | 28 | 16.4 | 0.25 | 44 | 15.3 | 500 | – | 9500 | 3.0 | ||||||||
| RKK0775 | 08 57 56.8 | -59 17 15 | 276.82 | -8.84 | S | M | 30x | 27 | 16.5 | 0.23 | 37 | 15.5 | 600 | – | 10000 | 3.9 | ||||||||
| RKK0863 | 09 01 12.2 | -60 00 21 | 277.65 | -8.99 | S | 5 | 32x | 30 | 16.4 | 0.19 | 37 | 15.6 | 600 | – | 5600 | 3.3 | ||||||||
| RKK0889 | 09 02 12.4 | -58 54 48 | 276.89 | -8.18 | S | 1 | 62x | 28 | 15.9 | 0.30 | 87 | 14.5 | 600 | – | 13000 | 2.9 | 10361 (1) | |||||||
| RKK0902 | 09 02 57.5 | -53 29 10 | 272.85 | -4.53 | S | 40x | 11 | 17.3 | 0.83 | 254 | 12.4 | 700 | – | 10000 | 3.9 | |||||||||
| RKK0906 | 09 02 58.2 | -54 08 44 | 273.35 | -4.97 | S | 51x | 8 | 17.1 | 0.50 | 103 | 14.8 | 600 | – | 5600 | 3.1 | |||||||||
| RKK0966 | I | 09 05 13.0 | -54 26 30 | 273.79 | -4.92 | S | L | 40x | 7 | 17.5 | 0.48 | 82 | 15.2 | 600 | – | 10000 | 3.2 | |||||||
| RKK0972 | 09 05 29.8 | -55 00 48 | 274.49 | -5.49 | S | 54x | 12 | 16.6 | 0.37 | 85 | 14.9 | 500 | – | 10000 | 4.6 | |||||||||
| RKK0980 | 09 05 41.8 | -55 48 50 | 274.86 | -5.78 | D | 54x | 40 | 15.8 | 0.35 | 88 | 14.2 | 400 | – | 10000 | 3.6 | |||||||||
| RKK0986 | 09 05 52.3 | -55 22 55 | 274.55 | -5.47 | S | 1 | 40x | 9 | 17.1 | 0.37 | 64 | 15.4 | 6000 | – | 11100 | 3.0 | 9832 (1) | |||||||
| RKK1041 | 09 08 55.1 | -54 59 18 | 274.55 | -4.89 | S | 5 | 27x | 20 | 17.3 | 0.50 | 61 | 14.7 | 500 | – | 5600 | 2.8 | ||||||||
| RKK1180 | 09 16 20.5 | -63 12 52 | 281.28 | -9.79 | 40x | 27 | 15.9 | 0.20 | 47 | 15.0 | 600 | – | 12800 | 3.6 | ||||||||||
| RKK1194 | L126-005 | 09 17 41.0 | -59 36 58 | 278.76 | -7.19 | S | 4 | 60x | 27 | 15.5 | 0.28 | 81 | 14.2 | 500 | – | 12000 | 3.4 | 10240 (2) | ||||||
| RKK1204 | 09 18 12.1 | -56 40 02 | 276.68 | -5.09 | S | 5 | 27x | 12 | 17.8 | 0.61 | 75 | 14.8 | 700 | – | 5600 | 2.8 | ||||||||
| RKK1235 | 09 19 39.0 | -63 22 10 | 281.66 | -9.63 | S | 47x | 27 | 16.7 | 0.22 | 57 | 15.7 | 500 | – | 10000 | 4.0 | |||||||||
| RKK1274 | 09 22 43.3 | -63 21 52 | 281.90 | -9.38 | S | 4 | 34x | 13 | 17.2 | 0.24 | 43 | 16.1 | 600 | – | 10000 | 3.7 | 7900 | – | 8400 | |||||
| RKK1284a | 09 23 18.7 | -63 49 51 | 282.28 | -9.66 | S | 40x | 7 | 17.5 | 0.23 | 49 | 16.5 | 600 | – | 10000 | 2.4 | 1100 | – | 1500 | ||||||
| 7900 | – | 8200 | ||||||||||||||||||||||
| RKK1369 | 09 28 17.1 | -61 53 31 | 281.31 | -7.88 | S | 5 | 54x | 34 | 16.2 | 0.31 | 79 | 14.7 | 500 | – | 10000 | 3.6 | ||||||||
| RKK1409 | I | 09 30 49.4 | -58 03 30 | 278.87 | -4.89 | S | M | 34x | 5 | 18.0 | 0.67 | 121 | 14.4 | 800 | – | 9700 | 3.9 | |||||||
| RKK1411 | I | 09 30 55.3 | -57 36 52 | 278.58 | -4.56 | S | 34x | 27 | 16.4 | 0.91 | 283 | 10.9 | 300 | – | 10000 | 4.1 | ||||||||
| RKK1457 | 09 33 43.1 | -62 40 56 | 282.32 | -8.02 | S | 47x | 40 | 15.9 | 0.30 | 66 | 14.5 | 600 | – | 5600 | 2.5 | |||||||||
| RKK1470 | 09 35 06.4 | -62 20 18 | 282.20 | -7.66 | S | E | 30x | 11 | 17.4 | 0.34 | 44 | 15.9 | 600 | – | 10000 | 3.2 | 8000 | – | 8300 | |||||
| RKK1482 | 09 36 10.7 | -62 23 60 | 282.34 | -7.62 | S | 3 | 60x | 54 | 15.2 | 0.31 | 85 | 13.8 | 600 | – | 10000 | 2.6 | ||||||||
| RKK1543 | 09 40 44.8 | -49 31 37 | 274.23 | 2.41 | S | 31x | 7 | 17.8 | 0.67 | 115 | 14.1 | 600 | – | 10000 | 3.6 | 4250 | – | 4600 | ||||||
| RKK1554 | 09 41 41.2 | -49 33 07 | 274.36 | 2.50 | S | B | 5 | 34x | 27 | 16.5 | 0.75 | 153 | 12.4 | 600 | – | 5600 | 2.4 | |||||||
| RKK1621 | 09 46 05.5 | -49 21 17 | 274.77 | 3.11 | S | B | 5 | 24x | 20 | 17.2 | 0.53 | 59 | 14.4 | 600 | – | 5600 | 2.4 | |||||||
| RKK1669 | 09 49 27.4 | -49 08 26 | 275.06 | 3.63 | S | 4 | 34x | 34 | 16.0 | 0.54 | 87 | 13.2 | 600 | – | 10200 | 3.1 | ||||||||
| RKK1707 | 09 51 43.0 | -47 21 59 | 274.22 | 5.24 | I | 81x | 13 | 16.1 | 0.41 | 143 | 14.1 | 600 | – | 10000 | 3.6 | 1000 | – | 1300 | ||||||
| RKK1749 | 09 54 46.9 | -49 45 53 | 276.13 | 3.69 | S | L | 47x | 5 | 17.6 | 0.38 | 76 | 15.9 | 800 | – | 5600 | 2.7 | ||||||||
| RKK1767 | 09 55 16. | -61 57.2 | 283.75 | -5.83 | S | 4 | 27x | 20 | 16.4 | 0.35 | 42 | 14.8 | 600 | – | 5400 | 2.2 | ||||||||
| RKK1780 | FGCE0780 | 09 55 31.0 | -67 07 54 | 287.04 | -9.86 | S | 71x | 8 | 16.8 | 0.23 | 87 | 15.8 | 600 | – | 10000 | 4.2 | ||||||||
| RKK1894 | 10 03 6.5 | -53 15 34 | 279.29 | 1.70 | I | 24x | 20 | 17.0 | 0.90 | 207 | 11.4 | 400 | – | 5300 | 2.1 | 1100 | – | 1400 | 17688 (M) | |||||
| RKK1900 | 10 03 26.4 | -50 05 16 | 277.43 | 4.28 | S | 9 | 38x | 4 | 17.8 | 0.47 | 79 | 15.4 | 600 | – | 5500 | 2.2 | ||||||||
| RKK1910 | 10 03 43.5 | -66 12 04 | 287.11 | -8.63 | S | M | 40x | 12 | 16.8 | 0.22 | 49 | 15.8 | 600 | – | 10000 | 3.3 | ||||||||
| RKK1963 | L092-010 | I | 10 07 00.2 | -64 21 47 | 286.28 | -6.95 | S | 3 | 74x | 74 | 14.3 | 0.22 | 90 | 13.3 | 300 | – | 5000 | 3.3 | 57 (1) | |||||
| RKK1995 | 10 08 42.8 | -61 26 19 | 284.72 | -4.46 | S | 34x | 20 | 16.3 | 0.37 | 55 | 14.5 | 600 | – | 10000 | 3.4 | 7000 | – | 7200 | ||||||
| RKK2017 | HEN373 | I | 10 10 02.5 | -57 01 54 | 282.30 | -.77 | S | 67x | 27 | 15.8 | 6.30 | 999 | 3.6 | 600 | – | 10000 | 4.5 | 7500 | – | 8800 | ||||
| RKK2095 | I | 10 13 25.5 | -52 31 21 | 280.12 | 3.21 | S | 3 | 40x | 20 | 16.0 | 0.54 | 99 | 13.2 | 400 | – | 5400 | 2.8 | 8576 (2) | ||||||
| RKK2118 | 10 13 43.3 | -62 21 05 | 285.73 | -4.87 | S | 5 | 54x | 5 | 17.6 | 0.35 | 82 | 16.0 | 500 | – | 10000 | 3.7 | ||||||||
| RKK2142 | 10 14 53.4 | -47 43 52 | 277.59 | 7.29 | S | B | 4 | 40x | 20 | 16.2 | 0.19 | 47 | 15.4 | 600 | – | 10000 | 3.3 | |||||||
| RKK2154 | 10 14 58.3 | -62 22 05 | 285.86 | -4.80 | S | 40x | 34 | 16.2 | 0.37 | 63 | 14.5 | 600 | – | 10000 | 2.6 | |||||||||
| RKK2157 | 10 15 28.3 | -51 19 23 | 279.71 | 4.38 | S | M | 34x | 23 | 16.1 | 0.47 | 74 | 13.6 | 600 | – | 5600 | 2.8 | 14078 (M) | |||||||
| RKK2168 | 10 15 31.4 | -61 47 32 | 285.58 | -4.29 | S | L | 54x | 11 | 16.5 | 0.43 | 102 | 14.4 | 400 | – | 5600 | 2.3 | ||||||||
| RKK2173 | 10 16 03.5 | -52 10 11 | 280.26 | 3.73 | S | 40x | 5 | 18.2 | 0.46 | 81 | 15.9 | 500 | – | 9500 | 2.9 | 9500 | – | 10200 | ||||||
| RKK2198 | 10 16 45.8 | -53 31 02 | 281.10 | 2.67 | S | 27x | 9 | 17.9 | 0.64 | 90 | 14.5 | 600 | – | 10200 | 3.2 | 1100 | – | 1600 | ||||||
| 7400 | – | 7600 | ||||||||||||||||||||||
| RKK2310 | I | 10 19 25.8 | -60 59 18 | 285.53 | -3.36 | E | 54x | 24 | 15.2 | 0.79 | 216 | 11.3 | 600 | – | 10000 | 3.6 | ||||||||
| RKK2317 | I | 10 19 53.3 | -47 47 28 | 278.33 | 7.71 | S | M | 40x | 22 | 16.4 | 0.15 | 44 | 15.8 | 600 | – | 10000 | 2.3 | 17819 (3) | ||||||
| RKK2337 | 10 20 27.7 | -49 22 54 | 279.29 | 6.43 | I | M | 59x | 40 | 15.6 | 0.26 | 77 | 14.4 | 600 | – | 13000 | 3.6 | ||||||||
| RKK2361 | 10 21 11.5 | -50 45 30 | 280.14 | 5.34 | S | M | 34x | 24 | 16.4 | 0.34 | 52 | 14.8 | 500 | – | 5500 | 2.2 | ||||||||
| RKK2380 | I | 10 21 40.8 | -49 36 53 | 279.58 | 6.35 | 40x | 30 | 16.3 | 0.23 | 50 | 15.3 | 600 | – | 10000 | 3.4 | 7800 | – | 8400 | 14741 (3) | |||||
| RKK2391 | 10 22 01.0 | -49 35 53 | 279.62 | 6.39 | 44x | 16 | 17.4 | 0.24 | 55 | 16.4 | 800 | – | 10000 | 3.6 | 1200 | – | 1300 | |||||||
| Ident. | Other | IR | R.A. | Dec. | gal | gal | Type | x | ||||||||||||||||
| (h m s) | (∘ ′ ′′) | (∘) | (∘) | (′′) | (m) | (m) | (′′) | (m) | km/s | m Jy | km/s | km/s | ||||||||||||
| (1) | (2) | (3) | (4) | (5) | (6) | (7) | (8) | (9) | (10) | (11) | (12) | (13) | (14) | (15) | (16) | (17) | ||||||||
| RKK2445 | 10 23 50.5 | -48 12 25 | 279.12 | 7.72 | S | R | 2 | 34x | 34 | 16.2 | 0.16 | 38 | 15.5 | 600 | – | 5500 | 2.6 | |||||||
| RKK2459 | 10 24 16.6 | -49 54 27 | 280.10 | 6.33 | S | 42x | 7 | 17.8 | 0.32 | 61 | 16.3 | 700 | – | 10000 | 3.3 | 7900 | – | 8300 | ||||||
| RKK2525a | L214-005 | I | 10 26 54.7 | -49 08 53 | 280.06 | 7.20 | S | 3 | 47x | 20 | 16.2 | 0.29 | 64 | 14.9 | 600 | – | 12800 | 6.2 | 3600 | – | 4600 | 14450 (6) | ||
| RKK2512 | Q | 10 26 10.3 | -53 46 55 | 282.42 | 3.20 | F | 27x | 27 | 16.1 | 0.50 | 60 | 13.6 | 600 | – | 5600 | 3.7 | ||||||||
| RKK2549 | 10 27 24.2 | -50 28 34 | 280.83 | 6.11 | S | 5 | 38x | 22 | 16.7 | 0.26 | 49 | 15.6 | 400 | – | 10200 | 3.6 | 1200 | – | 1600 | 15934 (M) | ||||
| RKK2588 | I | 10 28 05.3 | -64 29 15 | 288.25 | -5.78 | S | 39x | 20 | 16.9 | 0.66 | 151 | 13.1 | 400 | – | 10000 | 3.2 | 1900 | – | 2250 | |||||
| RKK2592 | 10 28 40.8 | -49 28 48 | 280.48 | 7.07 | 47x | 34 | 15.6 | 0.33 | 69 | 14.1 | 500 | – | 12800 | 2.9 | 17975 (M) | |||||||||
| RKK2598a | L214-011 | 10 28 48.1 | -50 41 57 | 281.14 | 6.04 | S | 1 | 67x | 32 | 15.4 | 0.29 | 91 | 14.1 | 4000 | – | 12800 | 2.7 | 6305 (1) | ||||||
| RKK2603 | 10 29 3.3 | -51 41 21 | 281.69 | 5.21 | S | M | 38x | 27 | 16.4 | 0.25 | 49 | 15.3 | 600 | – | 10000 | 3.9 | 19557 (M) | |||||||
| RKK2649 | P | 10 30 54.4 | -51 22 20 | 281.77 | 5.63 | S | M | 36x | 27 | 16.4 | 0.40 | 63 | 14.5 | 800 | – | 5500 | 4.3 | |||||||
| RKK2663a | 10 31 28.9 | -63 44 07 | 288.18 | -4.95 | S | L | 50x | 8 | 17.4 | 0.47 | 104 | 15.0 | 1000 | – | 10000 | 8.5 | (7300 | – | 8500) | |||||
| RKK2743 | 10 36 05.2 | -50 14 16 | 281.90 | 7.02 | S | M | 31x | 28 | 16.4 | 0.41 | 52 | 14.6 | 600 | – | 10200 | 2.8 | 1200 | – | 1600 | |||||
| 7400 | – | 7700 | ||||||||||||||||||||||
| 9800 | – | 10000 | ||||||||||||||||||||||
| RKK2774 | I | 10 39 00.8 | -50 25 18 | 282.40 | 7.10 | S | B | 3 | 43x | 31 | 15.7 | 0.55 | 107 | 12.9 | 600 | – | 5600 | 3.2 | 1200 | – | 1400 | 7181 (4) | ||
| RKK2778 | 10 39 15.6 | -52 26 16 | 283.43 | 5.36 | S | 40x | 20 | 16.6 | 0.44 | 75 | 14.5 | 500 | – | 10000 | 4.3 | 7000 | – | 7200 | ||||||
| RKK2784 | 10 39 44.2 | -50 32 06 | 282.56 | 7.05 | S | R | M | 43x | 40 | 16.2 | 0.53 | 103 | 13.5 | 500 | – | 5600 | 2.6 | |||||||
| RKK2797 | 10 40 34.4 | -49 25 01 | 282.13 | 8.10 | I | 9 | 42x | 31 | 16.1 | 0.38 | 69 | 14.3 | 400 | – | 5600 | 2.8 | ||||||||
| RKK2807 | 10 41 31.6 | -51 32 32 | 283.30 | 6.31 | S | 43x | 9 | 17.5 | 0.44 | 82 | 15.4 | 400 | – | 10000 | 3.7 | |||||||||
| RKK2841 | 10 47 19.5 | -50 28 56 | 283.60 | 7.67 | S | 2 | 47x | 15 | 16.6 | 0.42 | 86 | 14.6 | 400 | – | 9900 | 2.9 | 1100 | – | 1300 | |||||
| 1900 | – | 2100 | ||||||||||||||||||||||
| RKK2845 | 10 48 07.7 | -50 29 47 | 283.73 | 7.72 | S | L | 47x | 17 | 16.5 | 0.43 | 89 | 14.4 | 600 | – | 5600 | 2.4 | ||||||||
| RKK2895 | I | 11 10 05.9 | -67 23 40 | 293.40 | -6.42 | S | B | 3 | 74x | 40 | 15.6 | 0.35 | 114 | 14.0 | 600 | – | 12800 | 4.5 | ||||||
| RKK2896 | Q | 11 12 10.1 | -57 33 11 | 289.90 | 2.79 | S | 30x | 3 | 18.8 | 0.86 | 229 | 13.5 | 800 | – | 5600 | 2.0 | ||||||||
| RKK2931 | 11 20 21.9 | -59 10 26 | 291.49 | 1.66 | S | 40x | 11 | 17.0 | 0.79 | 213 | 12.5 | 400 | – | 10000 | 4.2 | |||||||||
| RKK2967 | 11 24 17.4 | -56 17 06 | 291.00 | 4.56 | S | M | 74x | 40 | 15.3 | 0.41 | 126 | 13.4 | 400 | – | 10300 | 2.9 | 1000 | – | 1200 | |||||
| RKK2976 | 11 24 51.5 | -57 11 15 | 291.38 | 3.73 | S | 74x | 60 | 15.1 | 0.38 | 120 | 13.3 | 600 | – | 12800 | 3.7 | |||||||||
1600 km s-1 – hence similar to the determination for detections – centered at increasingly higher redshifts in order to obtain values for the whole velocity range. The quoted values represent the highest rms for the velocity intervals, the rms for the nearer velocities are on average a bit lower.
Col. 16: Perturbed velocity intervals, mainly due to recurring rfi around 1250 and 4450 km s-1 and very strong GPS signals around 8300 km s-1. In these intervals a signal would have gone unnoticed. Narrow interference patterns that are not likely to hide the H I emission of a galaxy are not marked in this column.
Col. 17: Independent velocity determinations for the non-detected galaxies. The reference coding is the same as in Table 1 with the addition of M, which stands for observations made with the multifiber spectrograph MEFOS at the 3.6 m telescope of ESO which will be published shortly (Woudt et al. 2002). These velocities reveal that the non-detections are either beyond the covered velocity range or so distant that their signals would be too weak for detection with the achieved noise level.
4.1 Signals in the spectra of non-detectons
Some of the spectra of the non-detections listed in Table 2 do reveal a positive signal. Comparing the recession velocities with independent optical data proves, however, that the observed H I emission in four of the pointings does not originate from the targeted object but from a neighbour at close angular distance. This concerns the following spectra:
RKK 1284: At this pointing the H I emission dominating the spectrum stems from the nearby () large spiral galaxy RKK 1288 = ESO 091-011 at 3197 km s-1, as confirmed by its optically determined redshift of 3192 km s-1 (see column 19 in Table 1). However, underneath the broad signal ( km s-1) there is an indication of a narrower signal ( km s-1) at a slightly lower velocity (3117 km s-1). Synthesis observations are required to confirm whether this signal is real and due to RKK 1284.
RKK 2525: Our observations find a weak, although clear H I detection at 5482 km s-1 which was confirmed in a repeat observation. However, RKK 2525 has a velocity listed in the 1992 NED compilation (without a source) of 14 450 km s-1 which is independently confirmed by our multifiber spectroscopy observations obtained with MEFOS at the 3.6 m telescope of ESO (Woudt et al. 2002). The most likely object for the observed H I emission is the fairly edge-on galaxy RKK 2546 at which has an optical velocity of km s-1 (Kraan-Korteweg et al. 1995).
RKK 2598 (= ESO 214-11): The signal identified at this pointing is a weaker replica of the profile found for the galaxy RKK 2585 at a separation of (see Table 1 and Fig. 1. The velocity of RKK 2585 has been confirmed in the optical ( km s-1) whereas the optical velocity for RKK 2598 is 6305 km s-1, considerably lower than the H I measurement (7027 km s-1). There is no signal in the spectrum near the optical redshift even though the galaxy is quite large, but it is classified as an Sa.
RKK 2663 is a similar case. The detection at = 3759 km s-1 of = 6.38 Jy km s-1 is due to the galaxy RKK 2684 = ESO 092-019 also detected here (see Table 1 and Fig. 1) and its origin is confirmed by the optical velocity of the latter.
5 Description of the observed sample
We observed mainly extended, LSB galaxies – either galaxies that are intrinsically LSB or galaxies reduced in size and surface brightness due to the heavy foreground obscuration, for which optical spectroscopy will not yield good S/N spectra. Furthermore, observations were made of nearby spiral galaxies with known optical redshifts but for which no prior H I observations existed. These were selected such that all spiral galaxies with an extinction-corrected diameter will have been observed in the 21 cm line. The resulting H I sample forms part of our project to map the peculiar velocity field in the ZOA via the near infrared Tully–Fisher relation.
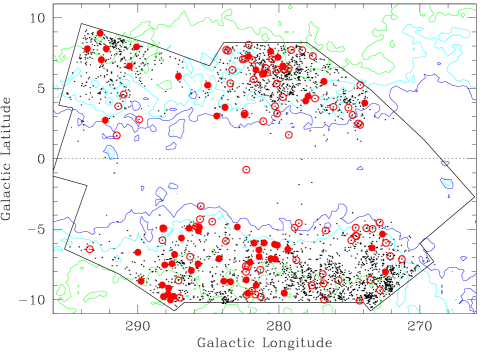
Fig. 4 shows the Hydra/Antlia search area (outlined region) with the 3279 optically discovered galaxies with plotted as small dots. The displayed extinction contours are equivalent to absorption levels in the blue of 0, 20 and 30. The figure demonstrates the effectiveness of optical galaxy searches in reducing the ZOA and revealing the underlying large-scale distribution of galaxies at least to extinction levels of (at the highest extinction levels, only blind H I surveys are successful in tracing large-scale structure in the nearby Universe). The 139 galaxies observed with the Parkes radio telescope are indicated with big symbols: filled circles illustrate detections and open circles the non-detections. An inspection of the pointings within the survey region show them to be distributed quite homogeneously over the galaxy distribution.
There are clear discrepancies, however, between the distribution of the detections compared to the non-detections. These can be completely attributed to different large-scale structures (LSS) crossing the Galactic Plane (GP) in this region. As found from the individual (Fairall et al. 1998) and multifibre spectroscopy (Kraan-Korteweg et al. 1994, Woudt et al. 2002), the concentration of galaxies below the GP in the longitude range is primarily due to clustering at high redshifts, i.e. at and km s-1 (see also column 17, Table 2), hence beyond our H I velocity search range and sensitivity limit. Similarly, the scarcity of detections in the dense region above the Galactic equator around can be explained by the fact the we expect to detect only spiral galaxies related to the Hydra/Antlia filament ( km s-1) and the H I-richest galaxies belonging to the Vela supercluster ( km s-1), but none of the galaxies at about 16 000 km s-1 which also form part of that condensation.
Besides the effects of large-scale structure in the distribution of detections versus non-detections, Fig. 4 seems to support the interpretation that the H I detection rate is independent of latitude, and thus, of extinction. An analysis of the detection versus non-detection rate as a function of extinction (not shown here) confirms this.

Figure 5 illustrates the typical properties of the observed galaxy sample. The top panels show the distribution of the observed magnitudes () and diameters () divided into detections (bold line) and non-detections (dashed line). We can see a clear offset in the distribution of the detections ( and ) compared to the non-detections ( and ) with the detections being nearly 1 magnitude brighter and typically 1 1/2 times larger. This is an expected trend for observations unaffected by obscuration, but not a correct interpretation in our case. Here, most of the selected smaller and fainter galaxies are objects that are seen through a thick extinction layer and hence are intrinsically large. This can be visualized by comparing the top panels of Fig. 5 with the bottom panels. The latter show the same histograms but with the parameters corrected for extinction according to Cameron’s law (1990). The mean apparent magnitude of the total sample is brighter by about 2 magnitudes (from to ) and the diameters larger by a factor of nearly 2 (from to ), hence a sample of the intrinsically brightest and largest spiral galaxies in the ZOA. As the H I emission is not hindered by dust, detections of these objects should be equally likely.

It might thus seem a bit surprising that a fair fraction () of the brighter () and extended (, ) observed spiral galaxy sample was not detected in H I (see bottom panels). A closer inspection of the brightest and largest of these non-detections reveals that they stem from pointings to extremely obscured objects at high Galactic extinctions (). The Cameron corrections to the true apparent sizes become very large (e.g. a factor of for the diameters for ) and increasingly uncertain. Moreover, with such heavy absorption, the morphological classifications of these objects remains guesswork. Some of these objects might not be spiral galaxies – or galaxies at all. Taking this into account, i.e. ignoring the few heavily obscured, possibly misclassified objects at extreme extinctions, our interpretation of Fig. 5 is that the H I observations yield a high detection rate and are very powerful in tracing the nearby bright spiral galaxy population across the Milky Way. Indeed, the average H I mass of the detected sample, , and the distribution of H I masses of the detected objects, shown in Fig. 6, indicate the detected galaxies are mostly normal spirals, with a smaller number of lower H I mass objects.
6 Large-scale structure in the Hydra/Antlia-region
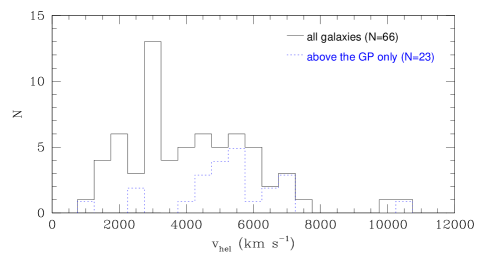
Figure 7 shows a histogram of the radial velocities (heliocentric) of the 66 H I detections. The distribution indicates that our sensitivity of typically rms m Jy results in a fair coverage of the galaxy distribution out to redshifts of about km s-1 but does not probe the Universe well beyond that distance. The distribution does not match the expectation for a homogenously filled volume. Due to the different structures present in this volume (see discussion below) it is very flat in the velocity range km s-1 except for a distinct peak at km s-1. The latter is the signature from the extension of the Hydra/Antlia filament on the opposite side of the Galactic Plane, which we confirm with this work.
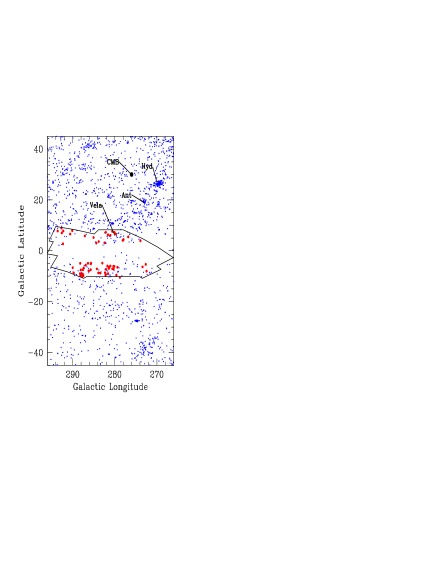
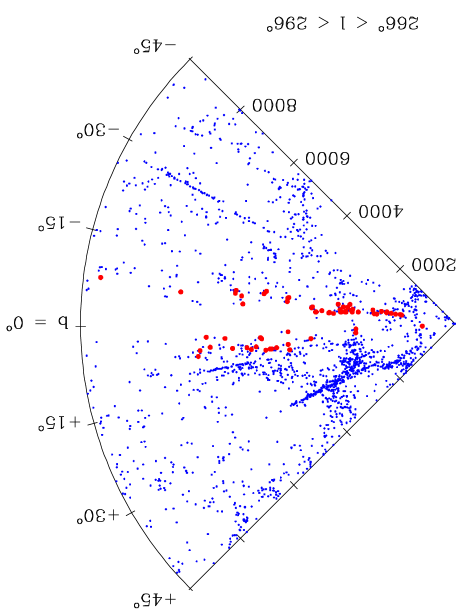
To visualize how the new detections add to our comprehension of LSS in this region of the sky, we have combined the new data with other data in and surrounding this area. Fig. 8 displays galaxies extracted from the LEDA database with km s-1 and (small dots) centered on the galaxy search area including the new H I detections as well (large filled circles). The left panel shows the resulting sky projection in Galactic coordinates. The main features in this region and volume, the Hydra and Antlia clusters, the Vela supercluster and the dipole direction of the Cosmic Microwave Background (CMB) radiation (Kogut et al. 1993), are labelled for orientation. It is obvious that the new data add considerably to the velocity data in the ZOA even though the LEDA database already includes the optical spectroscopy obtained by us in the search area.
Studying the new data and its distribution in space in more detail, we find that the clumpiness of the H I detections seen in the sky projection is due to four main distinct LSS features, whereas the mainly empty regions are due to galaxies which belong to structures that cross the GP at higher redshifts, – evident as the high rate of non-detections in those regions.
Astonishingly, only 2 of the detections above the GP around form part of the suspected filament from the Hydra and Antlia clusters across the ZOA. The other detections all lie within 5000 km s-1 to 7000 km s-1 and thus are members of the Vela Supercluster.
The galaxies in the upper left-hand corner of the search area lie within a very narrow velocity range ( km s-1). They belong to the Norma Supercluster (or Great Attractor overdensity) and lie on the edge of this very broad extended wall-like structure which has the Norma cluster (ACO 3627) at its center, and crosses the GP at fairly flat angle towards the Vela Supercluster (Fairall et al. 1998).
The galaxies below the GP with velocities km s-1 are located in the galaxy concentration at (see left panel). The redshift cone indicates that they form part of the surface which outlines a void centered at km s-1 and latitude.
Although only 2 galaxies were detected above the GP at that form part of the Hydra/Antlia extension, practically all the galaxies below the plane at these longitudes are found within the narrow velocity range of km s-1. These data therefore seem to support the existence of a filamentary structure that stretches from the Hydra cluster at ( km s-1) to the Antlia cluster ( km s-1), continues across the GP (this bridge is confirmed in the preliminary analysis of the Parkes deep ZOA H I survey, Staveley-Smith, priv. comm.) and emerges on the opposite side as an agglomeration of galaxies at about ( km s-1). Whether it stops there – marking yet another boundary of the previously mentioned void – or continues even further along the surface on another bubble (centered at 3500 km s-1 and ) is uncertain.
The newly revealed and substantiated structures seen in Fig. 8 confirm that H I observations of highly obscured spiral galaxies are an important tool in mapping large-scale structures hidden by the Milky Way since the H I observations probe deeper into the ZOA than do optical spectroscopic observations.
7 Summary
The pointed 21-cm line observations of partially- to heavily-obscured spiral galaxies uncovered in the deep optical search for galaxies in the ZOA has proven this technique to be very powerful for mapping a population of galaxies – which on average actually are intrinsically large and bright – whose redshifts would be difficult or impossible to obtain otherwise.
Besides the chance detection of a few galaxies without optical counterparts (see Sect. 3.1), the 66 detections – and the distribution of the non-detections – have helped to delimit a number of suspected or previously unknown large-scale structures, in particular the continuation of the Hydra/Antlia bridge across the GP and the void with a radius of about 1000 km s-1 centered in the ZOA at about 2000 km s-1.
These HI-observations helped reduce the width of the ZOA in redshift space. They will also be invaluable in mapping the peculiar velocity field in the ZOA. The missing gap in LSS () will be filled with the detections from the deep ZOA survey that is being carried out, at similar sensitivities, with the multibeam receiver on the Parkes radiotelescope.
Acknowledgements.
It is with pleasure that we thank the ATNF staff at the Parkes telescope for their high quality and cheerful support during our observing runs. Part of this survey was performed at the Kapteyn Astronomical Institute of the University of Groningen and at the Observatoire de Paris-Meudon. Their support is greatfully acknowledged. RCKK thanks CONACyT for their support (research grant 27602E). During much of this work, the research of PH was supported by NSF Faculty Early Career Development (CAREER) Program award AST 95-02268. We have also made use of the Lyon-Meudon Extragalactic Database (LEDA), supplied by the LEDA team at the Centre de Recherche Astronomique de Lyon, Observatoire de Lyon, and of the NASA/IPAC Extragalactic Database (NED), which is operated by the Jet Propulsion Laboratory, Caltech, under contract with the National Aeronautics and Space Administration.References
- (1) Arp H.C., Madore B.F. 1987, A Catalog of Southern Peculiar Galaxies and Associations, Cambridge: Cambridge University Press
- (2) Cameron L.M. 1990, A&A 233, 16
- (3) Cardelli J.A., Clayton G.C., Mathis J.S. 1989, ApJ 345, 245
- (4) Davies R.D., Staveley-Smith L., Murray, 1989, MNRAS 236, 171
- (5) Dressler A. 1991, ApJS 75, 241
- (6) Epchtein, N. 1997, in 2nd Euroconference, The Impact of Large Scale Near-Infrared Surveys, eds. F. Garzón et al., (Dordrecht: Kluwer), 15
- (7) Epchtein, N., Batz, B. de, Capoani, L., et al. 1997, Messenger, 87, 27
- (8) Fairall A.P., Woudt P.A., Kraan-Korteweg R.C. 1998, A&ASS 127, 463
- (9) Felenbok P., Guérin J., Fernandez A. et al. 1997, Exp. Astron. 7, 65
- (10) Fisher K.B., Huchra J., Davis M. et al. 1995, ApJS 100, 69
- (11) Fouqué P., Chevallier L., Cohen M. et al. 2000, A&ASS 141, 313
- (12) Gordon S. 2002, PhD Thesis, University of Queensland, submitted
- (13) Gordon S., Koribalski B., Jones K. 2002, to be submitted to MNRAS
- (14) Henning P.A., Staveley-Smith L., Ekers R.D. et al. 2000, AJ 119, 2686
- (15) Huchtmeier W.K., Richter O.-G. 1989, A General Catalog of H I Observations of Galaxies, Springer Verlag, New York, 1989
- (16) Joint IRAS Science Working Group 1988, IRAS Point Source Catalog, Version 2 (Washington: US Govt. Printing Office) (IRAS PSC)
- (17) Lauberts A. 1982, The ESO/Uppsala Survey of the ESO (B) Atlas, ESO: Garching
- (18) Mamon, G.A., Tricottet, M., Bonin, W., & Banchet, V. 1997b, in XVIIth Moriond Astrophysics Meeting, Extragalactic Astronomy in the Infrared, eds. G. A. Mamon, Trinh Xuân Thuân, & J. Trân Thanh Vân, (Gif-sur-Yvette: Editions Frontières), 369
- (19) Karachentsev I.D., Karachentseva V.E., Parnovsky S.L. 1993, Flat Galaxy Catalog, ANac 314, 97
- (20) Kogut A., Lineweaver C., Smoot G.F., et al. 1993, ApJ 419, 1
- (21) Kraan-Korteweg R.C. 2000a, A&ASS 141, 123
- (22) Kraan-Korteweg R.C., Lahav, O. 2000, A&ARv 10, 211
- (23) Kraan-Korteweg R.C., Woudt P.A. 1993, in 9th IAP Astrophysics Meeting on “Cosmic Velocity Fields”, eds. F. Bouchet & M. Lachièze-Rey, Ed. Frontières, Gif-sur-Yvette, 557
- (24) Kraan-Korteweg R.C., Woudt P.A. 2001, A&A 380, 441
- (25) Kraan-Korteweg R.C., Cayatte V., Fairall A.P. et al. 1994, in Unveiling Large-Scale Structures behind the Milky Way, eds. C. Balkowski & R.C. Kraan-Korteweg, ASP Conf. Ser. 67, 99
- (26) Kraan-Korteweg R.C., Fairall A.P., Balkowski C. 1995, A&A 297, 617
- (27) Kraan-Korteweg R.C., Henning, P.A., Andernach, H. (eds.) 2000, Mapping the Hidden Universe: The Universe behind the Milky Way – The Universe in H I, ASP Conf. Ser. 218 (ASP: San Francisco)
- (28) Lauberts A., Valentijn E. 1989, The Surface Photometry Catalogue of the ESO/Uppsala Galaxies, Garching: ESO
- (29) Mamon, G. A. 1998, in XIVth IAP Astrophysics Meeting, Wide Field Surveys in Cosmology, eds. S. Colombi, Y. Mellier, & B. Raban, (Gif-sur-Yvette: Editions Frontières), 323
- (30) Schlegel D.J., Finkbeiner D.P., Davis M. 1998, ApJ 500, 525
- (31) Staveley-Smith L., 1985, PhD thesis, University of Manchester
- (32) Staveley-Smith L., Engel C., Webster, R.L. 2000a, in Mapping the Hidden Universe: The Universe behind the Milky Way – The Universe in HI, eds. R.C. Kraan-Korteweg, P.A. Henning & H. Andernach, ASP Conf. Ser. 218, 289
- (33) Staveley-Smith L., Juraszek, S., Henning, P.A., Koribalski, B.S., Kraan-Korteweg, R.C. 2000b, in Mapping the Hidden Universe: The Universe behind the Milky Way – The Universe in HI, eds. R.C. Kraan-Korteweg, P.A. Henning & H. Andernach, ASP Conf. Ser. 218, 207
- (34) Strauss M.A., Huchra J.P., Davis M. et al. 1992, ApJS 82, 29
- (35) Vaucouleurs G. de, Vaucouleurs A. de, Corwin H.G. 1976, 2nd Reference Catalogue of Bright Galaxies (RC2), University of Texas Press, Austin
- (36) Visvanathan N., Yamada T. 1996, ApJS 107, 521
- (37) Woudt P.A., Kraan-Korteweg R.C., Fairall A.P. 1999, A&A 352, 39
- (38) Woudt P.A., Kraan-Korteweg R.C., Cayatte C., Balkowski C. 2002, A&A, submitted
- (39) Yahil A., Tammann G.A., Sandage A. 1977, ApJ 217, 903