WHAM Observations of H from High Velocity Clouds: Are They Galactic or Extragalactic?
Abstract
It has been suggested that high velocity clouds may be distributed throughout the Local Group and are therefore not in general associated with the Milky Way galaxy. With the aim of testing this hypothesis, we have made observations in the H line of high velocity clouds selected as the most likely candidates for being at larger than average distances. We have found H emission from 4 out of 5 of the observed clouds, suggesting that the clouds under study are being illuminated by a Lyman continuum flux greater than that of the metagalactic ionizing radiation. Therefore, it appears likely that these clouds are in the Galactic halo and not distributed throughout the Local Group.
1 Introduction
Our understanding of the nature of high-velocity clouds (HVCs), defined as interstellar clouds moving at velocities not compatible with a simple model of differential Galactic rotation, is severely limited by our lack of knowledge of their distances. Except in a few isolated cases (see Wakker 2001), their distances are very poorly constrained. Several authors (Blitz et al. 1999; Braun & Burton 1999) have suggested that a subclass of the HVCs are dispersed throughout the Local group of galaxies, the remnants of its formation. This would place them much farther away (100 kpc to 1000 kpc) than other models that place them in the Galactic halo at 10 kpc distances (e.g. Oort 1970, Bregman 1980). Given their angular size and neutral column density, the larger distances would make them very massive objects.
We have tested this hypothesis by measuring the H intensity toward a collection of HVCs whose properties open the possibility that they may be at greater than average distances. If it is indeed true that these clouds lie at great distances from the Galaxy, their neutral gas should not be substantially ionized by the weak metagalactic ionizing flux. Weymann et al. (2001) set a 2 upper limit of 8 mR for the H intensity toward an intergalactic H I cloud and inferred upper limits to the metagalactic ionizing flux, , between 2.5 103 cm-2 s-1 and 1.0 104 cm-2 s-1 with a preferred value of 5 103 cm-2 s-1, the range resulting from uncertainties in the cloud geometry (see also Shull et al. 1999 for a review of constraints on ). However, if the cloud is in the vicinity of the Milky Way, a source of Lyman continuum photons, it will be more strongly ionized and therefore glowing in H (see Bland-Hawthorn & Maloney 1999). In this case the observations are a measure of the escape fraction of ionizing photons from the Milky Way, which is important both in understanding the radiation transfer within the Galaxy and for understanding the impact of the Galaxy on its environment.
2 Observations
We used the Wisconsin H-Alpha Mapper (WHAM) for all observations. This dual-etalon Fabry-Perot instrument is well suited to the task of measuring the extremely faint emission lines here investigated (Reynolds et al. 1998, Tufte 1997.) WHAM measures the spectrum of emission contained within the 1° observation beam with 12 km s-1 velocity resolution. The HVCs were carefully selected to be the most likely candidates for being Local Group clouds based on their properties in the Leiden/Dwingeloo Survey (LDS) (Hartmann & Burton 1997). The selection criterion included appropriate angular size: a compact cloud is more likely to be far away due to the correlation of angular size with distance, but if it is much smaller than the WHAM beam, then beam dilution reduces the detection threshold. The clouds are isolated from any of the larger HVC complexes or the Galactic H I in (,,) space. We also obtained guidance in selecting the observation directions from Blitz (private communication) and from the dynamical model simulating the formation of the Local Group presented by Blitz et al. (1999). The remnant fragments of H I in this model tend to loosely correlate with the axis formed by the Milky Way and Andromeda galaxies (see the upper portion of Figure 13 in Blitz et al. 1999). Also in the model, clouds in the general longitudinal vicinity of M31 and with negative Galactic latitudes have a strong tendency to have velocities -400 km s-1 Vlsr -200 km s-1 (see their Figure 14). Our observed clouds are clustered in this region of (, , ) space. Independent of the model, more extreme velocities are more likely to represent material not directly associated with our Galaxy. As a result of these considerations, the sightlines chosen are among the HVCs most likely to represent “Local Group” clouds.
A total of 17 sightlines toward 6 “clouds” were observed with exposure times per sightline ranging from 600s to 1800s. An “on - off” observing procedure was used to minimize the influence of faint terrestrial lines near H (see Tufte, Reynolds, & Haffner 1998 for further explanation of this method). For one of the clouds, HVC 231, we obtained inconclusive results (neither a detection nor a convincing upper limit), and this case is not included in the results below.
3 Results
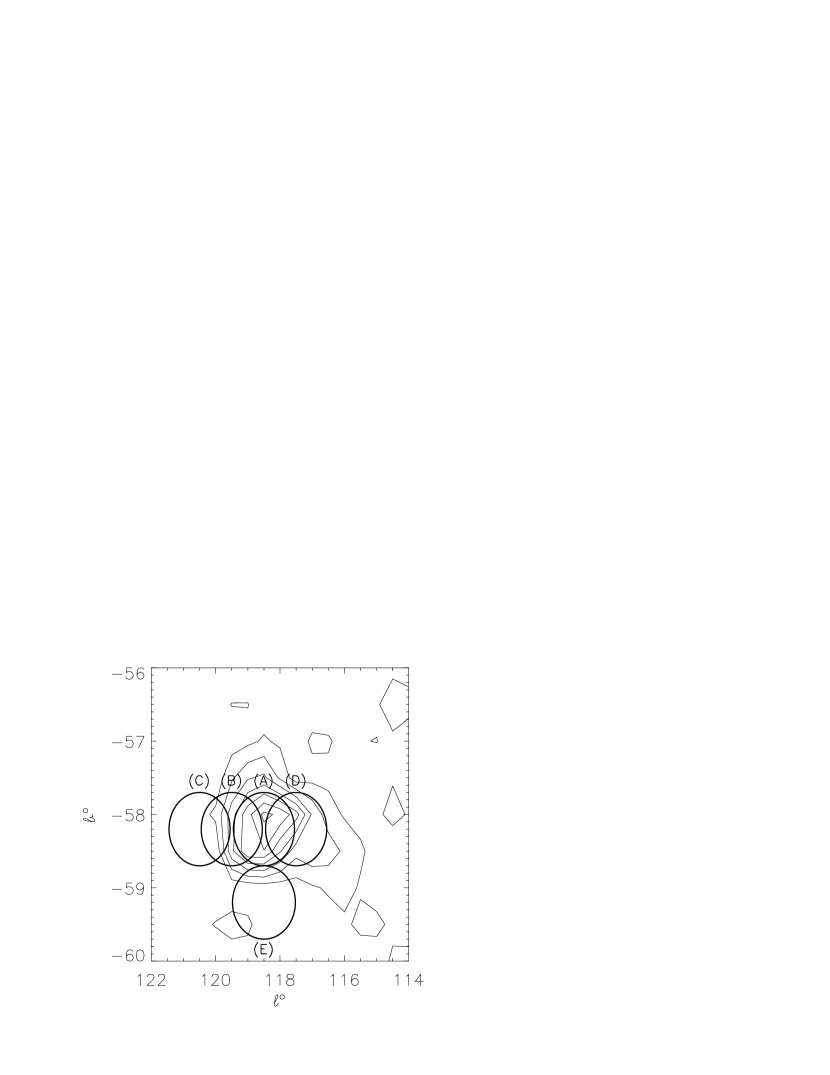
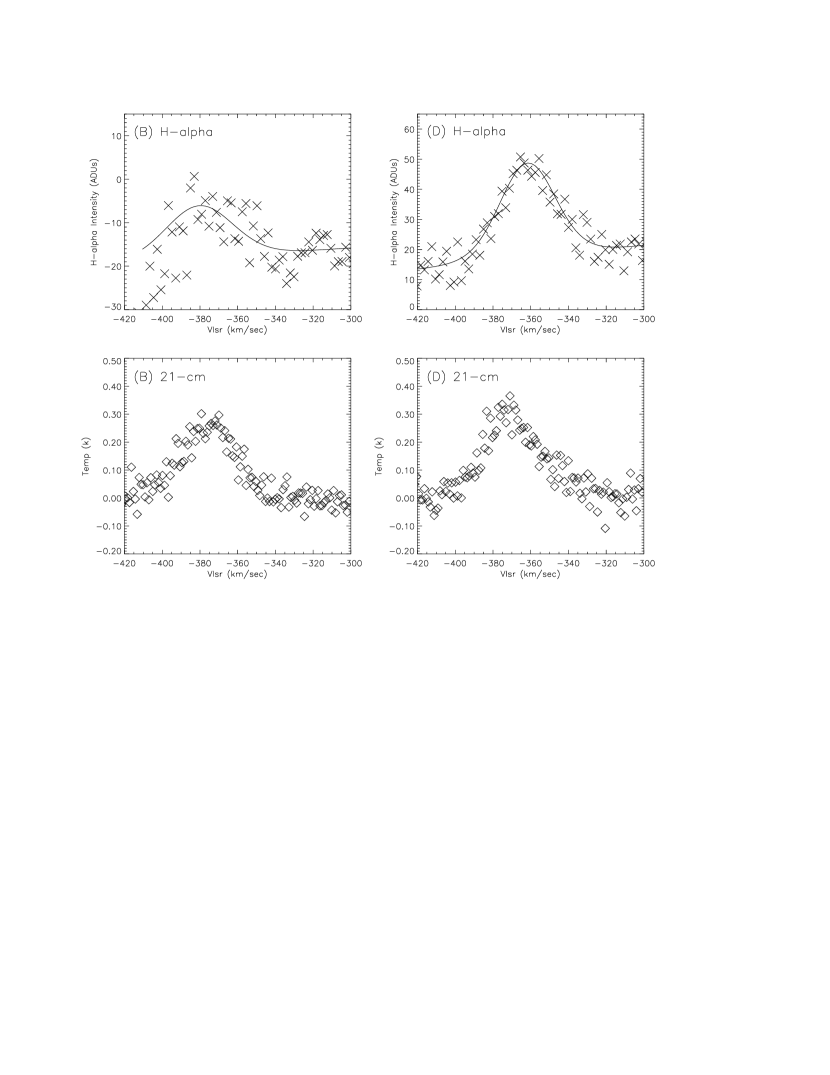
Four of the five clouds were detected in H, and for the fifth cloud we set a very low upper limit to the emission. Figure 1 shows the five H sightlines selected for HVC 532 overlayed on a contour map of the 21-cm intensity for this compact HVC. All 21-cm data are from the Leiden/Dwingeloo H I survey of Hartmann & Burton (1997). Figure 2 shows the H and 21-cm spectrum for beam (A). In the H spectrum a clear emission feature is seen with an intensity Iα = 0.14 0.01 R (1 R = 106 / 4 photons cm-2 s-1 sr-1). The H feature is in close correspondence to the 21-cm spectral feature, although it is wider and slightly shifted to lower negative LSR velocity. Figure 3 shows the H emission from directions (B) and (D) from Figure 1 in the upper panels with the corresponding 21-cm spectra below them. In direction (B) there is marginal evidence for H and in direction (D) there is clear evidence for H emission with an intensity of Iα = 0.12 0.01 R, similar to direction (A). In directions (C) and (E), no H was detected, indicating that the ionized gas does not extend much beyond the H I for this cloud.
Table 1 summarizes the results for all of the observations included in this work, including the HVC 532 results shown above. The H intensity toward HVC 486 is Iα = 0.13 0.04 R, similar to HVC 532. These intensities are strikingly similar to those measured toward the M, A, and C HVC complexes, which have intensities that range from 0.06 R to 0.20 R (Tufte et al. 1998), and which are believed to be in the Galactic halo (Wakker 2001). In the direction HVC 518 there is a clean detection of emission with Iα = 0.032 0.004 R, and there is also emission from HVC 444 at a similar level but with lower signal-to-noise. Since the uncertainty is usually governed by systematic effects (e.g. the inability to perfectly subtract off terrestrial emission lines) instead of photon statistics, the error bars were all obtained by experimenting with different fits to the data and monitoring the residuals to determine the range of emission parameters consistent with the data. For the non-detections, the results listed in Table 1 correspond to conservative 2 upper limits.
In one case, HVC 394, there is no evidence of H emission down to a very low level. Figure 4 shows the observation directions for this cloud overlaid on 21-cm contours. Figure 5 shows the H and 21-cm spectra for direction labeled (G) in Figure 4. There is no sign of an emission feature at the location of the 21-cm emission. The dotted line shows a hypothetical feature with an intensity of 0.02 R, considered here as an upper limit to the H emission for this direction. Table 1 shows that none of the directions showed emission, and in one case the upper limit is as low as Iα 0.01 R (2), one of the faintest limits yet achieved.
4 Discussion and Conclusions
Of the five candidate Local Group clouds for which we obtained good measurements, there is clear H emission from four. The intensities are around 0.1 R, typical of the intensities measured from the large HVC complexes thought to lie in the Galactic halo. We conclude from this that it is unlikely that these clouds are at 100 kpc distances from our Galaxy, because the metagalactic ionizing flux level is below that needed to produce the observed H surface brightness of even the faintest of the detections. If they are “Local Group” objects, then the metagalactic ionizing flux needs to be much higher than previously thought. However, recent observations of the outer H I disk of M 31 (Madsen et al. 2001) appear to rule out such a large ionizing flux within the Local Group. It is more likely that these clouds are not at great distances, but are instead in the Galactic halo and being ionized by the Milky Way. If this latter scenario is true, these observations support a picture where the distribution of ionizing flux percolating through the disk is somewhat patchy and the Lyman continuum flux, FLC, incident onto a cloud from the Galactic plane averages FLC 2 105 cm-2 s-1 (assuming 0.1 R as a representative H intensity; see Tufte et al. 1998).
The extreme faintness of H from HVC 394 place this measurement among the lowest upper limits to the metagalactic radiation field, comparable to the measurements of Madsen et al. 2001, Weymann et al. 2001, and Vogel et al 1995. Since the H I cloud is optically thick in the Lyman continuum and optically thin to H photons, each Lyman continuum photon incident on the cloud will ionize a hydrogen atom, and each hydrogen recombination will produce on average 0.46 H photons (Martin 1988; Pengally 1964; case B, T = 104 K). If we assume that all of the H arises from gas photoionized by a uniform isotropic metagalactic ionizing flux, then the upper limit on Iα provides direct constraints on this quantity. Since the WHAM beam is easily contained within the H I cloud (see beam F in Figure 4), the metagalactic ionizing flux generates observable H from the front and back faces of the cloud and we approximate the geometry as a plane slab viewed normally. Under these assumptions, the measured upper limit for HVC 394 of Iα 0.01 R corresponds to an upper limit to the metagalactic ionizing flux 1.1 104 photons cm-2 s-1, where is the incident one-sided ionizing flux defined by Vogel et al. 1995 and Madsen et al. 2001. If other processes contribute to ionizing hydrogen in this cloud, then must be even lower.
Perhaps HVC 518 and HVC 444 are fainter in H because they are further away than HVC 532, HVC 486, and the M, A, and C complexes. However, with the exception of HVC 394, these results all suggest that the clouds are located in the halo rather than the intergalactic medium. Corroborating evidence comes from the recent H observations of Weiner et al. (2001) of a different set of compact clouds, where they found intensities ranging from 0.04 R to 1.6 R, with no well-measured clouds showing non-detections. The strength of these conclusions are currently limited by the relatively small number of clouds sampled, and further observations of the compact HVCs will be necessary to increase the statistics. Also, observations in other emission lines such as [S II], [N II], and [O III] should help to illuminate further the characteristics of the compact population of HVCs and their relationship to the major complexes.
We are grateful to Dr. Leo Blitz for constant encouragement and support, and for his help in selecting HVCs to observe. S. L. T. and J. D. W. acknowledge support from Research Corporation through a Cottrell College Science Award. G. J. M., L. M. H., and R. J. R. acknowledge support from the National Science Foundation through grant AST 96-19424.
References
- Bland-Hawthorn & Maloney (1999) Bland-Hawthorn, J., & Maloney, P. R. 1999, ApJ, 510, L33.
- Blitz et al. (1999) Blitz, L., Spergel, D. N., Teuben, P. J., Hartmann, D., & Burton, W. B. 1999, ApJ, 514, 818.
- Braun & Burton (1999) Braun, R., & Burton, W. B. 1999, A&A, 341, 437.
- Bregman (1980) Bregman, J. N. 1980, ApJ, 236, 577.
- Haffner, Reynolds, & Tufte (1999) Haffner, L. M., Reynolds, R. J., & Tufte, S. L. 1999, ApJ, 523, 223.
- Hartmann & Burton (1997) Hartmann, D., & Burton, W. B. 1997, Atlas of Galactic Neutral Hydrogen (Cambridge: Cambridge University Press).
- Madsen et al. (2001) Madsen, G. J., Reynolds, R. J., Haffner, L. M., Tufte, S. L., & Maloney, P. R. 2001, ApJ, 560, L135.
- Oort (1970) Oort, J. H. 1970, A&A, 7, 381.
- Reynolds et al. (1998) Reynolds, R. J., Tufte, S. L., Haffner, L. M., Jaehnig, K., & Percival, J. W. 1998, PASA, 15, 14.
- Shull et al. (1999) Shull, J. M., Roberts, D., Giroux, M. L., Penton, S. V., & Fardal, M. A. 1999, AJ, 118, 1450.
- Tufte (1997) Tufte, S. L., PhD Dissertation, Univ. of Wisconsin - Madison.
- Tufte, Reynolds, & Haffner (1998) Tufte, S. L., Reynolds, R. J., & Haffner, L. M. 1998, ApJ, 504, 773.
- Vogel et al. (1995) Vogel, S. N., Weymann, R., Rauch, M., & Hamilton, T. 1995, ApJ, 441, 162.
- Wakker, B. P. (2001) Wakker, B. P. 2001, ApJS, 136, 463.
- Weiner et al. (2001) Weiner, B. J., Vogel, S. N., Williams, T. B. 2001, in Gas & Galaxy Evolution, ASP Conf. Proc., Vol. 240, eds. Hibbard, J. E., Rupen, M., & van Gorkom, J. H., 515.
- Weymann et al. (2001) Weymann, R. J., Vogel, S. N., Veilleux, S., & Epps, H. W. 2001, 561, 559.
| HVC | VHα(aaThe uncertainties in the velocities are 1 km s-1. | WHα(bbThe width parameters for H and 21-cm components are FWHM for Gaussian fits. | Iα() | VHI( | WHI( | () | ||
|---|---|---|---|---|---|---|---|---|
| 532 A | 118.5 | -58.2 | -369 | 483 | 0.140.01 | -374 | 28 | 3.1 |
| 532 B | 119.5 | -58.2 | -369 | 3817 | 0.040.01 | -375 | 33 | 1.6 |
| 532 C | 120.5 | -58.2 | -371 | |||||
| 532 D | 117.5 | -58.2 | -362 | 304 | 0.120.01 | -371 | 32 | 1.7 |
| 532 E | 118.5 | -59.2 | -371 | |||||
| 486 | 158.0 | -39.0 | -290 | 167 | 0.130.04 | -284 | 27 | 0.5 |
| 518 | 104.2 | -48 | -168 | 135 | 0.0320.004 | -170 | 25 | 0.6 |
| 444 | 119.2 | -30.8 | -382 | 43 15 | 0.020.01 | -386 | 20 | 1.1 |
| 394 F | 72 | -22 | -330 | -329 | 32 | 1.6 | ||
| 394 G | 71 | -22 | -330 | -332 | 25 | 1.9 | ||
| 394 H | 70 | -22 | -330 | -332 | 25 | 3.0 | ||
| 394 I | 73 | -22 | -330 | -326 | 23 | 0.8 | ||
| 394 J | 71 | -23 | -330 | -326 | 23 | 0.16 |