Kinematics of Diffuse Ionized Gas Halos: A Ballistic Model of Halo Rotation
Abstract
To better understand diffuse ionized gas kinematics and halo rotation in spiral galaxies, we have developed a model in which clouds are ejected from the disk and follow ballistic trajectories through the halo. The behavior of clouds in this model has been investigated thoroughly through a parameter space search and a study of individual cloud orbits. Synthetic velocity profiles have been generated in (height above the plane) from the models for the purpose of comparing with velocity centroid data from previously obtained long-slit spectra of the edge-on spirals NGC 891 (one slit) and NGC 5775 (two slits). In each case, a purely ballistic model is insufficient in explaining observed DIG kinematics. In the case of NGC 891, the observed vertical velocity gradient is not as steep as predicted by the model, possibly suggesting a source of coupling between disk and halo rotation or an outwardly directed pressure gradient. The ballistic model more successfully explains DIG kinematics observed in NGC 5775; however, it cannot explain the observed trend of high-z gas velocities nearly reaching the systemic velocity. Such behavior can be attributed to either an inwardly directed pressure gradient or a possible tidal interaction with its companion, NGC 5774. In addition, the ballistic model predicts that clouds move radially outward as they cycle through the halo. The mass and energy fluxes estimated from the model suggest this radially outward gas migration leads to a redistribution of material that may significantly affect the evolution of the ISM.
1 Introduction
The majority of the ionized gas in the interstellar medium of the Milky Way resides in a vertically extended layer known as the Reynolds Layer or Warm Ionized Medium (WIM). Photoionization by massive stars in the disk is likely the dominant source of energy input into the layer given its energetic requirements (Reynolds 1993) as well as the first order agreement between observed line ratios (Haffner, Reynolds, & Tufte 1999) and photoionization models (Domgörgen & Mathis 1994; Sokolowski 1994; Bland-Hawthorn et al. 1997; Sembach et al. 2000).
In external galaxies, where the layer is more commonly referred to as diffuse ionized gas (DIG), early work concentrated on the characterization and occurrence of these layers for “normal” galaxies (e.g. Rand, Kulkarni, & Hester 1990; Dettmar 1992; Ferguson, Wyse, & Gallagher 1996). A number of observational results suggest that local levels of star formation are responsible for these layers both in energizing the gas and in accelerating the gas upward via supernova activity and winds. Among the results supporting this conclusion are the correlation between layer prominence (in brightness and extent) and far-infrared luminosity (e.g. Rand 1996; Rossa & Dettmar 2000), and with tracers of star formation at other wavelengths (e.g. Dahlem, Dettmar, & Hummel 1994). Further evidence linking DIG halos to star formation includes the identification of DIG structures resembling the chimneys described by Norman & Ikeuchi (1989), which form when expanding supernova-driven supershells break through the main gaseous layers of a disk (e.g. Collins et. al. 2000). In recent years, the edge-ons NGC 891 and NGC 5775 have provided a wealth of information on the origin and excitation of gaseous halos. Each of these galaxies has relatively high rates of star formation as indicated by their far-infrared luminosities. NGC 5775 is classified as a starburst galaxy (Condon & Broderick 1988), though there is little evidence for a bright, nuclear starburst. DIG halos in these galaxies are considerably more extended in than the Reynolds Layer, and in the case of NGC 5775, DIG can be detected up to kpc (Rand 2000). In each of these galaxies, line ratio data indicate that a non-negligible fraction of DIG halo emission originates in a component that is either energized by an additional ionizing source such as shocks (e.g. Shull & McKee 1979) or is at a considerably higher temperature (e.g. Reynolds, Haffner, & Tufte 1999) than the bulk of halo DIG (Rand 1998; Tüllman et. al. 2000; Collins & Rand 2001).
Though significant research has been carried out regarding their energization, relatively little work has been pursued on the issue of rotation and support of these vertically extended layers through studies of DIG kinematics. Current evidence suggests that halo gas rotates more slowly than gas in the disk. In the case of NGC 891, the HI halo component appears to rotate 25-100 km s-1 more slowly than the disk component (Swaters et. al. 1997). In addition, the “bearded” HI position-velocity map of the intermediately inclined galaxy NGC 2403 has been successfully modeled as a superposition of a thin disk and a more slowly rotating thick halo (Schaap et. al. 2000; Fraternali et al. 2001). At higher-redshift, halo kinematics has been investigated through quasar absorption-line studies (e.g. Charlton & Churchill 1998). The recent results of Steidel et al. (2002) are consistent with a kinematic model where the QSO-absorbing gas resides in a halo which rotates more slowly than its parent galaxy.
However, though HI data cubes yield information for gas close to the midplane, they shed little light on gas kinematics at highest for low-redshift galaxies, which is better traced by the more extended ionized gas layer. In NGC 891 (Rand 1997) and NGC 5775 (Rand 2000; Tüllmann et. al. 2000), emission line centroids indicate a slow-down in DIG rotation with . However, in the case of NGC 891, Benjamin (2000) has found that the observed drop-off in rotation speed from to 5 kpc of km s-1 is considerably more shallow than the value of 80 km s-1 determined by assuming a fluid disk in hydrostatic equilibrium and calculating rotation speeds in a standard galactic potential. This calculated value is only weakly dependent on the choice of potential and is predominantly due to the geometric effect of a decrease in the projection of the radial gravitation vector with height above the disk. Higher order effects included in hydrodynamical models of halo kinematics, such as outwardly directed pressure gradients or a coupling between disk and halo through magnetic tension or viscosity, may resolve this discrepancy. However, in practice these effects are not well constrained given the lack of understanding on issues such as galactic magnetic field structure and gas densities.
Though a fluid disk in hydrostatic equilibrium is perhaps the simplest model one can adopt in considering halo kinematics, it assumes that the observed gas is dynamically coupled to the surrounding gas. This is not necessarily the case. An alternate point of view is that extraplanar gas consists of density concentrations sufficiently large that the motion is essentially ballistic. These clouds then cycle through the halo similar to Bregman’s (1980) galactic fountain return flow. Among the pieces of evidence that support such a picture is the fact that DIG layers are considerably thicker (by more than an order of magnitude) than the thermal scale height of 104 K gas in the gravitational field (e.g. Dettmar 1992) indicating turbulent motion and outflows, or, at the very least, a source of pressure support to maintain these thick layers. This fact, coupled with strong evidence of outflows in normal galaxies (e.g. Golla & Hummel 1994; Collins et al. 2000), indicate extensive cycling of material from disk to halo. Recent observations of a quasar projected at a height of kpc behind the halo of NGC 891 indicate a filling factor of low-ionization species (Mg II and Fe II) gas of around (E. Miller, private communication). This suggests a very clumpy medium if in fact this gas traces the DIG component, and lends some justification to treating the ISM as a collection of circulating clouds.
Towards the goal of a better understanding of DIG kinematics and halo rotation, we have developed an ISM model which assumes DIG is distributed in clouds which take ballistic trajectories as they move from disk to halo and back. We then attempt to compare velocity centroid data, obtained from previously presented long-slit data for NGC 891 (Rand 1997) and NGC 5775 (Rand 2000), with this ballistic cloud model. In all cases the slit is oriented perpendicular to the midplane so that these issues can be addressed as a function of . Further details of the observations can be found in the relevant references. The ballistic model is discussed in § 2. Data are compared to the model and results are discussed in § 3. Conclusions are summarized in § 4.
2 Ballistic Models of Gas Kinematics
In order to study how halo gas should rotate we have constructed a model to calculate cloud orbits for a given set of initial conditions. Using the potential model of Wolfire et. al. (1995), we calculate , and velocities for 2 clouds as they move from disk to halo and back again in this potential. The velocity at the flat part of the rotation curve, , is a free parameter that can be chosen to vary the potential according to the particular galaxy we wish to model. For NGC 891 and NGC 5775 we set to HI rotational velocities from the literature for each of these galaxies: km s-1 (Swaters et. al. 1997) and km s-1 (Irwin 1994), respectively.
We assume each cloud is initially located in the disk at a location determined by probability distributions in and :
| (1) |
and
| (2) |
These H disks have very sharp radial cut-offs. Thus to best match observational data, the radial scale length of the initial cloud distribution, , is chosen to be one-half the radius of the cut-off in the H emitting disk. From the H images we have set kpc for NGC 5775 (Collins et. al. 2000) and kpc for NGC 891 (Rand, Kulkarni, & Hester 1990). Each cloud is given a random vertical “kick” velocity in the direction, the probability distribution for which is uniform between zero and a chosen maximum kick velocity, , to simulate the initiation of a disk-halo cycle. In addition, the clouds are ejected at an angle, , from the vertical determined by the probability distribution:
| (3) |
We assume these clouds are non-interacting (no drag) and remain fully ionized throughout their orbits. We thus neglect any phase change that may occur such as conversion to HI in the halo. This model is therefore similar to the “cannonball” models considered by Wakker (1990) and Charlton & Salpeter (1989). This assumption is a major source of uncertainty in these models as hot and warm gas ejected from the disk is thought to be a source of the infalling high-velocity clouds (HVCs) observed in H I near the Milky Way (e.g. Wakker & van Woerden 1997). However, we have generated profiles assuming the clouds are ionized only during the upward part of their trajectory and find that any changes in mean velocity vs. are insignificant. When any of the 2 clouds returns to the midplane, a new cloud is put into play. After 1 Gyr, the sample of clouds is relaxed to an approximate steady state and spatial and velocity information for each cloud is extracted. Since we are considering a case without drag, these resulting values are independent of initial cloud mass, density, and temperature which are thus taken to be equal for each cloud. In addition, we make the further assumption that the density and temperature of each cloud does not change during orbit. With these assumptions the total H flux for any line of sight through the model is then simply proportional to the number of clouds intercepted by that line of sight.
The model is then placed at an inclination indicated by the HI data [ for NGC 891 (Swaters et. al. 1997) and for NGC 5775 (Irwin 1994)] and cloud properties are calculated for bins of 1 kpc extent along the major axis. Line of sight velocities are then averaged in 1 kpc bins in to generate a synthetic velocity profile versus . These velocities represent mainly rotation, though line of sight contributions from radial and, in the case of the not quite fully edge-on NGC 5775, vertical motions are included as well.
2.1 Parameter Space Search of Ballistic Models
To better understand the behavior of the model we have performed a restricted search of parameter space around what will be reported to be the best models for NGC 891 and NGC 5775. The free parameters that determine the behavior of cloud orbits are the maximum kick velocity, , the circular velocity, , the ejection cone angle, , the initial scale height of clouds, , and the initial radial distribution of clouds. The radial scale length of the initial cloud distribution, , is constrained by observations. However, we can still adjust the radial distribution by including a central hole to the cloud distribution described by the parameter . The circular velocity, , is also directly constrained by H I rotation curves. In addition, we find that the initial scale height of the cloud distribution, , has an insignificant effect on model outputs for values appropriate for an initially thin gas disk. Thus the parameters affecting model outputs which are not directly constrained by observations are , , and . The number of clouds, observed heliocentric velocity, and velocity dispersion versus in models of NGC 891 and NGC 5775 are shown in Figures 1 and 2 at slit positions of , 4, and 8 kpc along the major axis for a variety of different combinations of parameters. The main situations we wish to explore are the effect of the kick velocity, , the inclusion of a cone angle, , and the effect of a central hole in the initial cloud distribution.
One can immediately see some general trends common to the various models shown in Figures 1 and 2. First, each of the models produces a cloud distribution that is approximately exponential in . Second, the various models all predict a decrease in mean heliocentric velocity with due to decreased rotation speeds in the halo. In the case of NGC 5775, the run of vs. is asymmetric about due to the fact that the galaxy is not fully edge-on. As a result includes contributions from not only the rotation velocity, but vertical and radial velocities as well. Finally, the line widths of the models each exhibit peaks about kpc. This peak for kpc is particularly sharp and is due mainly to the fact that we are using 1 kpc bins along the major axis. Thus this bin includes clouds moving parallel and perpendicular to the line of sight near the galactic center. At other values of , the high velocity dispersion at low- is due to contributions from both clouds that have recently been ejected from the disk (and thus still having relatively high rotation speeds) and clouds that are falling back to the disk (and thus rotating more slowly).
The maximum kick velocity, , is a key parameter in determining how high into the halo these clouds can reach. For each galaxy, we initially choose such that the scale height of the cloud distribution, , matches the scale height of the bulk of the emission from the spectrum of NGC 891 of Rand (1997) and the scale height determined for NGC 5775 from Collins et al. (2001). For NGC 891 we set km s-1 to generate kpc, while for NGC 5775 values of kpc and kpc at the radial positions of Slits 1 and 2 are obtained by setting km s-1. These particular models, called the “base models,” are fully specified in Tables 1 and 2. The base models for NGC 891 and NGC 5775 are shown in Figures 1 and 2, along with models with slightly higher and lower kick velocities. Scale height, the change in from the midplane to kpc, and the range of in the various models are shown in Tables 1 and 2. Clearly the most significant effect of increasing the kick velocity is to increase the scale height of the cloud distribution as well as the line widths. The effect on the mean velocity profile, however, is more subtle with smaller kick velocities producing a slightly steeper fall-off with .
In Figures 1 and 2 we have also plotted a model where a central hole in the initial cloud distribution has been introduced to the base model. The radius of the hole is chosen to be one-half the radial scale length of the initial cloud distribution ( kpc and kpc for NGC 891 and NGC 5775, respectively). The introduction of a central hole has very little effect on the model outputs. The exception is when the slit position line-of-sight crosses the central hole such as for kpc. In this case, the mean velocity and dispersion do not include clouds moving parallel to the line of sight and are therefore lower.
In Figures 1 and 2, a model is plotted where a cone angle of is introduced to the base model. The inclusion of the cone angle has a negligible effect on scale height and mean velocities versus . The main effect of introducing a cone angle is to increase the line widths over that of the base model. Clearly, determinations of line widths for these slits would help distinguish the appropriate choice of cone angle for these models. However, the spectral resolution of our data is inadequate for such measurements.
In summary, the parameter space search reveals that these models show surprisingly little variation in the predicted mean velocity profile for any reasonable set of input parameters. Clearly the most important parameters affecting the profiles are the circular velocity, , which determines the strength of the potential, and the kick velocity, . Even the effect of significantly varying on the velocity profiles is somewhat small considering its effect on the scale height. As a result, we can be fairly certain that any uncertainty in model input parameters does not significantly affect the conclusions drawn from our comparisons in § 3.
2.2 Behavior of Individual Orbits
In order to gain some insight into the trends presented in the previous section, we also calculated a grid of individual orbits in order to understand what factors determine the heights, velocities, and radial motion of the orbits. In the cases we initially consider, we have used the gravitational potential used in Wolfire et al (1995). For this form of the potential, each component (bulge, disk, and halo) of the gravitational potential function scales linearly with . As a result, we can write the equation of motion for a cloud as
| (4) |
where is the normalized cloud velocity, and is the normalized gravitational acceleration. If an orbit is initialized with some kick velocity , those orbits with the same value of will have the same physical path. The time it takes to complete the orbit will scale inversely with the circular speed characterizing the galactic potential.
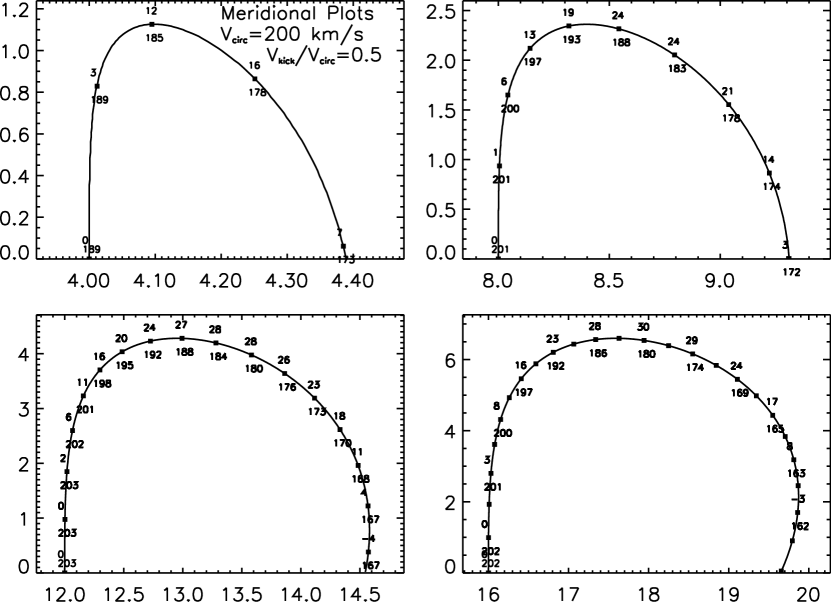
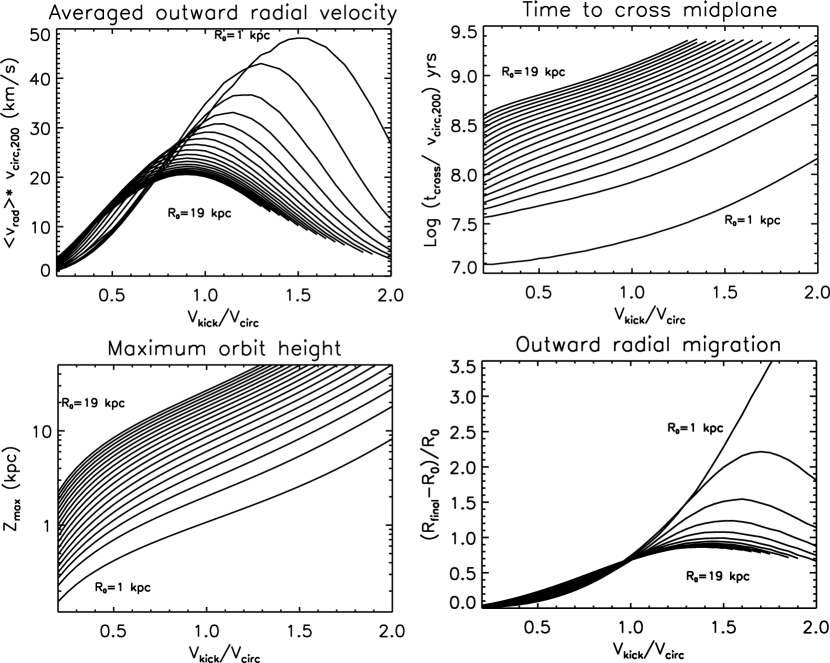
In Figure 3, we show four sample orbits up to the first plane crossing. These orbits are characterized by a nearly vertical climb, followed by a radially outward drift and descent back to the plane. In all cases, the orbits intersect the galactic plane at a larger radius than their initial coordinates, meaning that vertical galactic circulation is primarily a source of outward mass and momentum transport. The rotation velocity at any radius can be derived using conservation of angular momentum, so that constant. The average outward radial velocity shown in Figure 4, calculated by dividing the radial distance traveled by the total time to cross the midplane, is relatively insensitive to and initial radius, lying in the range 15-30 when and kpc ( denotes the orbit’s initial galactocentric radius), assuming km s-1. For smaller , the average radial velocity exceeds 30 km s-1 when . For the value drops below 10 km s-1, although there is some dependence on . This average outward radial velocity scales linearly with the circular velocity. For orbits originating at large , there is some slight radially inward motion just before the orbit crosses the plane. Such radially inward motion has been claimed to have been detected by Fraternali et al. (2001) in the galaxy NGC 2403. The maximum height of the orbit and time to cross the midplane depend on both the initial radius, and are also shown in Figure 4.
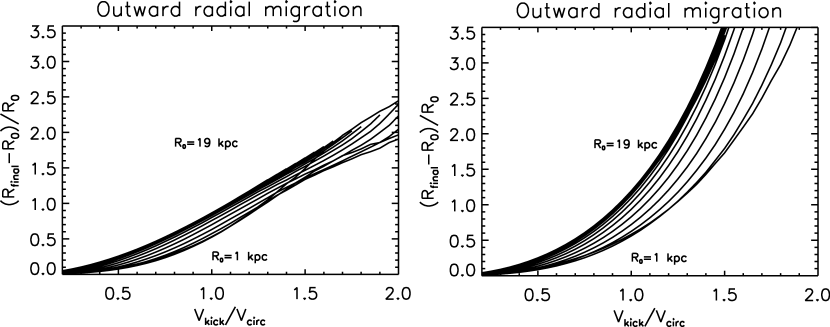
Figure 4 also presents the outward radial migration as a function of initial radius and . For initial radii greater than kpc (i.e. away from the bulge), the fractional change in radius seems to be a function of only, increasing from 10% at to 70% at with a roughly linear dependence over this range. This behavior makes it easier to estimate the outward mass flux analytically. We have also calculated a grid of orbits using different forms for the galactic potential: models 2 and 2i of Dehnen & Binney (1998). The resulting radial drift curves are shown in Figure 5. For , Model 2 produces a similar result as the Wolfire model, but results in greater radial drift than for the Wolfire et al. potential for large values of . Model 2i, however, has an oblate flattened halo with axial ratio , (as opposed to , see Dehnen & Binney (1998) for more details) and exhibits a much steeper rise in radial drift with . These curves should be useful in modeling the long term effects of surface mass density and angular momentum of the galactic disk due to vertical circulation; such models must also specify how the momentum is transferred back to the disk via drag forces and possibly include the effects of radial inflow in the midplane.
2.3 Mass and Energy Fluxes
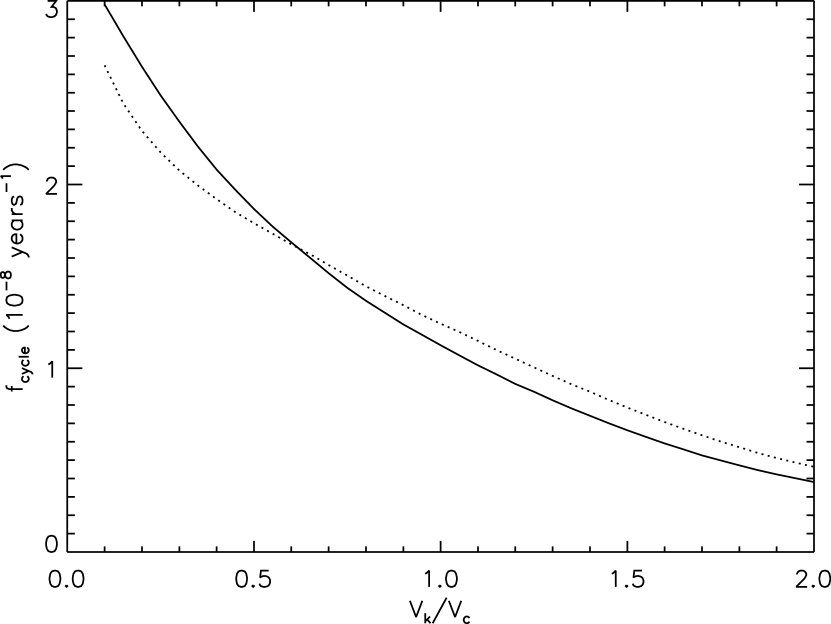
Since the distribution of clouds that we calculate reaches a steady-state, a given halo configuration requires a certain mass flux to sustain it. The orbits presented here are independent of the mass of the clouds. However, if one prescribes the desired total mass of the halo circulations, our calculations prescribe the mass flux. This is given simply by where is the halo mass and is the number of clouds in our simulation. The cycling frequency , the inverse of the mean timescale for the circulation, is given by our calculation and depends on the initial probability distribution functions presented at the beginning of Section 2. Keeping these values fixed but varying , we find that
| (5) |
where is the total halo mass in solar masses. Values of the cycling frequency, , for two different forms of the galactic potential, are given in Figure 6. NGC 891, with , has , while NGC 5775, with , has .
To determine the mass circulation rates inferred from these models, we must therefore estimate the halo mass. We use the H images of NGC 891 (Rand et al. 1990) and NGC 5775 (Collins et al. 2000) to determine the halo masses. We assume the emitting gas is concentrated in clouds of constant density as in the model. With this assumptions, the emission measure from the H image can then be converted to electron column density along the line of sight:
| (6) |
where the emission measure, , is in units of pc cm-6 (we use a conversion from H intensity of erg s-1 cm-2 arcsec pc cm-6 assuming a 104 K gas), is the path length through the halo in units of kpc, and is the volume filling fraction of the clouds. We leave the expression in terms of , where 0.2 is the approximate filling factor of the Reynolds Layer (Reynolds 1993). We consider halo emission only, as the disk is dominated by bright H II regions. The H emitting halo mass can then be calculated:
| (7) |
where is the pixel size in kpc2.
The estimated halo masses and halo mass fluxes for NGC 891 and NGC 5775 are shown in Table 3. The halo mass of NGC 891 is nearly a factor of three greater than the value estimated by Dettmar (1990), though the scale height of H emission used for that calculation ( pc) is somewhat lower than indicated by our data. We note that the estimated mass fluxes are highly uncertain due to the uncertainties in the calculation of halo masses.
These mass fluxes are somewhat higher than expected for these galaxies, for a filling factor of 0.2, indicating that a ballistic model is perhaps a too simplistic model. The ballistic model, in effect, assumes all extraplanar gas is in the process of cycling through the halo in an orbit as described in § 2.2. In contrast, gas in a purely hydrostatic fluid disk model does not circulate. The ballistic model thus maximizes the mass flux for a given halo mass and, as a result, the values calculated above should be thought of as upper limits to the actual flux.
We also note that we may use this model to estimate the kinetic energy flux associated with the circulation, given by where the mass flux is in and the kick velocity is in units of . For our assumed kick velocity distribution function, which is constant over the range to , , so that . The calculated halo kinetic energy fluxes for NGC 891 and NGC 5775 are shown in Table 3. Note that this energy flux is well below the canonical assuming one supernova every 30 years for a Milky Way-like spiral galaxy. Thus this circulation does not violate any energetics requirement.
3 Comparisons Between Data and Models
As stated earlier, we call the model that best matches the observed scale height of emission for each galaxy the base model. The parameters used in the base models of NGC 891 and NGC 5775 are listed in Tables 1 and 2, respectively. Models with non-zero cone angle and central holes in the initial gas distribution, though able to match the observed scale heights, cannot be well constrained from available data in that these parameters have negligible effects on the generated profiles. These parameters could be constrained with comparisons to line-widths; however, the low spectral resolution of our data precludes such measurements. The synthetic velocity profiles generated from the base models are plotted in Figures 7 and 8, overlaid on the velocity centroid data for each galaxy.
We neglect any comparison in regions dominated by disk emission ( kpc and kpc for NGC 891 and NGC 5775, respectively) as the presence of dust in the disk prevents the sampling of emission along the entire line of sight through each galaxy. As a result of this extinction, the detected spectral lines are significantly biased towards outer disk emission and contain little emission from gas at the terminal velocity. Due to sky-line contamination of the H line in the spectra of NGC 5775, we use velocity centroids from [N II] and [S II] lines in Figure 8. We thus assume that the [N II] and [S II] lines trace the same radial distribution as H. In the face-on galaxy M51 there is evidence for a rise in [S II]/H with galactocentric radius (Greenawalt et al. 1998) thus indicating the possibility that the [N II] and [S II] lines are biased towards outer disk emission in the spectra of edge-on galaxies. However, in the case of NGC 891 at least, any radial dependence of line ratios has a negligible effect on observed velocities as the velocity centroids of [N II] and H are fairly similar for the full run versus .
It should also be noted that in these comparisons, it is impossible to know the exact distribution of DIG along the line of sight. DIG preferentially concentrated in the outer disk can bias velocity centroids towards systemic. For example, an artificially shallow gradient due to a decreased projection of the rotation velocity vector along the line of sight can occur in a given slit if the DIG is concentrated in a filament in the outer disk. We suspect this could be a problem mainly in NGC 5775 where DIG emission in the slit is primarily of a filamentary morphology and thus the distribution along the line of sight is not well known. In the case of NGC 891, the smoother appearance of the DIG layer tangential to the line of sight suggests the DIG is distributed fairly uniformly parallel to the line of sight.
3.1 NGC 891
The kinematic data for NGC 891 shown in Figure 7 exhibits a steady decrease in rotation speed with above 1 kpc. The data indicates a drop in of km s-1 from to 4.5 kpc on either side of the disk, while the ballistic model predicts a drop over the same range in of km s-1, nearly equivalent to that of the fluid disk model of Benjamin (2000) without the effects of pressure gradients or magnetic fields. The model with km s-1 in Figure 1 can explain the kinematics up to kpc but fails beyond that height, and in any case does not match the observed scale height of emission. Clearly a ballistic model cannot explain the vertical velocity gradient observed in NGC 891. An inwardly directed radial pressure gradient would only make the predicted velocity drop-off steeper, and is thus ruled out for explaining the rotation of the DIG halo. Thus a source of coupling between disk and halo rotation may be necessary to “speed-up” the rotation of gas above the midplane. One possibility is through viscous forces created during cloud collisions which our model ignores. Magnetic effects should also play a role, given the dominant dynamical role of magnetic fields at high- (Boulares & Cox 1990). This could take the form of an outwardly directed magnetic pressure gradient, inwardly directed magnetic tension, or a magnetic coupling between the disk and halo. Models incorporating viscosity, magnetic tension, and pressure gradients would be extremely useful to determine if these effects significantly influence rotation.
3.2 NGC 5775
NGC 5775 is at an inclination of and thus data for kpc represents emission from highly inclined disk structure (i.e. is the apparent height above the major axis). The data shown in Figure 8 for Slit 1 exhibits an asymmetry in between the NE and SW sides of the galaxy. The sense of the asymmetry is consistent with an outflow in the -direction or, alternatively, a radial inflow similar to that of the anomolous H I component of NGC 2403 observed by Fraternali et al. (2001), though such an inflow is not predicted in a fountain-like flow such as our ballistic model. The asymmetry in the ballistic model is in the opposite sense as the non-circular line-of-sight velocities are dominated by outward radial migration. However, emission on the NE side of Slit 1 originates in a large filament which may trace a chimney where peculiar kinematics may not be representative of halo rotation as a whole.
The gas kinematics for kpc in NGC 5775 seem to be better represented by the ballistic model than for NGC 891. Though the exact velocities are slightly offset, the drop-off in from to 4.2 kpc for the NE side of Slit 1 are similar for both the data and the model: km s-1 and km s-1, respectively. Again, this region does trace the very bright DIG filament where unusual gas kinematics are likely. The agreement between data and model is not as good for the SW side over the same range in , where the observed drop-off is km s-1. For Slit 2, the model can adequately reproduce some of the kinematic data, particularly from to 4 kpc on either side of the disk, though the predicted velocity gradient of 65-70 km s-1 from to 4.2 kpc is considerably steeper than indicated by the data for the NE side. Given the scatter of the data on the SW side, however, the observed gradient is generally consistent with the model prediction. As for NGC 891, these cases of a shallower observed velocity gradient than predicted by the ballistic model suggest a mechanism of drag between disk and halo or an outwardly directed pressure gradient. The model with km s-1 in Figure 2 does a somewhat better job in explaining the gas kinematics up to kpc, though the vertical distribution of clouds in that model does not match the observed emission scale height.
It should be noted that the ballistic model, including any of the variations on the base model, completely fails for kpc. In each case, except for the SW side of Slit 1, the data indicate that the gas velocities nearly reach systemic. In no case do we ever find a ballistic model which produces zero velocity with respect to the underlying disk. Gas always shows some evidence of the underlying rotation. The difference between the data and model is not likely to be explained solely by a projection effect such as a concentration of the gas in the outer disk. In fact, an analysis of the ballistic model of NGC 5775 shows that for kpc, all of the clouds reside at galactocentric radius of kpc (clouds at higher galactocentric radius can reach higher in due to a weaker potential at larger ). Thus these clouds are well into the outer disk for lines of sight through the model at positions determined by the slits for the spectra. In order to explain the velocity centroids near systemic, a source of gas support must be included in the model such as an inwardly directed thermal or magnetic pressure gradient. Also, the companion galaxy, NGC 5774, may play a role as a tidal interaction could affect the high- gas kinematics.
4 Conclusions
We have presented a ballistic cloud model of disk-halo cycling, and from this model, generated synthetic mean velocity profiles versus . We have compared these profiles to velocity centroid data for the edge-on galaxies NGC 891 and NGC 5775. Though simplistic, these models have shown that hydrodynamic and possibly magnetohydrodynamic effects are important for halo rotation. A better understanding of halo kinematics may also be important for interpreting QSO absorption lines from higher redshift disk-halo systems (e.g. Steidel et al. 2002). Through this work we have made the following conclusions:
1. The vertical velocity gradient observed in NGC 891 is not as steep as predicted by the ballistic cloud model. This suggests the presence of drag between disk and halo such as through magnetic tension or viscous interactions between clouds. Alternatively, an outwardly directed pressure gradient could explain the gas kinematics.
2. The ballistic model is more successful in explaining DIG kinematics in NGC 5775. The filamentary morphology of some of the DIG emission in this galaxy, suggesting the presence of outflows, may explain why the ballistic model provides a reasonable representation. However, further simulations of chimneys in a rotating frame would be necessary to confirm this speculation. The ballistic model completely fails at high- where velocities nearly reach systemic. An inwardly directed pressure gradient may provide the extra support needed to explain the apparent slow rotation at high-. A possible tidal effect due to its companion galaxy, NGC 5774, should be considered when interpreting the kinematics observed in NGC 5775.
3. The ballistic model predicts that clouds migrate radially outward as they cycle through the halo. The mass fluxes estimated from the models of NGC 891 and NGC 5775 imply that significant amounts of gas can be involved in these migrations. Such migrations could cause a redistribution of gas that could affect metallicity gradients as well as star formation properties. Such effects have been previously investigated by Charlton & Salpeter (1989), for example, but extensive observations of the kinematic behavior of edge-on galaxies should yield important constraints on such redistribution.
4. We are limited in this work by the fact that we have data for only a few slit positions. Hence, we are beginning to carry out Fabry-Perot observations of DIG in edge-on galaxies which will allow us to obtain kinematic information with full two-dimensional coverage. Such work will allow issues of halo rotation to be addressed more completely.
References
- (1) Benjamin, R. A. 2000, in Astrophysical Plasmas: Codes, Models, and Observations, RevMexAA Serie de Conf. 9, eds. J. Arthur, N. Brickhouse, & J. Franco, 256
- (2) Bland-Hawthorn, J., Freeman, K. C., & Quinn, P. J. 1997, ApJ, 490, 143
- (3) Boulares, A., & Cox, D. P. 1990, ApJ, 365, 544
- (4) Bregman, J. N. 1980, ApJ, 236, 577
- (5) Charlton, J. C., & Churchill, C. W. 1998, ApJ, 499, 181
- (6) Charlton, J.C. & Salpeter, E.E. 1989, ApJ, 346, 101
- (7) Collins, J. A., & Rand, R. J. 2001, ApJ, 551, 57
- (8) Collins, J. A., Rand, R. J., Duric, N., & Walterbos, R. A. M. 2000, ApJ, 536, 645
- (9) Condon, J. J., Broderick, J. J. 1988, AJ, 96, 30
- (10) Dahlem, M., Dettmar, R.-J., & Hummel, E. 1994, A&A, 290, 384
- (11) Dehnen, W. & Binney, J. 1998, MNRAS, 294, 429
- (12) Dettmar, R.-J. 1990, A&A, 232, L15
- (13) Dettmar, R.-J. 1992, FCPh, 15, 143
- (14) Domgörgen, H., & Mathis, J. S. 1994, ApJ, 428, 647
- (15) Ferguson, A. M. N., Wyse, R. F., & Gallagher, J. S. 1996, AJ, 112, 2567
- (16) Ferriere, K. 1998, A&A, 335, 448
- (17) Fraternali, F., Oosterloo, T., Sancisi, R., & van Moorsel, G. 2001, ApJ, 562, 47
- (18) Golla, G., & Hummel, E. 1994, A&A, 284, 777
- (19) Greenawalt, B., Walterbos, R. A. M., Thilker, D., & Hoopes, C. G. 1998, ApJ, 506, 135
- (20) Haffner, L. M., Reynolds, R. J., & Tufte, S. L. 1999, ApJ, 523, 223
- (21) Irwin, J. A. 1994, ApJ, 429, 618
- (22) Norman, C. A., & Ikeuchi, S. 1989, ApJ, 345, 372
- (23) Rand, R. J. 1996, ApJ, 462, 712
- (24) Rand, R. J. 1997, ApJ, 474, 129
- (25) Rand, R. J. 1998, ApJ, 501, 137
- (26) Rand, R. J. 2000, ApJ, 537, 13
- (27) Rand, R. J., Kulkarni, S. R., & Hester, J. J. 1990, ApJ, 352, L1
- (28) Reynolds, R. J. 1993, in AIP Conf. Proc. 278, Back to the Galaxy , ed. S. S. Holt & F. Verter (New York: AIP), 156
- (29) Reynolds, R. J., Haffner, L. M., & Tufte, S. L. 1999, ApJ, 525, L21
- (30) Rossa, J., & Dettmar, R.-J. 2000, A&A, 359, 433
- (31) Schaap, W. E., Sancisi, R., & Swaters, R. A. 2000, A&A, 356L, 49
- (32) Sembach, K. R., Howk, J. C., Ryans, R. S. I., & Keenan, F. P. 2000, ApJ, 528, 310
- (33) Shull, J. M., & McKee, C. F. 1979, ApJ, 227, 131
- (34) Sokolowski, J. 1994, preprint
- (35) Steidel, C. C., Kollmeier, J. A., Shapley, A. E., Churchill, C. W., Dickinson, M., & Pettini, M. 2002, ApJ, 570, 526
- (36) Swaters, R. A., Sancisi, R., & van der Hulst, J. M. 1997, ApJ, 491, 140
- (37) Tüllmann, R., Dettmar, R.-J., Soida, M., Urbanik, M., & Rossa, J. 2000, A&A, 364L, 36
- (38) Wakker, B.P. 1990, PhD Thesis, Groningen
- (39) Wakker, B. P., & van Woerden, H. 1997, ARA&A, 35, 217
- (40) Wolfire, M. G., McKee, C. F., Hollenbach, D., & Tielens, A. G. G. M. 1995, ApJ, 453, 673


| Scale | from | Range of | |||||||
|---|---|---|---|---|---|---|---|---|---|
| Model | Height (kpc) | =0-3 kpc (km s-1) | (km s-1) | ||||||
| Description | =0 kpc | =4 | =8 | =0 | =4 | =8 | =0 | =4 | =8 |
| Base modelaaThe base model is characterized by the following parameters: kpc, km s-1, km s-1, and . | 1.0 | 1.0 | 1.1 | … | 90 | 65 | 15-70 | 20-50 | 20-40 |
| km s-1 | 0.5 | 0.6 | 0.7 | … | 100 | 85 | 10-70 | 10-50 | 15-40 |
| km s-1 | 1.5 | 1.5 | 1.8 | … | 75 | 30 | 20-70 | 30-55 | 30-45 |
| 0.9 | 0.9 | 1.0 | … | 95 | 65 | 20-70 | 25-55 | 30-45 | |
| kpc | 1.1 | 1.0 | 1.1 | … | 95 | 70 | 10-30 | 20-50 | 20-40 |
| Scale | from | Range of | |||||||
|---|---|---|---|---|---|---|---|---|---|
| Model | Height (kpc) | =0-3 kpc (km s-1) | (km s-1) | ||||||
| Description | =0 kpc | =4 | =8 | =0 | =4 | =8 | =0 | =4 | =8 |
| Base modelaaThe base model is characterized by the following parameters: kpc, km s-1, km s-1, and . | 2.0 | 2.1 | 2.5 | … | 55 | 20 | 25-65 | 25-45 | 30-40 |
| km s-1 | 1.3 | 1.5 | 1.5 | … | 75 | 35 | 15-65 | 15-45 | 20-35 |
| km s-1 | 2.5 | 2.9 | 4.2 | … | 30 | 20 | 35-65 | 40-50 | 40-50 |
| 1.7 | 2.1 | 2.6 | … | 55 | 15 | 35-75 | 40-55 | 40-55 | |
| kpc | 2.3 | 2.2 | 2.8 | … | 50 | 20 | 15-35 | 30-45 | 30-40 |
| Galaxy | ( M☉) | ( M☉ yr-1) | ( erg s-1) |
|---|---|---|---|
| NGC 891 | 22 | ||
| NGC 5775 | 13 |