Extreme X-ray Iron Lines in Active Galactic Nuclei
Abstract
We analyze X-ray spectra of heavily obscured () active galaxies obtained with Chandra, concentrating on the iron K fluorescence line. We measure very large equivalent widths in most cases, up to 5 keV in the most extreme example. The geometry of an obscuring torus of material near the active galactic nucleus (AGN) determines the Fe emission, which we model as a function of torus opening angle, viewing angle, and optical depth. The starburst/AGN composite galaxies in this sample require small opening angles. Starburst/AGN composite galaxies in general therefore present few direct lines of sight to their central engines. These composite galaxies are common, and their large covering fractions and heavy obscuration effectively hide their intrinsically bright X-ray continua. While few distant obscured AGNs have been identified, we propose to exploit their signature large Fe K equivalent widths to find more examples in X-ray surveys.
1 Iron Lines in the X-ray Spectra of AGN
The strongest line in the X-ray spectrum of an active galactic nucleus (AGN) at moderate energies ( keV) is due to iron fluorescence, particularly “neutral” Fe K at 6.4 keV, from Fe less ionized than Fe XVII. If both the continuum and the Fe-emitting region are viewed directly (the “Type 1” view), the equivalent width (EW) is small, typically less than 200 eV. As Krolik & Kallman (1987) pointed out, the EW can increase greatly if the fluorescing material is exposed to a stronger continuum than the observer detects. In this case (the “Type 2” view), an obscuring “torus” of material near the active nucleus blocks direct views of the central engine along the line of sight. X-ray observations of Seyfert galaxies generally support this unification scenario. Seyfert 1s typically exhibit EW eV (Nandra & Pounds, 1994), while the EWs in Seyfert 2s reported hitherto tend to be larger and distributed more broadly, ranging from about 100 eV to 1 keV (Turner et al., 1997).
Seen from the “Type 2” view, the K EW depends strongly on the torus geometry and total column density. Previous theoretical calculations (Awaki et al., 1991; Ghisellini, Haardt, & Matt, 1994; Krolik, Madau, & Życki, 1994) have concentrated on producing EW keV, consistent with earlier observations. They indicated, however, that still larger EWs might result from Compton-thick tori (i.e., toward the nucleus) with special geometries.
Motivated by this suggestion and the recent discovery in Chandra X-ray Observatory (Chandra) observations of several much stronger lines (e.g., Sambruna et al., 2001), in this work, we examine the Fe K properties of active galaxies that have previously been identified as Compton thick. Our sample, listed in Table Extreme X-ray Iron Lines in Active Galactic Nuclei, comprises all such galaxies Chandra has observed for which published results, archival data, or proprietary data are available. Most of these are classified as Seyfert 2 galaxies. NGC 4945 lacks the requisite optical emission line signature of Seyfert galaxies, but X-rays reveal its active nucleus (Iwasawa et al., 1993). M51 is exceptional in this group for its low luminosity, and the source identified in the Chandra Deep Field South, CDF-S 202, is exceptional for its high luminosity, but they both fulfill the broad selection criteria. Although this sample is not complete and the data are heterogeneous, these measurements suggest that extremely large Fe equivalent widths are common in such heavily obscured AGN.
2 Observations and Spectral Fitting
All of the sample members were observed with the Advanced CCD Imaging Spectrometer (ACIS), and the Circinus galaxy and Mrk 3 were observed with the transmission gratings in place. See Weisskopf et al. (2000), G. Garmire et al., in preparation, and Canizares et al. (2000) for more information on Chandra, ACIS, and the transmission gratings, respectively.
Sako et al. (2000) analyze the Chandra spectra of Mrk 3. In order to examine the Fe lines in detail, we obtained these data from the Chandra Data Archive at the Chandra X-ray Center and extracted the High-Energy Transmission Grating Spectrometer spectrum following the method of Yaqoob et al. (2001), applying updated calibrations. Using XSPEC (Arnaud, 1996), we fit the spectrum from 4–8 keV, avoiding the complication of many emission lines at softer energies while providing enough high-energy coverage to fit the H-like Fe and neutral Fe K near 7 keV. We modeled the continuum as a strongly-absorbed power law, adding an unabsorbed power law constrained to have the same photon index to represent the scattered contribution. These data do not strongly constrain the intrinsic column density, but the EW is relatively insensitive to this uncertainty. (These data are in fact consistent with Compton thin obscuration; .) Three Gaussians, which represent the Fe lines, are significant, with the neutral K EW keV.
M51, NGC 4945, NGC 5135, and NGC 7130, were all observed with Chandra’s back-illuminated S3 ACIS detector. We obtained the data on NGC 4945 and M51 from the Chandra archive. See Madejski et al., in preparation, for more complete analysis of the Chandra observation of NGC 4945. Terashima & Wilson (2001) present results from the observation of M 51, but we reanalyze the data here in order to utilize updated calibrations. The other two data sets are part of our program on starburst/AGN composite galaxies. We reprocessed all data from original Level 1 event files and applied the latest gain corrections, from 2001 July 31. We examined the lightcurves and excluded times during the NGC 4945 observation where flares were significant. We detected no significant flares in the other data. In each case, we extracted the spectrum from a circular region of radius about and measured the local background in nearby source-free regions. Except in the case of NGC 4945, we did not bin the data, in order to retain the highest-energy photons. While the very soft X-ray spectra require thermal emission components, above 4 keV only the power-law continuum and Fe emission lines are significant. A single unabsorbed continuum component is required, which we interpret as the reprocessed contribution. The best-fitting continuum in each of these four spectra is relatively flat, consistent with pure Compton reflection.
Table Extreme X-ray Iron Lines in Active Galactic Nuclei summarizes these results, listing the measured central energy and the equivalent width of the neutral Fe K line for each sample member. We also record the continuum photon index, , of the fits. The intrinsic continuum is strongly reprocessed in these obscured galaxies. While the simple power laws we apply are reasonable over the restricted energy ranges of the model fits, we caution that they are not appropriate descriptions over large energy ranges (e.g., for – keV). References in Table Extreme X-ray Iron Lines in Active Galactic Nuclei include the identification of the sample members’ large column densities and published Chandra measurements, which we adopt for Circinus, NGC 1068, CDF-S 202, and IRAS 09104+4109. In these last two cases, Norman et al. (2002) and Iwasawa, Fabian, & Ettori (2001) apply reflection models, and the tabulated values of represent the intrinsic source spectra. Thus, these two are steeper than the directly-measured continua of the other highly obscured examples, although their observed continua are similarly flat.
3 Fe Line Models
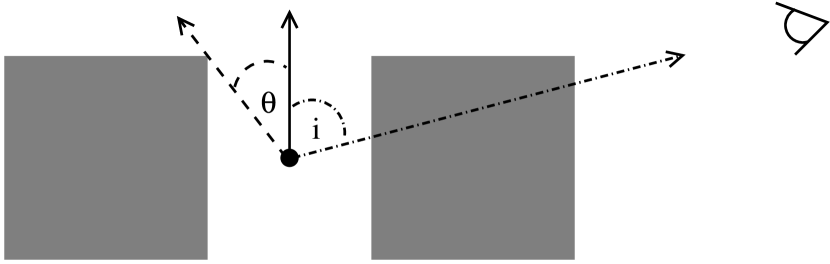
The Fe K EWs of the Compton thick AGNs in this sample tend to be extremely large, as expected when the intrinsic AGN continuum is fully hidden from direct view. We model the geometric dependence of continuum reprocessing with Monte Carlo simulations, which Krolik et al. (1994) describe more completely. Although we introduce no new physics in these calculations, the current observations demonstrate that more extreme configurations are relevant and must be evaluated. We consider a uniform torus of neutral material having a square cross-section of Thomson optical depth, , in each direction, and opening angle (Figure 1). We consider all viewing angles, , including Type 1 AGN orientations, where . We adopt intrinsic and solar Fe abundance in the basic model and discuss additional variations below. We do not consider any scattered or direct contribution from ionized material that may be present outside the torus cavity or near the central source, but these simplifications do not significantly affect the EW.
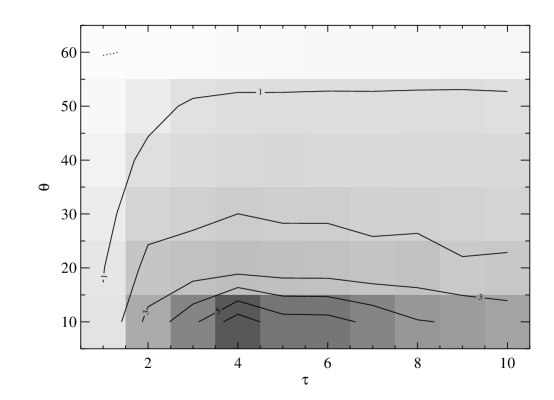
The EW rises smoothly with decreasing and increasing for constant , as Figure 2 illustrates for . For , the EW we calculate falls below eV because we model only the torus contribution; the accretion disk, visible when , would add to the EW in that case.
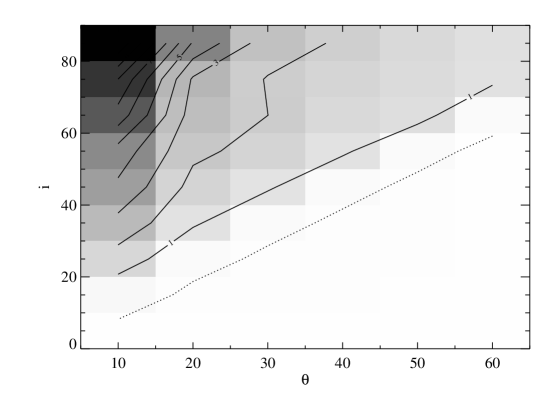
Figure 3 shows the variation of EW in the plane for . For fixed , the EW is greatest when is smallest, but EW does not increase monotonically with . To achieve EW keV, is required; the greatest EWs are found for .
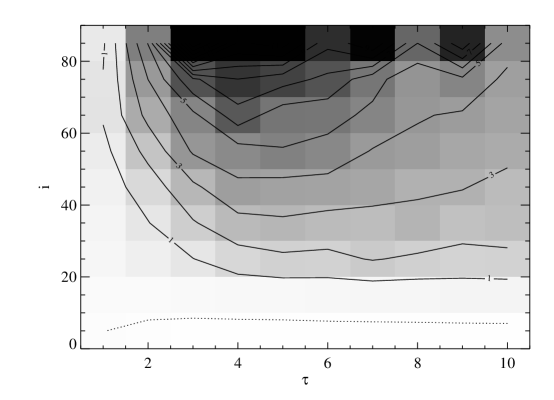
The case of (Figure 4) demonstrates that extremely large EWs may arise over a wide range of viewing angles and optical depths for sufficiently small torus opening angle. While EW increases with for a given , moderate values of and large values of produce the largest EWs, which some of these Compton-thick AGNs require.
These trends may be understood qualitatively as the interaction of several processes. Smaller opening angle means the torus obscures a larger solid angle around the nucleus, hence more Fe K-edge photons are captured and generate K photons. Viewing angles closer to the equatorial plane see larger equivalent widths in the K line because the continuum is most severely attenuated along that direction. Large, but not too large, optical depth promotes K production by absorbing more hard X-rays: the continuum at K is suppressed, while photons well above the Fe K-edge are absorbed and trigger fluorescence. Compton optical depths more than diminish the equivalent width because the optical depth from the points of K production to the surface is too large for the fluorescence photons to escape.
Variations in spectral shape, torus cross-section, and Fe abundance create changes in the EW that are only on the order of typical measurement errors. A shallower slope tends to increase the EW, because relatively more high-energy photons penetrate deeper into the torus, and the Fe-fluorescing region is then closer to the observer. Adopting , for example, the EW changes by less than 5% for , and up to 30% at for and .
Previous calculations have emphasized the effect of Fe abundance in order to account for large EWs, but abundance variations are only a secondary effect. With twice-solar abundances, for example, the EW increases up to 60% in the edge-on geometry. In contrast, purely geometric (and physically plausible) variations can alter the EW by an order of magnitude.
The Fe line luminosity is correlated with the intrinsic AGN luminosity. For a given torus geometry, the K luminosity is relatively insensitive to viewing geometry, typically varying by factors of 5 over all viewing angles, with departures to factors of 10 only in a small minority of cases.
We constrain the geometries of the obscuring regions of the galaxies with the largest EWs with these models. M51 requires ; for , a range of optical depth and viewing angle are consistent. NGC 5135 also favors , allowing a range of , depending on . We note that ionized Fe lines are not detected in these two galaxies. Their large neutral covering fractions suggest that even if an ionized region is present, the neutral material may completely block it from our view.
4 Significance
Larger EWs require more extreme geometries, with torus opening angle for EW keV. In this sample, the galaxies that exhibit the largest EWs have concentrated circumnuclear starbursts, while in the only galaxy certainly lacking a starburst, Mrk 3, the K EW is relatively small. This may be causal—the mechanical energy of a starburst, input as stellar winds and supernovae, may inflate the torus so that it covers a greater solid angle around the nucleus (e.g., Wada & Norman, 2002).
The compact starbursts of NGC 5135 and NGC 7130 are evident from both their vacuum ultraviolet spectra, which show absorption features formed in the winds and photospheres of massive stars, and from their optical spectra where the high-order Balmer series and He I lines are observed in absorption (González Delgado et al., 1998). The nuclear spectrum of M51 reveals high-order Balmer lines in absorption, also characteristic of a young stellar population (Heckman, Crane, & Balick, 1980). The 100-pc scale starburst of NGC 4945 is detected in Pa images (Marconi et al., 2000), while a 200-pc ring of H and Br is evidence of the young stars around the nucleus of Circinus (Elmouttie et al., 1998; Maiolino et al., 1998). The unpolarized nuclear spectrum of IRAS 09104+4109 exhibits a broad feature around He II , attributable to Wolf-Rayet stars (Tran, Cohen, & Villar-Martin, 2000). NGC 1068’s starburst is large, and this extended (kpc-scale) star-formation region (Telesco & Decher, 1988) therefore does not shape the immediate environment of the central engine. Instead, the AGN significantly affects the conditions of the nuclear region, as the prominent ionized Fe lines illustrate in this case (Ueno et al., 1994).
Most recent investigations of the significance of starbursts in active galaxies have concentrated on Type 2 AGNs (e.g., González Delgado, Heckman, & Leitherer, 2001) for the practical reason that the starburst signatures are more evident when the glare of the central engine is blocked. Our explanation for the exceptionally large K EWs seen in starburst/AGN composites—very small opening angles—implies that any particular AGN with a starburst is more likely to be seen as Type 2, so few genuine starburst/Type 1 AGNs exist.
Starburst/Type 2 AGN composite galaxies are common. Approximately half of all Seyfert 2s contain circumnuclear starbursts (González Delgado et al., 2001). The composite galaxies are also preferentially more obscured than their “pure” counterparts, which lack starbursts (Levenson et al., 2001). The starbursts themselves are responsible for some of this obscuration. With typical star-formation rates per unit area – in the central 100 pc of composite galaxies (González Delgado et al., 1998), the correlation of Kennicutt (1998) implies the mean gas column density in the star-forming regions is about . The causal connection of large column density and star formation may then work both ways to enhance EW: strong starbursts arise where a large reservoir of material is available, and the starburst may also inflate the torus. Thus, in a significant fraction of AGNs, accretion occurs behind large obscuring column densities that cover most lines of sight.
In order to reproduce the observed spectrum of the cosmic X-ray background, synthesis models (Setti & Woltjer, 1989; Comastri et al., 1995) require a large population of obscured AGNs. An outstanding problem with these models has been the small number of obscured luminous AGNs—Type 2 quasars—that are actually identified. Most of these are radio-loud sources, which represent only a minority of AGNs (Urry & Padovani, 1995). Broad-band X-ray surveys are not generally an effective method for finding Type 2 quasars because even the X-ray continuum may not penetrate the enshrouding gas. For example, CDF-S 202 is the only high-luminosity obscured AGN reported in the 1-Ms exposure of the Chandra Deep Field South, and only one has been identified in the 185-ks observation of the Lynx field (Stern et al., 2002).
This sample suggests that prominent Fe K (EW keV) is a common feature of very obscured AGNs, and the characteristic large EW can be exploited to find more of them. Specifically, we propose searching for Type 2 quasars in continuum-subtracted narrow-band X-ray images. At high redshift, in particular, where the host galaxy contribution is negligible, the Fe line contains nearly all the X-ray flux. Within a narrow energy range, eV, some objects might become significant detections that would be undetectable when the background or sensitivity constraint of a wider band is included.
The Fe K line is a valuable probe of buried AGNs and the material that hides them. Isolating this line emission both spectrally and spatially from additional diluting sources, these Chandra observations suggest that large EWs are common in obscured AGNs. The most extreme EWs require small torus opening angles and arise in the starburst/AGN composite galaxies.
References
- Arnaud (1996) Arnaud, K. A. 1996, in ASP Conf. Ser. 101, Astronomical Data Analysis Software and Systems V, ed. G. Jacoby & J. Barnes (San Francisco: ASP), 17
- Awaki et al. (1991) Awaki, H., Koyama, K., Inoue, H., & Halpern, J. P. 1991, PASJ, 43, 195
- Awaki et al. (1990) Awaki, H., Koyama, K., Kunieda, H., & Tawara, Y. 1990, Nature, 346, 544
- Canizares et al. (2000) Canizares, C. R., et al. 2000, ApJ, 539, L41
- Comastri et al. (1995) Comastri, A., Setti, G., Zamorani, G., & Hasinger, G. 1995, A&A, 296, 1
- Elmouttie et al. (1998) Elmouttie, M., Koribalski, B., Gordon, S., Taylor, K., Houghton, S., Lavezzi, T., Haynes, R., & Jones, K. 1998, MNRAS, 297, 49
- Franceschini et al. (2000) Franceschini, A., Bassani, L., Cappi, M., Granato, G. L., Malaguti, G., Palazzi, E., & Persic, M. 2000, A&A, 353, 910
- Ghisellini, Haardt, & Matt (1994) Ghisellini, G., Haardt, F., & Matt, G. 1994, MNRAS, 267, 743
- González Delgado et al. (2001) González Delgado, R. M., Heckman, T. M., & Leitherer, C. 2001, ApJ, 546, 845
- González Delgado et al. (1998) González Delgado, R. M., Heckman, T., Leitherer, C., Meurer, G., Krolik, J., Wilson, A. S., Kinney, A., & Koratkar, A. 1998, ApJ, 505, 174
- Heckman, Crane, & Balick (1980) Heckman, T. M., Crane, P. C., & Balick, B. 1980, A&AS, 40, 295
- Iwasawa, Fabian, & Ettori (2001) Iwasawa, K., Fabian, A. C., & Ettori, S. 2001, MNRAS, 321, L15
- Iwasawa et al. (1993) Iwasawa, K., Koyama, K., Awaki, H., Kunieda, H., Makishima, K., Tsuru, T., Ohashi, T., & Nakai, N. 1993, ApJ, 409, 155
- Kennicutt (1998) Kennicutt, R. C. 1998, ApJ, 498, 541
- Koyama et al. (1989) Koyama, K., Inoue, H., Tanaka, Y., Awaki, H., Takano, S., Ohashi, T., & Matsuoka, M. 1989, PASJ, 41, 731
- Krolik & Kallman (1987) Krolik, J. H., & Kallman, T. R. 1987, ApJ, 320, L5
- Krolik et al. (1994) Krolik, J. H., Madau, P., & Życki, P. T. 1994, ApJ, 420, L57
- Levenson et al. (2001) Levenson, N. A., Weaver, K. A., & Heckman, T. M. 2001, ApJ, 550, 230
- Maiolino et al. (1998) Maiolino, R., Krabbe, A., Thatte, N., & Genzel, R. 1998, ApJ, 493, 650
- Makishima et al. (1990) Makishima, K., Ohashi, T., Kondo, H., Palumbo, G. G. C., & Trinchieri, G. 1990, ApJ, 365, 159
- Marconi et al. (2000) Marconi, A., Oliva, E., van der Werf, P. P., Maiolino, R., Schreier, E. J., Macchetto, F., & Moorwood, A. F. M. 2000, A&A, 357, 24
- Matt et al. (1996) Matt, G., et al. 1996, MNRAS, 281, L69
- Nandra & Pounds (1994) Nandra, K., & Pounds, K. A. 1994, MNRAS, 268, 405
- Norman et al. (2002) Norman, C., et al. 2002, ApJ, 571, 218
- Risaliti, Maiolino, & Salvati (1999) Risaliti, G., Maiolino, R., & Salvati, M. 1999, ApJ, 522, 157
- Sako et al. (2000) Sako, M., Kahn, S. M., Paerels, F., & Liedahl, D. A. 2000, ApJ, 543, L115
- Sambruna et al. (2001) Sambruna, R. M., Netzer, H., Kaspi, S., Brandt, W. N., Chartas, G., Garmire, G. P., Nousek, J. A., & Weaver, K. A. 2001, ApJ, 546, L13
- Setti & Woltjer (1989) Setti, G., & Woltjer, L. 1989, A&A, 224, L21
- Stern et al. (2002) Stern, D., et al. 2002, ApJ, 568, 71
- Telesco & Decher (1988) Telesco, C. M., & Decher, R. 1988, ApJ, 334, 573
- Terashima & Wilson (2001) Terashima, Y., & Wilson, A. S. 2001, ApJ, 560, 139
- Tran, Cohen, & Villar-Martin (2000) Tran, H. D., Cohen, M. H., & Villar-Martin, M. 2000, AJ, 120, 562
- Turner et al. (1997) Turner, T. J., George, I. M., Nandra, K., & Mushotzky, R. F. 1997, ApJS, 113, 23
- Ueno et al. (1994) Ueno, S., Mushotzky, R. F., Koyama, K., Iwasawa, K., Awaki, H., & Hayashi, I. 1994, PASJ, 46, L71
- Urry & Padovani (1995) Urry, C. M., & Padovani, P. 1995, PASP, 107, 803
- Wada & Norman (2002) Wada, K., & Norman, C. A. 2002, ApJ, 566, L21
- Weisskopf et al. (2000) Weisskopf, M. C., Tananbaum, H. D., Van Speybroeck, L. P., & O’Dell, S. L. 2000, Proc. SPIE, 4012, 2
- Yaqoob et al. (2001) Yaqoob, T., George, I. M., Nandra, K., Turner, T. J., Serlemitsos, P. J., & Mushotzky, R. F. 2001, ApJ, 546, 759
- Young et al. (2001) Young, A. J., Wilson, A. S., & Shopbell, P. L. 2001, ApJ, 556, 6
| Galaxy | aaSource rest frame | EWaaSource rest frame | References | |
|---|---|---|---|---|
| (keV) | (keV) | |||
| M51 | 1, 2 | |||
| NGC 5135 | 3, 2 | |||
| Circinus | -0.8 | 4, 5 | ||
| NGC 4945 | 6, 2 | |||
| NGC 1068 | 7, 8 | |||
| CDF-S 202 | 1.8bbReflection model fixed intrinsic source | 9 | ||
| IRAS 09104+4109 | 2.0bbReflection model fixed intrinsic source | 10, 11 | ||
| NGC 7130 | 12, 2 | |||
| Mrk 3 | 13, 2 |
Note. — Errors are 90% confidence limits for one interesting parameter.
References. — (1) Makishima et al. (1990); (2) this work; (3) Turner et al. (1997); (4) Matt et al. (1996); (5) Sambruna et al. (2001); (6) Iwasawa et al. (1993); (7) Koyama et al. (1989); (8) Young et al. (2001); (9) Norman et al. (2002); (10) Fraceschini et al. (2000); (11) Iwasawa et al. (2001); (12) Risaliti et al. (1999); (13) Awaki et al. (1990)