A Scattered Light Echo around SN 1993J in M81
Abstract
A light echo around SN 1993J was observed 8.2 years after explosion by a HST WFPC2 observation, adding to the small family of supernovae with light echoes. The light echo was formed by supernova light scattered from a dust sheet, which lies 220 parsecs away from the supernova, 50 parsecs thick along the line of sight, as inferred from radius and width of the light echo. The dust inferred from the light echo surface brightness is 1000 times denser than the intercloud dust. The graphite to silicate fraction can not be determined by our BVI photometric measurements, however, a pure graphite model can be excluded based on comparison with the data. With future observations, it will be possible to measure the expansion rate of the light echo, from which an independent distance to M81 can be obtained.
1 Introduction
Shortly after the burst of Nova Persei 1901, a light echo was observed to emerge with superluminal expansion. It was later properly explained (Couderc 1939) to be the nova light scattered by dust nearby which reached us later than the unscattered photons due to light travel effects. The possibility of observing such an effect with supernovae was later discussed by many authors (e.g. Zwicky 1940, Schaefer 1987). More than its splendid appearance, a light echo also sheds light on the circumstellar and interstellar environments through which it passes and the most famous example is from SN 1987A in Large Magelanic Cloud. Observations of re-emission from the rings around SN 1987A provide us the information on the geometry, distribution and composition of its circumstellar medium (e.g., Lundqvist et al 1991) , help us to infer the stellar wind history of its pregenitor, and even enable us to determine an accurate distance to SN 1987A (Panagia et al. 1991). Also, the monitoring of its scattered light echoes enables a three dimenional mapping of the structure of the interstellar medium in front of SN 1987A (Xu et al. 1995), which reveals aspects of dense clouds and superbubbles that are difficult to reveal by other means.
This phenomenon has also been found in distant galaxies. For example, SN 1991T, a luminous Type Ia supernova in NGC 4527, exhibited a nearly flat light curve more than 950 days after maximum light, and spectral features that, although were present in earlier spectra, were substantially narrower and blueshifted on a significantly bluer continuum (Schmidt et al. 1994). Schmidt et al. attributed these features to a light echo, which was later confirmed by HST FOC observations (Sparks et al. 1999). Similar photometric and spectroscopic behaviors in the late-time observations of SN 1998bu have led to suspicion of a light echo (Cappellaro et al. 2001), but it has yet to be confirmed by direct high-resoulution imaging.
Due to limited spatial resolution, direct imaging observations of supernova light echoes are possible only in our local supercluster, which makes these phenomena rare events. Thus far, only Nova Persei 1901, SN1987A, SN1991T and SN1998bu are reported to have associated light echoes in the literature. Here we report on a light echo around SN1993J, the fourth such event.
The supernova SN1993J exploded on March 28, 1993 in the spiral galaxy M81, and due to its proximity (3.6 Mpc), it has been observed and at wavebands from radio to -ray regions. It began as a type II supernova, but changed later to type Ib at the nebular stage, and was classified as type IIb. A series of observations with the Very Large Baseline Interferometer revealed an expanding radio shell that was decelerating (Bartel et al. 1999), reflecting the interaction between the shock front and the circumstellar medium. Intensive photometric and spectroscopic observations also showed an infrared excess after day 50, which may be indictive of an infrared echo (Lewis et al. 1994).
In this paper we report an optical scattered light echo around SN 1993J that was dicovered in an HST WFPC2 observation. In 2, we discuss our observations showing the light echo, and another archive HST WFPC2 observation with a nondetection of such a light echo. Models for this light echo are discussed in 3, which give the geometry and dust properties. For the distance to SN 1993J, we use the distance to M81, i.e., 3.63 Mpc (, Freedman et al. 1994).
2 Observations
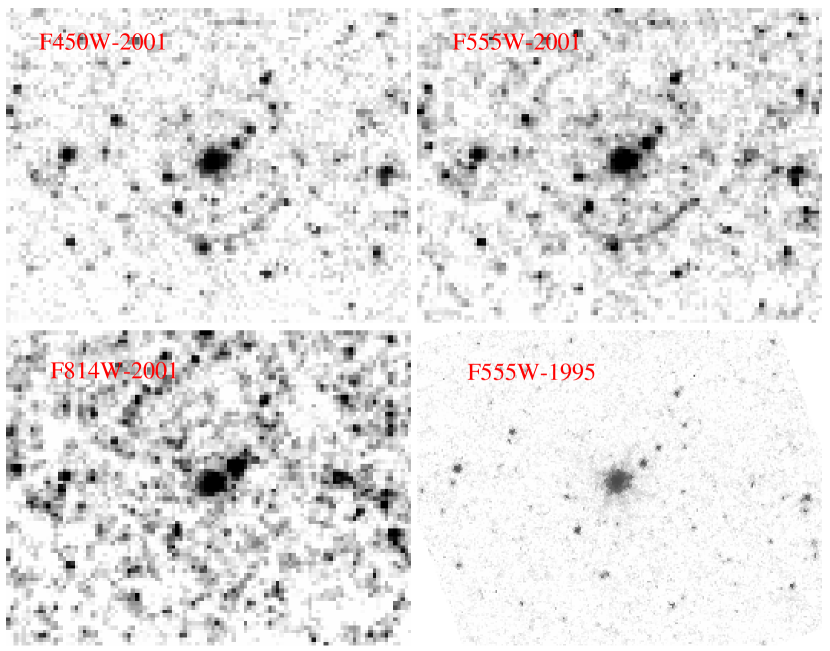
As part of an observation of a different target, the WFPC2 was oriented so that SN1993J fell on a Wide Field chip (WF4) during our 2000 second HST observations in the B, V, and I bands (F450W, F555W, and F814W). The observation was obtained on June 4, 2001, 8.2 years after its explosion; the data were analyzed following standard procedures. A light echo is clearly visible around SN1993J, as shown in Fig. 1. This ring, which is most obvious in the F555W image, has a radius of about 1.9” (19 pixels) and about 0.2” in width. This ring is a partial arc with the brightest part about 4.3” in length. For comparison, another WFPC2 observation on Jan. 31, 1995 (i.e., 1.8 years after SN1993J) with supernova centered on the Planetary Camera was also extracted from the MAST archive. There was no evidence of similar light echoes or partial arcs in the 1995.
The mean surface brightness of the arc was computed from those arc pixels that are brightest in the F555W image, excluded were those pixels that show a faint source in the F814W image. The background mean and sigma were computed from a square box centered on the arc, but excluding the arc and point sources. The net count rates (in ) were then converted to surface brightness (in ) using zeropoints appropriate for standard BVI photometry. The measured surface brightness and lower/upper limits in units of for errors in count rates are listed in Table 1. For the 1995 observation, the detection threshold in the F555W image, defined by the standard deviation of the mean of a region which includes the positions of the observed 1.9” arc and the postulated 0.9” arc (see section 3), is , about 15 times fainter than the observed light arc.
| Filter | brightness | lower limit | upper limit |
|---|---|---|---|
| F450W(B) | 22.61 | 23.75 | 22.49 |
| F555W(V) | 22.26 | 22.35 | 22.18 |
| F814W(I) | 22.46 | 22.80 | 22.20 |
3 Discussion
Scattered light seen time later after the supernova onset must be scattered by dust on a -ellipsoid as illustrated in Fig. 2. For a dust cloud in front of the supernova, the distance to the supernova along the line of sight can be obtained for specified and the impact parameter (i.e., the perpendicular distance from the supernova to the line of sight, where D is the distance to the supernova from the earth, is the angle of the line of sight from the supernova), from the expression . For this light echo of SN 1993J, years,, or ,, which leads to, . This distance, as well as the asymetric shape of the light echo, indicates that the dust cloud could not have originated from the red supergiant wind of SN 1993J progenitor. Instead, it should be a discrete interstellar dust sheet as seen in our galaxy. The thickness of of the dust sheet along the line of sight can be associated with the width of the light echo by . The observed values, , or , indicate the dust sheet has a thickness of about . The geometry described here is illustrated in Fig. 2. Note, however, that the sheet structure in Fig. 2 is not the only possible configuration. The detection of this light echo only requires dusty clouds filling the volumn between the 8.2 year ellipsoid and the 8.2year-120day ellipsoid as shaded in Fig. 2.
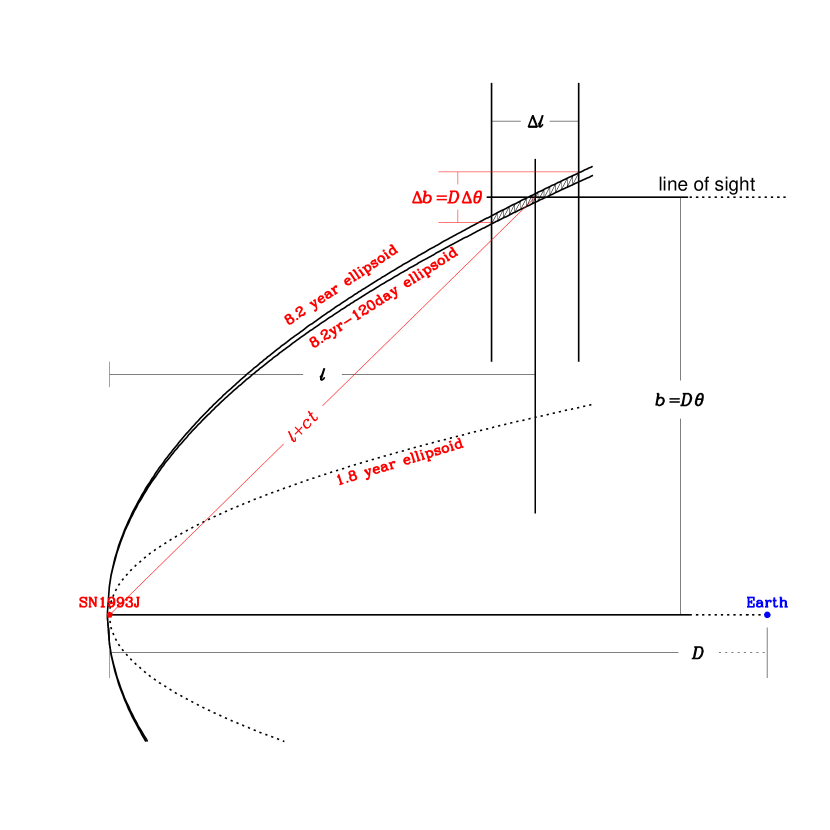
If this dust sheet extended toward the supernova and crossed the dashed 1.8 year ellipsoid in Fig. 2, a light echo should have been observed by the 1995 WFPC2 observation, with , or . The nondetection of such a light echo indicates that either the sheet of gas and dust does not extend closer to the supernova or that it becomes thicker and less dense, which diminishes the surface brightness of the echo. Comparing the detection threshold of the 1995 observation with the observed surface brightness of the light echo, we conclude that the dust density of the cloud crossing the 1.8 year ellipsoid must be 10 times less than the region revealed by the light arc.
The cloud extension is also limited by the length of the arc, which indicates that the dust sheet is at least wide.
The surface brightness of the scattered light arc is, in units of flux per square arc second,
in the above equation, is the flux of magnitude 0, and are the location and thickness of the dust sheet as explained in the above subsection, is 206265, is the dust column density in unit of , is the radius of the grain, is the normalized grain size distribution. is the scattering efficiency of the dust. is the phase function as in Schaefer (1987) where is the scattering angle. The quantity is the elapsed time since supernova explosion, is the observed un-dereddened light curve, which we took the UBVRI photometry of the first 120 days (c.f., Lewis et al. 1994). The function in the integral determines which part of the light curve is scattered by dust at location .
The existence of interstellar dust has long been established from, for example, the interstellar extinction curve. Fitting to the interstellar extinction curve gives the composition and size distribution when combined with other constraints such as cosmic abundances, gas-to-dust ratios, interstellar physical conditions, and optical properties of the grains. Mathis et al. (1977) conclude that the simplest description that fits the observations and the general constraints is of a mixture of uncoated graphite and silicate grains, with a common power law size distribution . This description seems to be valid over the entire sky, giving rise to the approximately uniform interstellar extinction laws. Local variations from this composition do exist. For example, Bromage & Nandy (1984) show that the extinction curve toward SMC does not show the bump that are due to small graphite grains, and conclude that the usual graphite contribution is at least a factor of seven weaker than the ’normal’ galactic dust. In our calculation, we considered models of different mixture of silicate and graphite, with size limits taken as for silicate grains and for graphite grains (Mathis, Rumpl, and Nordsieck, 1977). The grain properties are taken from Draine’s calculations (Draine et al. 1984).
![[Uncaptioned image]](/html/astro-ph/0206070/assets/x3.png)
![[Uncaptioned image]](/html/astro-ph/0206070/assets/x4.png)
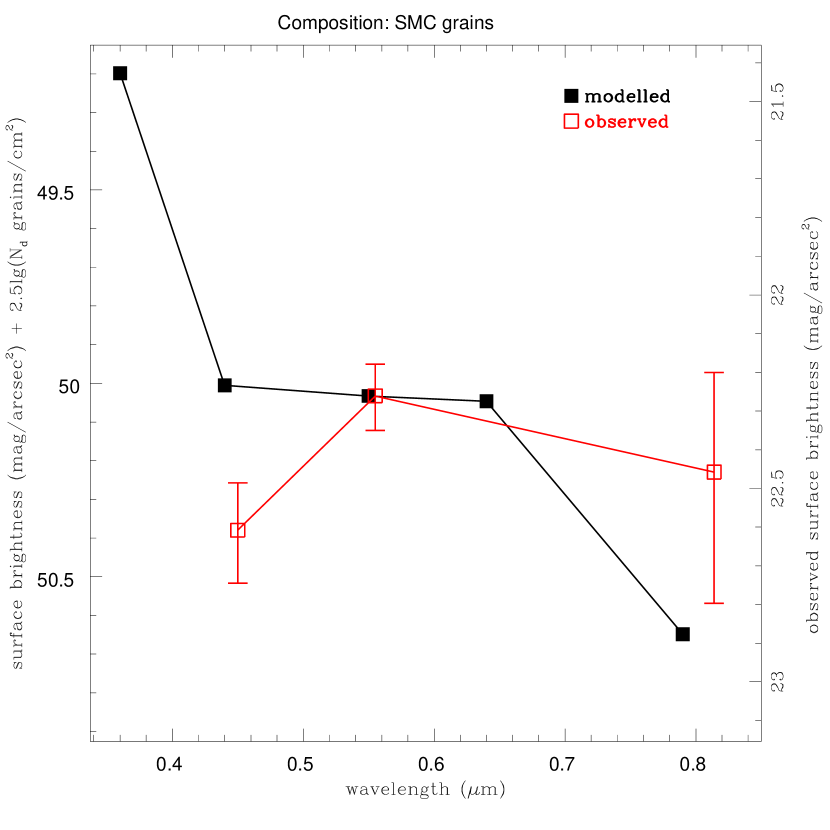
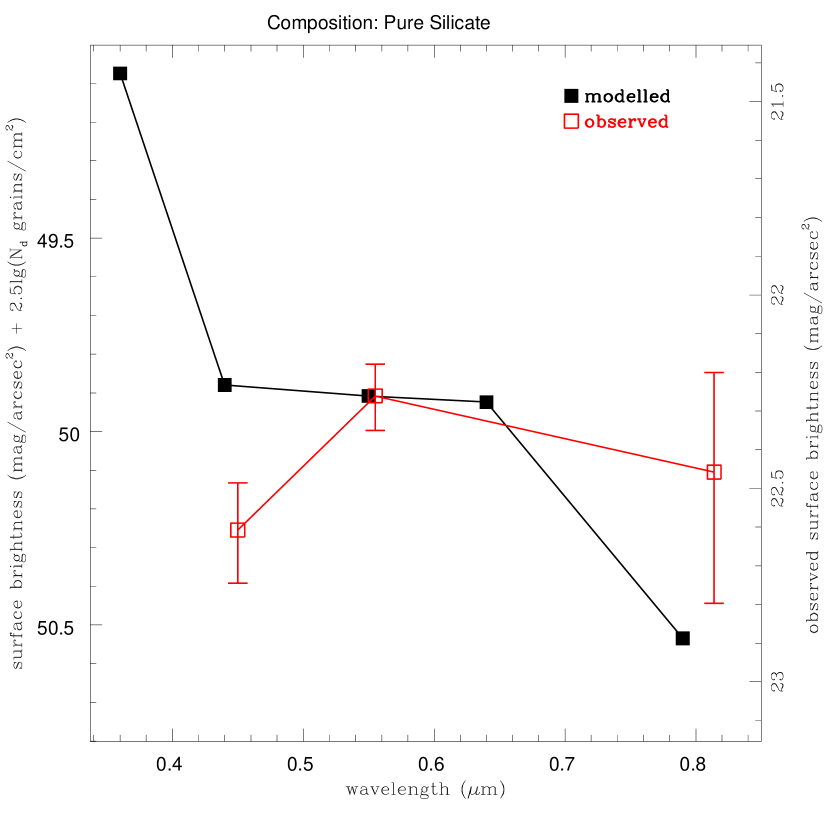
The observed surface brightness and the calculated values in UBVRI for four grain models are shown in Fig. 3. By comparing with the observed surface brightness, the grain column density can be obtained. Although the scattering effeciency is greater for blue light, the scattered light in B band is no brighter than V and R band, due to the fact that the supernova light in B band is much fainter than in redder bands. In our pure graphite model (model A), the scattered light in R and I band is much brighter than in B and V band. This feature, however, can not be used to exclude the pure graphite model due to the large measurement uncertainties. The other models, the Galactic grain model (model B), the SMC grain model (model C) and the pure silicate model (model D), are consistent with the data. For a pure silicate model, comparing measured V band surface brightness with the model, a grain column density can be infered.Given that the dust sheet is about wide, this leads to a grain density of , about 1000 times denser than the intercloud density (;Allen 1976). This density increases when more graphite is introduced into the model. For the Galactic grain model, the inferred grain density is , which corresponds to a Hydrogen column density if we adopt an empirical relation, (Bohlin et al. 1979) .
Further constraints may be placed when we consider the extinction of star light due to these dust, which can be obtained by
The extinctions in standard UBVRI bands are listed in table 2 for the four models. The pure graphite model can be rejected by this extinction argument, since a grain column density of is needed to produce the observed surface brightness and will cause an extinction , which is much larger than the observed extinction of SN 1993J of (Richmond et al. 1994), and would have blocked all background stars in the 1995 observation.
| Model | |||||
|---|---|---|---|---|---|
| A | 2.54 | 2.12 | 1.68 | 1.43 | 1.12 |
| B | 0.37 | 0.30 | 0.23 | 0.20 | 0.15 |
| C | 0.19 | 0.15 | 0.11 | 0.09 | 0.07 |
| D | 0.16 | 0.13 | 0.09 | 0.08 | 0.06 |
4 Conclusions
We have presented the WFPC2 observation of a light echo around SN 1993J after 8.2 years of supernova explosion. This light echo is due to light scattered from a dust cloud about in front of SN 1993J, about thick and wide, revealing the existence of a sheet of dust (and gas) in another galaxy. The dust inferred from the light echo surface brightness is 1000 times denser than the intercloud dust. The graphite to silicate fraction can not be determined by our BVI photometric measurements, however, a pure graphite model can be excluded based on comparison with the data.
Aside from studying the geometric structure of the interstellar medium in other galaxies, a light echo can be used to determine the distance to the host galaxy. To accomplish this, one needs to measure the expansion rate of the light echo. With future observations, we should be able to determine this expansion rate and obtain a measurement of the distance independent of that obtained by using Cepheid variables.
References
- (1) Allen, C.W.,1976, Astrophysical Quantities, 3rd edition, P.265
- (2) Bartel, N., Bietenholz, M. F. et al., 2000, Science, 287,112
- (3) Bohlin, R., avage, B. D. & Drake, J. F. 1978, ApJ, 224, 132
- (4) Bromage, G.E. & Nandy, K. 1983, MNRAS, 204, 29
- (5) Cappellaro, E. et al., 2001, ApJ,549,L215
- (6) Couderc, P. 1939, Ann. d’Ap.,2,271
- (7) Lewis, J. et al. 1994, MNRAS, 266,27
- (8) Lundqvist, P. & Fransson, C. 1991, ApJ, 380, 575
- (9) Mathis, J., Rumpl, W. & Nordsieck, K. 1977, ApJ, 217,425
- (10) Panagia, N et al. 1991, ApJ, 380, L23
- (11) Richmond, M. et al. 1994, AJ, 107,1022
- (12) Schaefer, B., 1987, ApJ, 323,L47
- (13) Schmidt, B. et al. 1994, ApJ, 434, L19
- (14) Sparks, W. et al. 1999, ApJ, 523,585
- (15) Xu, J., Crotts, A. & Kunkel, W. 1995, ApJ, 451, 806