A Comprehensive Study of Pulse Profile Evolution in SGR 1806-20 & SGR 1900+14 with the RXTE PCA
Abstract
Soft Gamma Repeaters undergo pulse profile changes in connection with their burst activity. Here we present a comprehensive pulse profile history of SGR 1806-20 and SGR 1900+14 in three energy bands using Rossi X-ray Timing Explorer/Proportional Counter Array observations performed between 1996 and 2001. Using the Fourier harmonic powers of pulse profiles, we quantify the pulse shape evolution. Moreover, we determined the RMS pulsed count rates (PCRs) of each profile. We show that the pulse profiles of SGR 180620 remain single pulsed showing only modest changes for most of our observing span, while those of SGR 1900+14 change remarkably in all energy bands. Highly significant pulsations from SGR 1900+14 following the 1998 August 27 and 2001 April 18 bursts enabled us to study not only the decay of PCRs in different energy bands but also their correlations with each other.
1 Introduction
Soft gamma repeaters (SGR) constitute a small class of isolated neutron stars; four are currently well-established while one more source remains an unconfirmed candidate (Cline et al. 2000). As their name indicates, SGR emission is repetitive: during their active states each source emits hundreds of short (duration 0.1 s), intense (at super-Eddington luminosities) bursts of hard X-rays / soft gamma-rays at random intervals. Very rarely, (observed once so far from each of SGR and ) they emit a giant flare, an event with 104 higher luminosity than the typical short events (Mazets et al. 1979, Hurley et al. 1999a, Feroci, et al. 2001). Thompson & Duncan (1995; henceforth TD95) proposed that the SGR burst activity is associated with the strong magnetic field (B 1014 G) of the neutron star. Their model, also known as the magnetar model, attributes SGR bursts to various levels of fracturing of the neutron star crust by the motion of the anchored lines of their strong magnetic fields (TD95, Thompson & Duncan 2001).
SGR sources were established as a new class in the mid 80s based on their bursting properties. The first X-ray counterpart of an SGR was discovered in 1993 with the Japanese satellite ASCA (Murakami et al. 1994) after SGR triggered the Burst And Transient Source Experiment (BATSE) onboard the Compton Gamma Ray Observatory (CGRO) (Kouveliotou et al. 1994). All four SGRs are currently associated with persistent X-ray point sources with luminosities 1034 1035 ergs s-1. Their energy spectra are nominally fit with a single power law with photon indices , except in the case of SGR , where a two component spectrum (blackbody of and power law with index ) has been established with BeppoSAX and Chandra observations (Woods et al. 1999a, Kouveliotou et al. 2001).
Observations of SGR with the Rossi X-Ray Timing Explorer (RXTE) Proportional Counter Array (PCA) on November 1996 led to the discovery of the first SGR spin period of 7.47 s. Further RXTE/PCA observations established that the source exhibited a very rapid spin-down rate of 8.1 10-11 s s-1, providing the first direct measurement of the neutron star magnetic field of 2 1014 G111Assuming that the star slows down via magnetic dipole radiation, Bd ., in agreement with the magnetar model of TD95 (Kouveliotou et al. 1998a). ASCA observations of SGR in 1998 led to the discovery of a spin period for that source (Hurley et al. 1999b) and to the detection of its rapid ( s s-1) spin down rate (Kouveliotou et al. 1999). Of the two remaining SGRs, SGR has been associated with an 8 s spin period, originally seen as intensity modulation in the decaying tail of the giant flare it emitted in 5 March 1979 (Mazets et al. 1979). A pair of recent Chandra observations of this source during quiescence spaced 1 year apart should establish the periodicity and spin down rate of SGR (Kulkarni et al. 2002). The last source, SGR , is the dimmest of them all and no spin modulation has been detected in its persistent X-ray flux (Kouveliotou et al. 1998b).
In 1998 we started a monitoring campaign with RXTE/PCA for the two SGR sources with clearly established spin and spin down rates. Our observations so far have shown that these spin down rates vary significantly, sometimes by a factor of four, and that they exhibit a very high level of timing noise (Woods et al. 2000, 2002). Earlier results have also indicated a relationship between the pulse profile complexity and the activity history of the source (Woods et al. 2001). In this paper we construct the first detailed history of the pulse profile evolution of SGR and SGR spanning the last 5 years, and we examine their evolution with energy. We quantify the profile changes by estimating the power in their respective Fourier harmonics. In Section 2, we describe our observations and how we deal with the X-ray background component in our data. In Section 3, we describe the methodology of our data analysis and present the results; we discuss the implications of our results in Section 4.
2 Observations
The RXTE/PCA has 5 identical Proportional Counter Units (PCUs) with a total effective area of 6500 cm2, a field of view of FWHM, and is sensitive to photon energies between keV. Also onboard RXTE, the High Energy X-ray Timing Experiment (HEXTE) consists of two clusters of NaI/CSI scintillation detectors sensitive to photon energies of keV. Although we searched the HEXTE data, we have not detected any pulsations at the SGR frequencies; therefore, here we present only results obtained with the RXTE/PCA.
During our ongoing monitoring campaign and also during occasional target of opportunity observations when burst activity was detected, we have observed SGR and SGR with RXTE over 2 Ms. In Table 1 we list the observation epochs, their date ranges, number of observation and total (on source) exposure times of each epoch for SGR . Similarly, in Table 2 we list those for SGR with an extra column where we report the occasional presence of 4U and XTE J in the PCA field of view.
For each observation we used the seextract utility of FTOOLS 5.0, to generate the source intensity light curves from the event mode PCA data with 0.125 s time resolution in 3 energy bands: keV, keV and keV. We filtered out the times of data anomalies, such as times of large pointing offsets and times of SGR burst activity, using the appropriate housekeeping data to obtain the persistent SGR emission plus the background. As the PCA is currently operating with varying number of PCUs, we normalized the rates of each time bin to the number of active PCUs. Finally we corrected the photon arrival times to the solar system barycenter using fxbary for observations prior to 2000 December 31 and faxbary for the later ones.
2.1 Background Issues
Estimating the X-ray background emission with the PCA is not a trivial problem. We had to account for various background components included in the observed emission simply due to the relatively large field of view of the PCA. Since both SGRs are located in the galactic ridge region, there are also inevitably other sources occasionally active in the same field. During the vast majority of these observations the count rates of both SGRs were very low in comparison to the total (source + background) count rate; namely in 1996 epoch of SGR 180620 the average total rates in keV, keV and keV bands were 44.32, 51.76 and 47.36 counts s-1 PCU-1, respectively, while the expected source count rates (estimated by employing WebPIMMS with a interstellar medium attenuated [NH = 6.1 1022 cm-2] power law model [ = 1.97], Mereghetti et al. [2000]) were 0.35, 0.57 and 0.31 counts s-1 PCU-1, respectively. Similarly the average observed count rates for SGR 1900+14 were 39.36, 49.52 and 50.32 counts s-1 PCU-1 in three energy bands, whereas the expected source rates were only 0.27, 0.35 and 0.19 counts s-1 PCU-1 (using the spectral model of a blackbody [kTBB=0.5 keV] plus a power law [ = 2.1], both attenuated by the interstellar absorption [NH = 2.3 1022 cm-2], Kouveliotou et al. [2001]). Below we describe the different components that contribute to the background of each source and our efforts to determine their values. Nonetheless, we are unable to estimate the background level with enough accuracy to determine the source count rates.
(i) Instrumental Background: This is due to events created by the particles in the vicinity of the instrument. For each observation, we have created a PCA background event data file using the faint background models (provided by the PCA instrument team for each epoch). We then extracted the background light curves in all 3 energy intervals and processed them as described in Section 2. We then determined the average background rate per PCU per epoch.
(ii) Galactic Ridge Contribution: There have been numerous attempts to model the diffuse emission of this region. The most recent and extensive one is by Valinia & Marshall (1998) using RXTE measurements. We reproduced the diffuse galactic ridge spectrum by employing their estimated parameters of a two-component thermal plasma plus power law model for their R1 region (within which both SGRs are located) and the PCA response matrix (with all 5 PCUs operating). We then estimated the count rates (per PCU) in each of our energy bands for each epoch.
(iii) Point X-ray Background Sources: There are two known point X-ray sources in the vicinity of SGR ; 4U (a persistent X-ray pulsar with spin period of 440 s, located 0.51∘ away from the SGR) and XTE (a transient X-ray pulsar with 89 s spin period at 0.28∘ away). For the former source, we have used the average spectral model parameters and flux given by Roberts et al. (2001) to estimate its count rate. We then used the PCA collimator response at the pointing offset to this source during each observation to estimate the rates from 4U that would be present during our observations. For the latter source, Wilson et al. (2002) have performed an extensive search for periods of outburst activity, using the same data set presented here up until the end of 2000. They determined two active episodes, one each in 1996 and 1998. We then determined the expected rates from XTE by using their best model parameter estimates for each of the outburst periods, following the same procedure as for the former source.
After subtracting the background contribution estimated by taking account all the above described components, we constructed the keV and keV pulse profiles for each source. We then compared our results with those obtained (within the same energy bands) from contemporaneous measurements with imaging instruments (BeppoSAX/NFI observations of SGR in September 1998 and Chandra/ACISS observations of SGR in August 2000). Even though the pulse profiles resembled each other significantly, the RMS pulse fractions obtained with the PCA measurements were smaller than those of BeppoSAX or Chandra by a factor of 3. (Here we define the pulse fraction as , where R represents the count rate in each phase bin). These results indicate that there is still a significant background contribution in our data, or alternatively, that despite all our efforts we still severely underestimate our background. Although we cannot accurately determine our source of error, we believe that it is mostly due to underestimating the galactic ridge background contribution. We will refrain, therefore, in the following from calculating pulse fractions or hardness ratios (ratios of different energy fluences) that are based on background-subtracted data and will use the background-independent method described in Section 3 to draw physical conclusions on the pulse profile properties.
3 Pulse Profiles
In several of our observations the sources were offset from the center of the PCA field of view to either reduce the likelihood of saturation from bursts (when they were very active) or to reduce occasional contributions from other transients. We have taken these pointing offsets into account by applying the appropriate collimator response corrections for all datasets. We then created pulse profile histories in three energy bands (, and keV) for each source using phase-connected pulse ephemerides reported elsewhere (Woods et al. 1999b, 2000, 2002).
We quantify the pulse profile shapes (and changes) with the powers of their Fourier harmonics: for each source, we Fourier transformed each profile and calculated the normalized Fourier Powers (FP) of the first 5 harmonics as follows. We first estimated the powers as Pk = 2(a + b)/(, where ak and bk are the coefficients of the sine and cosine terms of the Fourier series, respectively, and and are the standard deviations of these coefficients. This is equivalent to the Leahy normalization standardly used in X-ray astronomy. Using the formalism described by Groth (1975) with the estimated power values, we measured the median and 68 % significance level of the Groth distribution. We then corrected the estimated powers for the binning of the pulse profile, which is a prominent effect on the powers of higher harmonics, using equation 2.19 of van der Klis (1989). The resulting powers of each profile were then normalized by the total power.
We have applied the following procedure to obtain a quantitative measure of the level of pulsed intensity of the source during each observation. We estimated the average count rate, , of each profile and then calculated the rms pulsed count rate, , per source as , where Ri is the count rate in each phase bin, are the associated Poisson statistical errors and N is the number of phase bins (which is 20). Typically, is about 23, 9 and 37 of for the , and keV pulse profiles of SGR . Note that the above percentage can be as high as 81 if the pulsation is very weak. The rms value of the pulsed count rate is a background-immune measure and provides a reliable indicator of the pulsed intensity.
3.1 SGR
We exhibit in the three upper panels of Figure 1 the pulse profile changes over time and energy of the source. Note that the rates in the profiles are in arbitrary units on account of the background contamination as explained in Section 2. The bottom panel displays the quantitative evolution of the harmonic contents in its Fourier spectrum. At all epochs, we find that most of the power is in the first harmonic of the Fourier spectrum.
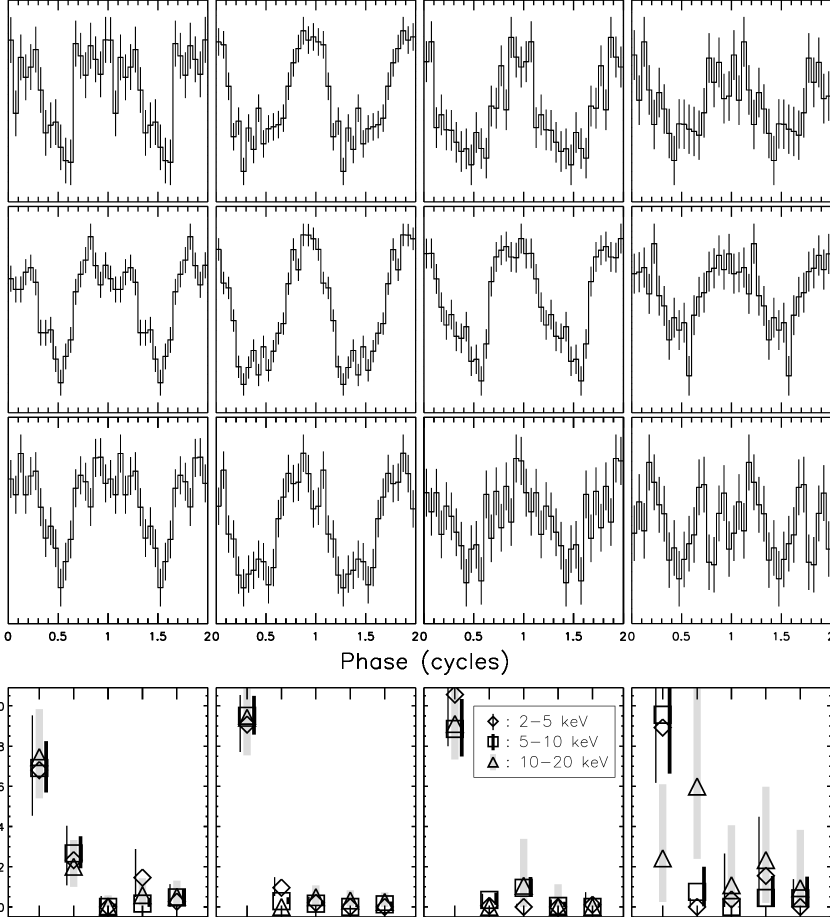
As reported in Woods et al. (2002), observations between 2000 July 4 to September 3 could not be phase connected. For these data we employed a phase-aligning technique to obtain the overall pulse shape. We first created a template pulse profile using 55 days of a phase-connected timing solution (data between 2000 May 2 and June 25). We then folded each of our non-phase connected data sets at the spin frequency measured for these data sets (Table 3 in Woods et al. 2002). Next, we determined the phase offset of each profile with respect to this template by fitting the first four Fourier coefficients of the folded profile to the same coefficients of the template as described in Finger et al. (1999). Then, finally we aligned the profiles, and obtained the average pulse shape for the 2000 epoch of the source. The relative alignment errors were small (less than 5 ) so that this process should not introduce any significant smearing of the pulse profile.
The pulse harmonic content before and during the 1996 source activation is distributed into two harmonics. We investigated the evolution of the pulse profile during our two week long RXTE observations in 1996 (which is the last period where we observe a complex profile) by subdividing our data into three sets of 45 ks each. We find that all profiles are consistent with each other, showing no major changes in complexity. In 1999 and 2000, the pulse profiles are significantly sinusoidal and resume a marginally more complex shape during late 2001. As the source was barely active during this latter period, however, the pulsed signal is weaker and almost undetectable above 10 keV. In general, the pulse profiles are relatively wide, covering 80% of the phase cycle, except in the 1999 observations where it becomes narrower covering of the cycle.
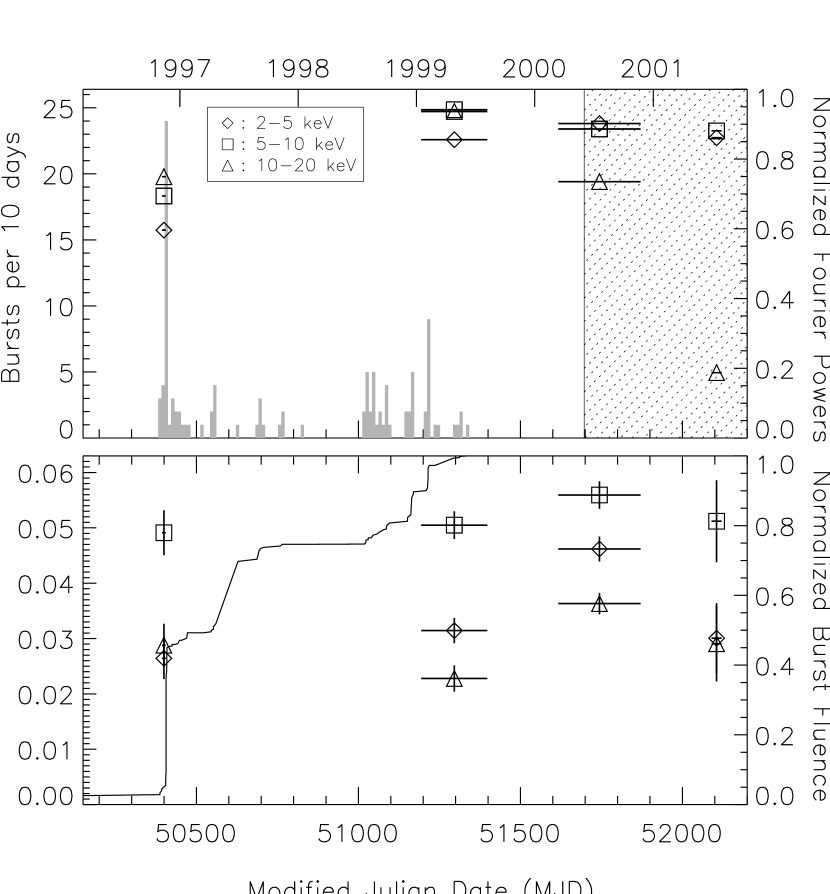
To investigate the dependence of the pulse shape on the source activity we plot in the upper panel of Figure 2 the source burst activity (grey histogram) detected with BATSE covering the period of our RXTE monitoring program until the reentry of CGRO on June 2000. The data points in the plot are the values of the normalized Fourier power in the first harmonic only (in three energy bands). The power increases during 1999 and reduces down to the 1996 level in 2001. The bottom panel in Figure 2 exhibits the rms pulsed count rate of the source in each energy range overplotted on the cumulative energy distribution of all bursts from the source detected with BATSE since 1996. We note that the count rate (and thereby the source pulsed flux intensity) remains fairly constant during our observations and that the pulsed rates between keV are always larger than those in each remaining energy band. There is no measurable variability in the rms pulsed count rate with burst activity. There is, however, intense burst activity between our pulse shape measurements in 1996 and 1999 which may be the cause for this pulse shape change (see also §4).
3.2 SGR
We have performed a similar analysis for SGR . Figures 3 through 5 exhibit the pulse shape and its harmonic content evolution over a series of quiescent and active episodes of the source.
In 1996, the source was in quiescence with no burst activity detected. A three-peak pulse profile is seen in all three energy bands, with all peaks aligning in phase (Figure 3, left column). As we can also see in the FPs plot, the majority of power is in the third harmonic of each profile. The distinct, rapid, large modulation in the 1020 keV has not been seen with similar significance in any other epoch. Even though the source entered a burst active episode in the end of May 1998 (emitting numerous, short SGR bursts), the shape of its pulse profile resembles the one of the 1996 observations (Figure 3, middle column).
On 27 August 1998, however, SGR emitted a ‘giant flare’ as described in the Introduction. In the tail emission of this burst, which was strongly modulated at the spin period of the neutron star, Feroci et al. (2001) observed a highly significant four-peaked pulse profile (between t+40 s and t+90 s, where t is the trigger time of flare); the profile became almost sinusoidal at t+300 s. Our August 1998 pulse profile here covers four days starting the day after the burst. The pulse profile is also simplified to a broad main pulse plus a secondary peak (or shoulder) at 0.8 (Figure 3, right column). The main pulse covers almost half the spin cycle.
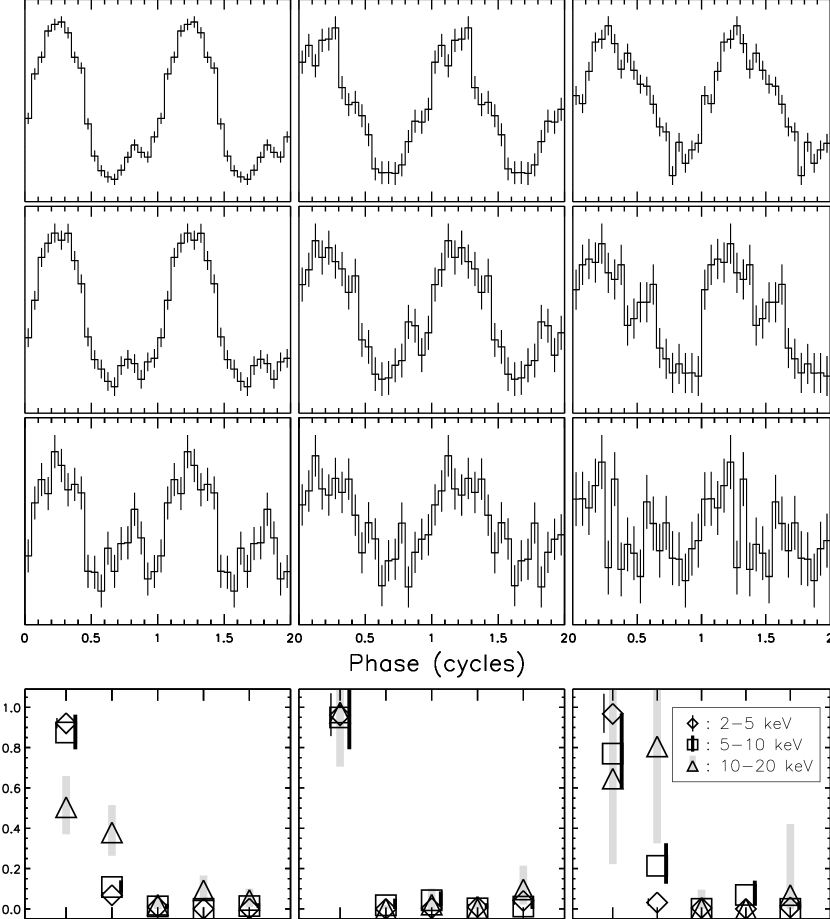
Over the next 2 months after the giant event, the 25 keV band pulse profile remained almost identical to that of the very short epoch soon after the flare (Figure 4, left column). In the 510 keV profile, the main pulse structure did not change but there is some evidence that the secondary peak feature appears earlier in phase than in the 25 keV profile. The secondary peak structure is more significant between keV during this epoch. The main pulses in 1020 keV during both August 1998 and September-October 1998 cover a slightly shorter phase (compared to the lower energy bands) and display sharp rise and fall times.
SGR observations between 1999 January 25 and July 27 could not be phase connected (Woods et al. 2002). Similar to SGR , we used the pulse profile of a 14 day segment of phase connected data early in January 1999 as our template. With this template and using individual pulse frequency measurements for non-phase connected observations as given by Woods et al. (2002) we employed the same phase-aligning procedure to get the average pulse profile of SGR in 1999 (Figure 4, middle column). The 25 keV and 510 keV profiles are described by a broad single pulse covering almost 75% of the phase cycle; there is no evidence of a secondary peak in the FP in all bands.
In 2000, the pulse profiles in the 25 keV and 510 keV bands are dominated by a single pulse with 75% of phase coverage (Figure 4, right panel). Both profiles show a sharp rise followed by a gradual fall. The high power in the second harmonic of the 25 keV band is due to the emission enhancement around 0.6. In this epoch, only weak pulsations were seen in the 1020 keV energy band.
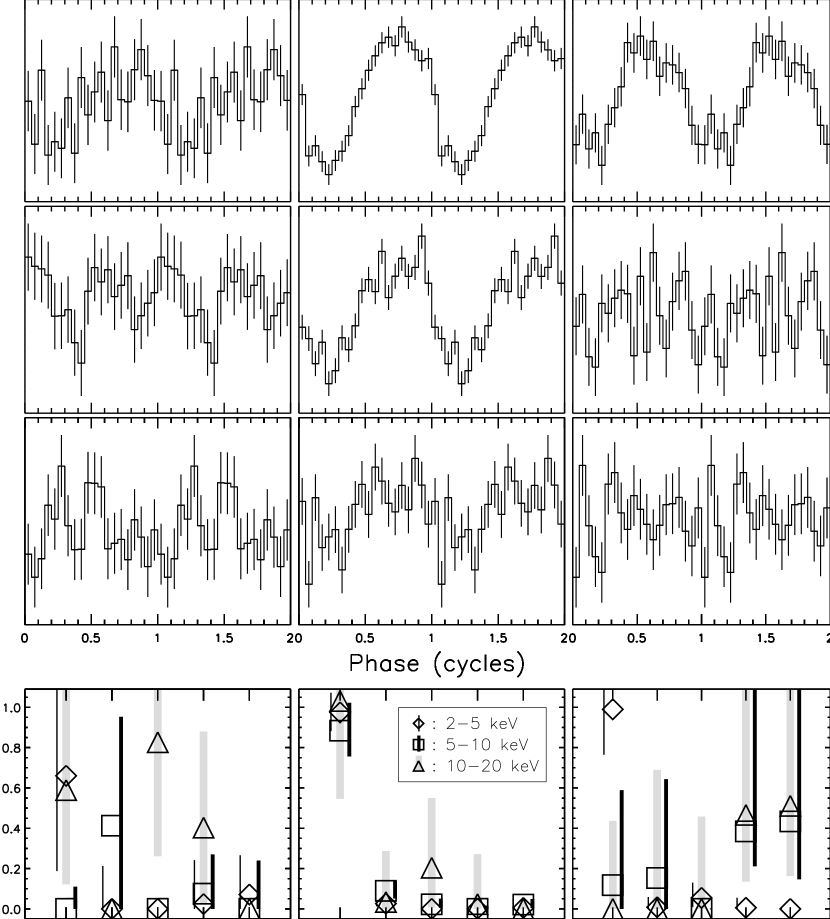
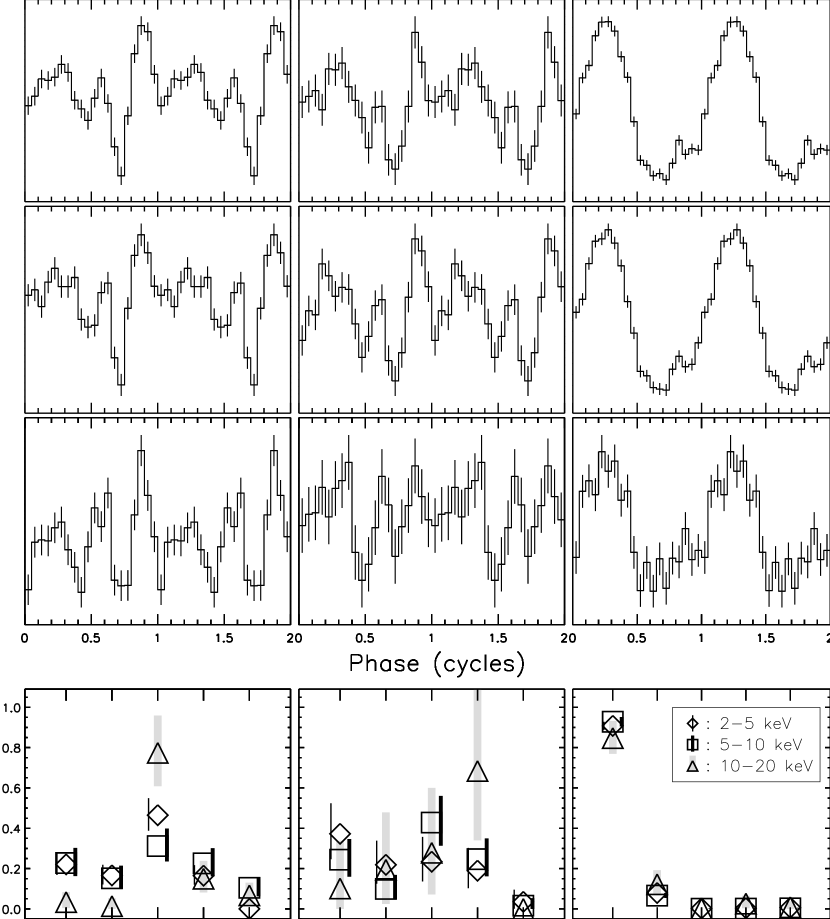
Our ongoing SGR monitoring campaign with RXTE revealed that SGR was in quiescence at least over the last 8 months in 1999 and throughout 2000. The source entered a new episode of burst activity starting with an intermediate intensity SGR flare detected on 18 April 2001 (Guidorzi et al. 2001). This event resembled the August 27 giant flare in some respects but was weaker energetically. Only four days prior to the reactivation, we performed a regular RXTE monitoring observation. We show the pulse profiles obtained from this observations in Figure 5 (left column). The signal is extremely weak and does not allow detection of pulsations in any of the energy bands except the 25 keV.
The reactivation of the source initiated a series of ToO observations whose timing results are presented in Woods et al. (2002). Using the spin ephemeris we determine the profiles shown in Figure 5 (middle column). Even though the change in pulse shape after the April 18 intermediate flare is not as dramatic as the one after the August 27 giant flare, the pulse profile becomes significantly more sinusoidal following this event. In the 25 keV profile, we observe one of the broadest single pulse structures ever seen from this source. In July 2001, the long term monitoring campaign observations with RXTE were resumed. We observe significant pulsations only in 25 keV profile which is being well described by a single pulse (Figure 5, right column).
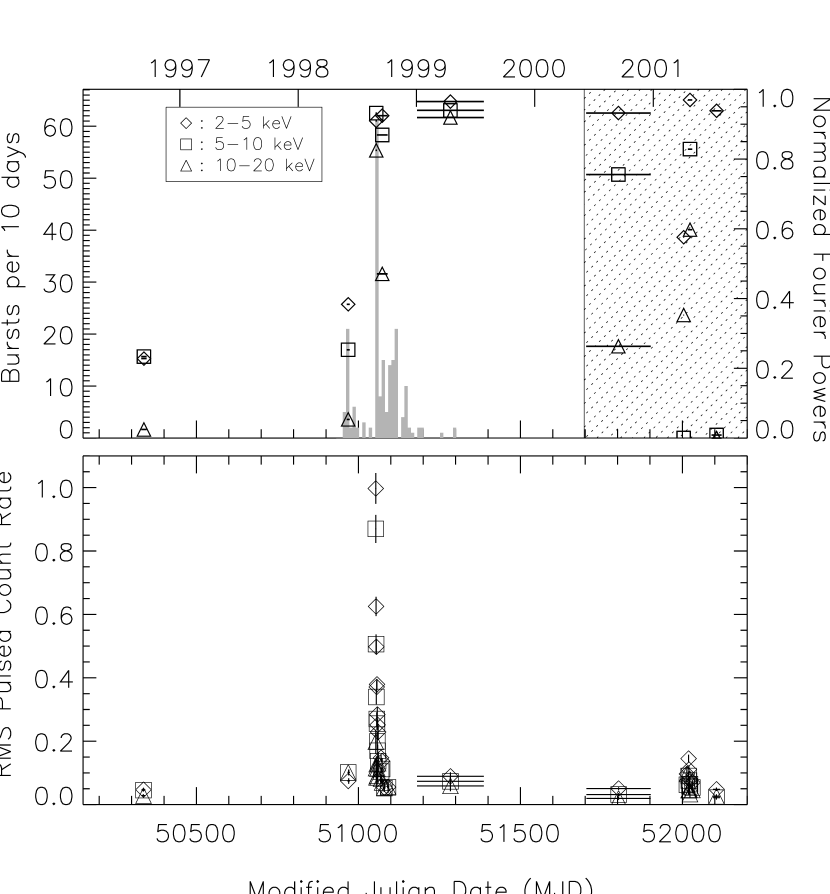
Next, we plot the burst activity of SGR 1900+14 (grey histogram) versus the power in the first harmonic (Figure 6 upper panel), as was done for SGR 180620. We notice that the pulse in each energy band is strongly sinusoidal after the August 27 flare, while complex before, consistent with previous results (e.g. Woods et al. 2001). We do not have good enough statistics to determine the pulse profile immediately before the April 18 event, however, there is a significant reduction in power at the second harmonic from the year 2000 to post-April 18. In the bottom panel of Figure 6 we plot the PCR of the source over time. We clearly see that the pulsed count rate follows the quiescent source flux trend reported by Woods et al. (2001). The pulsed count rate increases significantly after the August and April large and intermediate flares, respectively; it resumes its background value in all other intervals. We expand on these results in the next section.
4 Discussion
Earlier results (Woods et al. 2001) have shown that the persistent flux of SGR decayed as a power law for almost 40 days following the August 27 flare (F t-0.71). We have very good statistics in our data to study the pulsed count rates (PCR) measured during the decay of this event. In Figure 7 (top panel) we expand the tail of the event into ten individual measurements of PCRs in 3 energy bands over a 20-day interval. The horizontal lines in the plot denote the PCR levels in the 25 keV (dashed line), 510 keV (dot-dot-dot-dashed line) and 1020 keV (dot-dashed line) during the quiescent state of the source in 1996. Following the giant flare, the values of the PCRs increased by a factor of 21, 19, and 7, in the 25 keV (PCR1), 510 keV (PCR2), and 1020 keV (PCR3) bands, respectively, over their quiescent levels. The middle and bottom panels of Figure 7 exhibit the ratios of PCR1 to PCR2 and PCR1 to PCR3, respectively. These trends can be interpreted as reflecting the spectral variations of the pulsed emission during the decay of the flare. The PCR1/PCR2 values varied between 1.14 0.03 and 1.67 0.16, always significantly higher than the non-active episode value of 1.03. There is statistically significant variability in this softness ratio as a function of time, but the changes are relatively small in amplitude ( 40). The PCR1/PCR3 ratio (the bottom panel) shows a clear hardening of the spectrum after the first 3 days of the decaying tail of the August 27 flare.

Figure 8 describes the decay behavior of the April 18, 2001 intermediate flare from SGR . The pulsed count rates here increased by a factor of 3.6, 2.6 and 2.2., for PCR1, PCR2, and PCR3, respectively, again with respect to their quiescent values measured in 1996. As we also see in the middle panel, the decay of PCR1 and PCR2 are similar and their ratio is consistent with an average of 1.33, and there is marginal evidence of hardening starting 2 days after the event onset (bottom panel). Overall the soft-to-hard rate ratios are consistent with their quiescent values.

To compare the evolution with energy of the pulsed count rates in both sources, we plot in Figure 9 their PCR1 vs PCR2 (squares) and PCR1 vs PCR3 (triangles). The left panel of Figure 9 exhibits all data points for SGR 180620 (filled symbols), together with measurements for SGR 190014, when the source was in the same (quiescent) state (open symbols). For SGR 180620 we find no correlation neither between PCR1 and PCR2 (filled squares), nor PCR1 and PCR3 (filled triangles).
The right panel of Figure 9 exhibits all our data points for SGR , in both its quiescent and active states. We find no correlation between PCR1 and PCR3, but we find that PCR1 and PCR2 are strongly correlated with Spearman’s rank order correlation coefficient, = 0.99 and the probability of getting such a correlation from a random data set, Pc = 3.6 10-8. We noticed, however, that there seems to be a break in the trend at very low values, so we reanalyzed these points separately. We find that a fit to PCR yields a slope of 0.91 0.05 ( = 1.06); below this value, the fit has a slope of 0.69 0.07 ( = 0.93). The insert in Figure 9 (right panel) shows the extrapolation of both fits within the dashed line box. PCR3 remains constant above PCR. We should note here, that all values outside the box belong to the decaying tail of August 27, 1998, while within the box, we have points from the same event as well as following the intermediate flare of April 18, 2001 and the quiescent source emission.

SGR 1900+14 has shown dramatic pulse profile changes on a timescale of minutes associated with burst activity, in particular during and after the giant flares. Unlike SGR 1900+14, changes in the SGR 180620 pulse profiles are not drastic, but significant (c.f., those in 1996 and 1999 in Figure 1). Since our RXTE observations in 1996 ended before the peak of burst activity from this source was recorded with BATSE, we looked at the energetics of bursts seen with BATSE after the end of the RXTE data. The energy of BATSE events seen during the RXTE coverage comprise only 5 of the total energy (ETOT,BATSE) of all events seen with BATSE over 4 years (starting in 1996). Interestingly, bursts detected over the next 5 days following our last RXTE observations in 1996 contained 40 of ETOT,BATSE. The later (1999) simplification of the pulse profile of SGR 180620 may, therefore, have its onset during this intense burst active phase in 1996, similar to the effect of the 1998 August 27 giant flare in the pulse profile of SGR 1900+14.
5 Conclusions
We have performed a detailed analysis of the persistent X-ray pulsed flux data from two Soft Gamma Repeaters, SGR 1900+14 and SGR 1806-20. In both sources, we find a strong trend of their pulse shapes to transition from complex to very smooth, following burst active episodes. Our analysis of the decaying tail of the 27 August giant flare from SGR 1900+14, has shown that as the persistent source spectrum softened, the pulse count rates in the 2-5 keV band varied in tandem with those of the 5-10 keV; the 10-20 keV pulsed count rates remained constant, albeit slightly above their pre-flare values. Further, we observe a change in the correlation slope of the pulsed count rates in the lower energy ranges (2-5, and 5-10 keV) during quiescence or low activity of the source, suggesting that the 2-5 keV photons are more efficiently produced during non-burst active periods.
Recently, Thompson, Lyutikov & Kulkarni (2002; TLK hereafter) have suggested a model, whereby the persistent X-ray emission of a magnetar is due to currents generated when the interior magnetic field twists up the external magnetic field. The structure we observe in the pulse profile of SGRs could then be attributed to a complicated distribution of currents and magnetic fields close to the neutron star (higher multipoles) seen through a largely transparent magnetosphere. However, the observed transition of complex to smooth in the pulse profiles is not accompanied by spectral and intensity changes, as would be expected in that case from a simplified magnetic field (current) after the source returns to its quiescent flux level. Alternatively, re-scattering of the X-rays either at km by non-axisymmetric currents, or at 100 km by plasma suspended against gravity by the resonant e- scattering force, may be the cause of the profile smoothness. The apparent difficulty to retain the suspended plasma in the magnetosphere (it would be quickly drained to the neutron star surface by even a modest electrical current), points towards the re-scattering screen above 100 km as the most plausible of these two explanations for the transition. The current then would in principle be generated by a static twist (TLK 2002), consistent with the observed absence of a direct correlation between the increase in the neutron star spin (torque) with burst activity (Woods et al. 2002).
Concluding, we believe that our results provide evidence for an association of the complex(smooth) profile of the SGR pulses with the re-scattering of X-rays above 100 km from the neutron star surface, depending on whether the currents created by the static twist described by TLK (2002) are non-axisymmetric(axisymmetric). The rapid spindown observed in SGRs should then be coupled to the smoothening of their pulse profiles; we are currently investigating further correlations between all these SGR properties.
References
- (1)
- (2) Cline, T.L., et al. 2000, ApJ, 531, 407
- (3) Feroci, M., Hurley, K., Duncan, R.C., & Thompson C. 2001, ApJ, 549, 1021
- (4) Finger, M., et al, 1999, ApJ, 517, 449
- (5) Groth, E.J., 1975, ApJS, 29, 285
- (6) Guidorzi, C. et al. 2001, GCN Circular 1041
- (7) Hurley, K., et al. 1999a, Nature, 397, 41
- (8) Hurley, K., et al. 1999b, ApJ, 510, L111
- (9) Kouveliotou, C., et al. 1994, Nature, 368, 125
- (10) Kouveliotou, C., et al. 1998a, Nature, 393, 235
- (11) Kouveliotou, C., et al. 1998b, IAU Circular 6944
- (12) Kouveliotou, C., et al. 1999, ApJ, 510, L115
- (13) Kouveliotou, C., et al. 2001, ApJ, 558, L47
- (14) Kulkarni, S., et al. 2002, Nature, submitted
- (15) Mazetz, E.P., et al. 1979, Nature, 282, 587
- (16) Murakami, T. et al. 1994, Nature, 368, 127
- (17) Mereghetti, S., et al. 2000, A & A, 361, 240
- (18) Roberts, M.S.E., et al. 2001, ApJ, 555, 967
- (19) Thompson, C. & Duncan, R.C. 1995, MNRAS, 275, 255
- (20) Thompson, C. & Duncan, R.C. 2001, ApJ, 561, 980
- (21) Thompson, C. & Lyutikov, M., & Kulkarni, S.R., 2002, ApJ, in press, astro-ph/0110677
- (22) Valinia, A. & Marshall, F.E. 1998, ApJ, 505, 134
- (23) van der Klis, M. 1989, in Timing Neutron Stars, eds. H. Ögelman & E.P.J. van den Heuvel (Dordrecht: Kluwer), 27
- (24) Wilson, C.A., et al. 2001, ApJ, 565, 1150
- (25) Woods, P., et al. 1999a, ApJ, 519, L139
- (26) Woods, P., et al. 1999b, ApJ, 524, L55
- (27) Woods, P., et al. 2000, ApJ, 535, L55
- (28) Woods, P., et al. 2001, ApJ, 552, 748
- (29) Woods, P., et al. 2002, ApJ, in press, astro-ph/0109361
- (30)
| Epoch | Date Ranges | No. of Obs. | Exposure |
|---|---|---|---|
| YY/MM/DD | (ks) | ||
| 1996 | 96/11/0796/11/18 | 12 | 132.4 |
| 1999 | 99/01/1699/08/08 | 43 | 297.9 |
| 2000 | 00/03/1400/11/23 | 87 | 254.4 |
| 2001 | 01/07/0201/07/22 | 12 | 37.5 |
| Epoch | Date Ranges | No. of Obs. | Exposure | Notesaafootnotemark: |
|---|---|---|---|---|
| YY/MM/DD | (ks) | |||
| 1996 | 96/09/0496/09/20 | 19 | 97.7 | J1906(A), 1907 |
| May 1998 | 98/05/3198/06/09 | 5 | 43.5 | J1906(Q) |
| Aug 1998 | 98/08/2898/08/31 | 10 | 33.2 | J1906(Q) |
| SepOct 1998 | 98/09/0198/10/08 | 30 | 126.2 | J1906(A) |
| 1999 | 99/01/0399/07/28 | 41 | 293.1 | J1906(Q), 1907 |
| 2000 | 00/06/0800/12/24 | 93 | 435.6 | J1906(Q), 1907 |
| Pre-Apr 2001 | 01/04/14 | 1 | 9.6 | J1906(N/A) |
| Post-Apr 2001 | 01/04/1901/05/01 | 13 | 111.1 | J1906(N/A) |
| July 2001 | 01/07/0401/07/25 | 22 | 81.5 | J1906(N/A) |
a – Presence of XTE J1906+09 or 4U 1907+09 within the PCA field of view. In paranthesis A, Q and N/A denote transient activity, quiescence and information not available, respectively.