22institutetext: GEPI/FRE K2459 du CNRS, Observatoire de Paris-Meudon, 92195 Meudon Principal Cedex, France
CCD photometry of young open clusters
Abstract
We present CCD photometry for stars in the nuclei of the young double cluster and Persei. We find that the reddening is highly variable through the Per nucleus, increasing from west to east, with values ranging from in the western part to in the south-east. Towards Per the reddening is fairly constant, with . Both clusters share a common distance modulus of 11.70.1 mag., and an age of years.
Key Words.:
Techniques: photometric – Stars: early-type – Galaxy: open clusters and associations: individual: NGC 869 and NGC 8841 Introduction
The precise determination of galactic open clusters main physical parameters plays a central role in the study of the stellar structure and evolution. With accurate photometric data, and once the external variables such as reddening are corrected for, the cluster distances, ages and chemical abundances can be inferred from the study of the photometric colour-magnitude and colour-colour diagrams.
The usual way to obtain the cluster age is by means of isochrone fitting to the main sequence in a colour-magnitude diagram. In the case of young clusters -younger than 50 Myr- isochrone fitting is made difficult by the usual presence of differential reddening across the cluster face, which widens the observed main sequence. Moreover, the presence of emission line stars, like Be o PMS stars, which occupy anomalous positions in the photometric diagrams, additionally contributes to a further main sequence widening. Hence, the fit of a particular isochrone can be a very uncertain process, and it is not difficult to find recent age determinations with very diverging values for a given young cluster.
In a recent paper, Fabregat & Torrejón (fabregat00 (2000)) propose the use of isochrone fitting in the plane of the photometric system as an adequate tool to obtain accurate cluster ages. The range of variation of the index along the B-type sequence amounts more than 1 mag., being significantly larger than most common used photometric colours. Moreover, the index is less affected by reddening, and allows an efficient segregation of emission-line stars.
In order to produce accurate and homogeneous dating for a sample of young galactic clusters, we have undertaken an observational programme to obtain CCD photometry. In this paper we present the first results, related to the clusters and Persei.
The double cluster $h$ and $χ$ Persei is one of the richest young open clusters in the Galaxy, and also one of the brightest and closest to us. On a clear night, far from the light pollution, it can be easily seen with a naked eye, distinctly shining in the Milky Way between Perseus and Cassiopeia constellations. and Persei (NGC 869 and NGC 884 respectively) form the nucleus of the broader Per OB1 association.
The published work on and Persei is very extensive. A summary of the key papers and discussion on the past work is given by Waelkens et al. (waelkens (1990)). Within the literature there is not convergence on the fundamental parameters of the clusters, such as their distances and ages. The discrepancies in the cluster distance moduli are well in excess of 0.5 mag., while there is not agreement about both clusters being of the same or different ages.
Two modern studies based on CCD photometry, presented by Keller et al. (keller (2001)) and Marco & Bernabeu (marco (2001)), converge in a common distance modulus of about 11.7 mag. for both clusters, but still present controversial results regarding their ages. The former finds a common age of log = 7.1 years for both clusters and the surrounding population, while the latter claims the existence of at least three different episodes of star formation. To contribute to ascertain this issue is one of the objectives of the present paper.
2 Observations and reduction procedure
2.1 Observations and image processing
CCD photometry of the central regions of and Persei was obtained on the nights 20 to 22 November 1998 at the 1.52m. telescope of the Observatorio Astronómico Nacional, located at the Calar Alto Observatory (Almería, Spain). The chip employed was the Tektronics TK 1024 AB, with a size of 1024 x 1024 pixels. The 0 4 unbinned pixels provide a field size of 6 9x6 9, which almost entirely covers the clusters ’nuclei’ area, as defined by Maps 2 and 4 in Oosterhoff (oost (1937)).
Observations were done through the four Strömgren and Crawford narrow and wide H filters, being every field sequentially measured through the six filters. Two different exposure times were used with each filter, in order to ensure a wide range of stellar magnitudes. Exposure times in each filter were selected so as a B type star produces approximately equal count rates through all filters. Employed exposure times are presented in Table 1.
| Filter | short | large |
|---|---|---|
| 10 | 50 | |
| 12 | 60 | |
| 35 | 175 | |
| 120 | 600 | |
| H | 12 | 60 |
| H | 30 | 150 |
In order to ensure the atmospheric extinction and standard transformation determination, three additional fields centered on the open clusters NGC 1039, NGC 6910 and NGC 6913 were also observed at different airmasses. The list of all observations is presented in Table 2.
| NGC | JD | date | airmass | int. time |
|---|---|---|---|---|
| 869 | 51138 | 20-11-98 | 1.06 | short |
| 869 | 51138 | 20-11-98 | 1.07 | long |
| 869 | 51138 | 20-11-98 | 1.83 | short |
| 869 | 51139 | 21-11-98 | 1.07 | short |
| 869 | 51139 | 21-11-98 | 1.07 | long |
| 869 | 51140 | 22-11-98 | 1.07 | short |
| 869 | 51140 | 22-11-98 | 1.63 | short |
| 884 | 51138 | 20-11-98 | 1.10 | short |
| 884 | 51138 | 20-11-98 | 1.12 | long |
| 884 | 51138 | 20-11-98 | 1.98 | short |
| 884 | 51139 | 21-11-98 | 1.11 | short |
| 884 | 51139 | 21-11-98 | 1.13 | long |
| 884 | 51140 | 22-11-98 | 1.06 | short |
| 884 | 51140 | 22-11-98 | 1.70 | short |
| 1039 | 51138 | 20-11-98 | 1.57 | short |
| 1039 | 51140 | 22-11-98 | 1.55 | short |
| 6910 | 51138 | 20-11-98 | 1.11 | short |
| 6910 | 51138 | 20-11-98 | 1.77 | short |
| 6910 | 51138 | 20-11-98 | 1.14 | long |
| 6910 | 51138 | 20-11-98 | 1.83 | long |
| 6910 | 51140 | 22-11-98 | 1.14 | short |
| 6910 | 51140 | 22-11-98 | 1.66 | short |
| 6913 | 51138 | 20-11-98 | 1.25 | short |
| 6913 | 51138 | 20-11-98 | 1.30 | long |
| 6913 | 51140 | 22-11-98 | 1.18 | short |
| 6913 | 51140 | 22-11-98 | 1.81 | short |
Images were processed using IRAF.111IRAF is distributed by the National Optical Astronomy Observatories, which are operated by the Association of Universities for Research in Astronomy, Inc., under cooperative agreement with the National Science Foundation, U.S.A. A sizeable sample of bias and sky flat frames were obtained at the beginning and at the end of every night. The images were subjected to the usual overscan, bias and flat field corrections.
Photometry was performed using the DAOPHOT package (Stetson stetson (1987)). Aperture photometry was obtained for a number of sufficiently clean stars in each frame, through a constant 14 pixel radius which was chosen to contain virtually all the stellar flux in all images, as indicated by a grow curve analysis. PSF-fitting photometry was subsequently obtained for all identified stars in all frames. A constant PSF provided a good representation of the stellar profiles through each frame. The difference between aperture and PSF-based instrumental magnitudes were determined for each frame, and the latter were corrected accordingly.
2.2 Extinction and instrumental system
The atmospheric extinction was determined by the multi-night, multi-star method described by Manfroid (manf93 (1993)). Computations were done by using the RANBO2 package, written by J. Manfroid. The implementation of this reduction procedure allows the construction of a consistent natural system, which contains the extra-atmospheric instrumental magnitudes of all constant stars included in the computation procedure. Stars from all observed fields were included in the building of the natural system.
The value of the extinction coefficient was determined for each individual frame. For the stars in common, the mean difference between the observed and natural magnitudes was obtained, and divided by the airmass to obtain the corresponding extinction coefficient.
| star | N | ||||||||||
| 0869-0837 | 14.090 | - | - | - | - | -0.010 | - | - | - | - | 4 |
| 0869-0843 | 9.317 | 0.286 | -0.065 | 0.172 | 2.593 | 0.003 | -0.009 | 0.015 | -0.006 | -0.026 | 2 |
| 0869-0922 | - | 0.304 | -0.066 | 0.130 | - | - | 0.006 | -0.016 | 0.001 | - | 3 |
| 0869-0963 | - | 0.286 | -0.044 | 0.191 | - | - | -0.003 | -0.010 | -0.003 | - | 5 |
| 0869-0978 | - | 0.301 | -0.033 | 0.167 | 2.627 | - | 0.004 | -0.006 | 0.010 | -0.016 | 4 |
| 0869-0980 | - | 0.284 | -0.042 | 0.178 | - | - | 0.006 | -0.012 | -0.011 | - | 3 |
| 0869-0991 | - | 0.328 | -0.055 | 0.255 | - | - | 0.001 | -0.007 | 0.020 | - | 5 |
| 0869-1004 | - | 0.305 | -0.051 | 0.204 | - | - | 0.013 | -0.010 | 0.010 | - | 5 |
| 0869-1181 | - | 0.350 | -0.049 | 0.374 | 2.730 | - | 0.022 | 0.015 | 0.005 | 0.012 | 5 |
| 0869-1187 | 10.857 | 0.334 | -0.046 | 0.205 | 2.618 | -0.037 | 0.014 | -0.017 | 0.007 | -0.030 | 5 |
| 0884-2167 | 13.401 | 0.346 | -0.057 | 0.604 | 2.762 | -0.041 | 0.006 | 0.001 | 0.023 | 0.010 | 4 |
| 0884-2196 | 11.538 | - | - | - | 2.666 | 0.032 | - | - | - | 0.004 | 5 |
| 0884-2200 | - | - | - | - | 2.721 | - | - | - | - | 0.016 | 5 |
| 0884-2232 | 11.102 | - | - | - | 2.639 | 0.008 | - | - | - | -0.012 | 4 |
| 0884-2235 | 9.361 | 0.330 | -0.095 | 0.134 | 2.608 | -0.001 | -0.014 | 0.007 | 0.016 | 0.003 | 3 |
| 0884-2246 | 9.930 | 0.291 | -0.058 | 0.124 | 2.625 | -0.030 | -0.004 | -0.004 | 0.005 | 0.002 | 4 |
| 0884-2251 | 11.560 | 0.315 | -0.051 | 0.371 | 2.708 | 0.000 | -0.013 | 0.009 | -0.022 | 0.001 | 5 |
| 0884-2296 | 8.499 | 0.323 | -0.104 | 0.136 | - | 0.031 | -0.032 | 0.032 | -0.003 | - | 1 |
| 0884-2311 | 9.363 | 0.299 | -0.074 | 0.146 | 2.601 | 0.017 | -0.017 | 0.010 | 0.014 | -0.020 | 3 |
| 0884-2330 | 11.446 | 0.273 | -0.070 | 0.268 | 2.630 | -0.026 | -0.006 | 0.020 | 0.009 | 0.010 | 5 |
| 1039-0226 | 10.482 | - | - | - | - | -0.002 | - | - | - | - | 2 |
| 1039-0267 | 11.940 | 0.296 | 0.133 | 0.505 | 2.683 | 0.020 | 0.007 | 0.005 | -0.024 | 0.005 | 2 |
| 1039-0274 | 9.745 | 0.092 | 0.159 | 0.994 | 2.876 | -0.005 | -0.006 | 0.017 | -0.021 | -0.014 | 2 |
| 1039-0278 | 11.789 | 0.146 | 0.202 | 0.911 | 2.857 | 0.031 | -0.002 | -0.004 | -0.011 | 0.002 | 2 |
| 1039-0284 | 10.741 | 0.151 | 0.185 | 0.898 | 2.862 | 0.019 | 0.000 | 0.009 | -0.004 | 0.014 | 2 |
| 1039-0294 | 11.185 | 0.186 | 0.195 | 0.782 | - | 0.035 | -0.010 | 0.009 | 0.014 | - | 2 |
| 1039-0301 | 10.041 | 0.040 | 0.185 | 1.014 | 2.887 | -0.011 | 0.026 | -0.033 | -0.001 | -0.029 | 2 |
| 1039-0303 | 9.951 | 0.055 | 0.169 | 1.023 | - | -0.001 | 0.000 | -0.006 | -0.002 | - | 2 |
| 6910-0010 | 10.782 | - | - | - | 2.941 | -0.032 | - | - | - | 0.032 | 5 |
| 6910-0021 | 11.763 | 0.582 | -0.099 | 0.234 | 2.678 | -0.033 | 0.008 | -0.001 | -0.014 | 0.026 | 5 |
| 6910-0024 | 11.710 | - | - | - | 2.637 | 0.010 | - | - | - | -0.010 | 5 |
| 6910-0028 | 12.243 | - | - | - | - | -0.023 | - | - | - | - | 5 |
| 6910-0041 | 12.803 | 0.759 | -0.166 | 0.319 | 2.674 | 0.007 | -0.009 | 0.026 | -0.029 | 0.006 | 5 |
| 6913-0001 | 8.842 | 0.726 | -0.159 | 0.166 | 2.596 | 0.018 | 0.004 | -0.011 | 0.004 | 0.007 | 3 |
| 6913-0002 | 8.912 | 0.644 | -0.148 | 0.112 | 2.625 | -0.002 | -0.014 | 0.008 | 0.008 | 0.029 | 3 |
| 6913-0003 | 8.942 | 0.699 | -0.186 | 0.165 | 2.639 | 0.038 | -0.019 | 0.026 | -0.035 | 0.045 | 3 |
| 6913-0004 | 10.199 | 0.621 | -0.115 | 0.157 | 2.632 | -0.019 | -0.001 | -0.005 | 0.013 | 0.015 | 4 |
| 6913-0008 | 12.190 | 0.546 | -0.062 | 0.365 | 2.618 | -0.020 | 0.024 | -0.028 | -0.025 | -0.044 | 4 |
| 6913-0009 | 11.747 | 0.587 | -0.069 | 0.297 | - | 0.033 | 0.033 | -0.041 | 0.013 | - | 4 |
| 6913-0010 | - | - | - | - | 2.678 | - | - | - | - | 0.015 | 2 |
| 6913-0026 | 13.230 | 0.694 | -0.102 | 0.778 | - | -0.010 | -0.014 | 0.002 | 0.042 | - | 4 |
| Mean: | 0.000 | 0.000 | 0.000 | 0.000 | 0.001 | ||||||
| RMS: | 0.023 | 0.014 | 0.017 | 0.017 | 0.021 |
2.3 transformation
The choice of an adequate set of standard stars for CCD photometry is a very critical issue. By one hand, the primary standard stars of the and H systems (Crawford & Mander craw66 (1966); Crawford & Barnes craw70a (1970); Perry et al. perry87 (1987)) are all bright enough to saturate the CCD chip, even with short exposures. By the other hand, most of the observed stars are reddened B type stars. Manfroid & Sterken (manf87 (1987)), Delgado & Alfaro (delgado (1989)) and Crawford (craw94 (1994)) have shown that transformations made only with unreddened stars introduce large systematic errors when applied to reddened stars, even if the colour range of the standards brackets that of the programme stars. No such reddened early type stars are included in the primary standard lists.
Our standard list was composed by stars in young open clusters with photometry published by Crawford et al. (craw70b (1970)) for & Persei, Canterna et al. (canterna (1979)) for NGC 1039 and Crawford et al. (craw77 (1977)) for NGC 6910 and NGC 6913. All these photometric lists were obtained with the same telescopes, instrumentation and reduction procedures used to define the standard Crawford & Barnes (craw66 (1966)) and Crawford & Mander (craw70a (1970)) systems, and so the photometric values are in the standard system. As the values for and Persei are not included in the corresponding photometric list, we have used the values given by Johnson & Morgan (johnson (1955)). The final standard star list is presented in Table 3. For cluster stars we have adopted the numbering system in the WEBDA database222http://obswww.unige.ch/webda/ (Mermilliod merm (1999)). Note that these numbers may not correspond with the numbering in the referred to photometric papers.
Individual stars in each list were selected so as to insure as large as possible a range in all photometric indices. However, as the main purpose of this paper is to study the clusters upper main sequence, and in particular the B type spectral range, no late type stars were included in the standard star list. A few intrinsically red field stars have been observed, and their values have been included in the photometry tables for completeness, but it should be noted that photometry for stars redder than is likely to be affected by systematic errors. This is also the case for the index of emission-line stars, which reach a very low value. As no emission line star was included in the standard list due to their well know variability, there is no way to avoid extrapolation.
Transformations were computed from the natural system to the standard system defined by the standard star list described above. The obtained transformation equations are the following:
were subscript ’n’ refers to the natural system. All scale coefficients in the transformation are close to unit, while the colour terms are small, indicating a good conformity between the instrumental and standard photometric systems. This is not the case for the H transformation, where the scale coefficient is larger. This may be due to the wide filter used being significantly narrower than the standard one defined by Crawford & Mander (craw66 (1966)).
A measure of the photometric accuracy is the standard deviation of the mean catalogue minus transformed values for the standard stars. These values are presented in Table 3, bottom line.
2.4 Coordinates
Although precise astrometry is not among the scopes of this paper, we have transformed the instrumental pixel coordinates into equatorial coordinates, in order to facilitate the identification of all observed stars, and their cross-correlation with other photometric lists.
Astronomical coordinates in the field of Per where derived from 13 stars with positions in the PPM Catalogue (Roeser & Bastian roeser (1988)). In the field of Per there are only 7 stars with positions in the PPM Catalogue, which are grouped in the eastern part. We complemented this list with four more stars with positions given by Abad & García (abad (1995)). Transformation equations were computed by means of the Starlink program ASTROM (Wallace wallace (1998)). The final astrometric accuracy, measured as the RMS of the mean catalogue minus transformed values for the stars used in the transformation, is within 04.
2.5 The data
Equatorial coordinates and mean photometric magnitudes, colours and indices for stars in the and Persei nuclei are presented in Tables 6 and 7. Only frames obtained at airmasses lower than 1.5 have been considered to compute the final photometric values. For this reason, small differences up to a few millimagnitudes may appear between values in Table 3 and Tables 6 and 7 for the stars in common.
In the photometric tables we have also adopted the cluster star numbering system from the WEBDA database. For cluster numbers lower than 3000, WEBDA numbers are coincident with Oosterhoff (oost (1937)) numbers, which we will refer to as ’Oo’ hereinafter. A few observed stars have not entry in WEBDA. We have introduced new numbering for them, starting with 7000 in Per and with 8000 in Per.


3 Reddening, intrinsic colours and distance.
Colour-magnitude diagrams of all observed stars in both cluster regions are presented in Fig. 1, and photometric diagrams in Fig. 2. To obtain the intrinsic colours we have first classified the stars as belonging to the early (earlier than A0), intermediate (A0-A3) and late (A3 onwards) groups defined by Strömgren (strom (1966)). The classification was performed by means of the algorithm described by Figueras et al. (figueras (1991)). Cluster membership were assigned from the position of each star in the different photometric diagrams. Stars considered as members were marked in the last column of Tables 6 and 7.
Reddening values and intrinsic colours and indices were obtained for stars in the early group by means of the procedure described by Crawford (craw78 (1978)). We have used the standard relation given in Table X of Perry et al. (perry87 (1987)), and the following reddening relations:
Known Be stars have not been included in the computation of the interstellar reddening, as they present an additional reddening contribution of circumstellar origin.
For Per we obtained a mean reddening value of , from 127 stars. The large value of the standard deviation indicates the presence of variable reddening across the cluster nucleus. In Fig. 3 we have represented the reddening values for individual stars as a function of their position. It is apparent a trend of increasing reddening from west to east, and a heavily obscured region in the south-eastern part of the cluster center. In Fig. 3 we have divided the cluster nucleus area in three regions of different reddening. Mean reddening values in these regions are presented in Table 4.
The large absorption in the south-east part has been previously pointed out by Waelkens et al. (waelkens (1990)) from photoelectric photometry in the Geneva system, but surprisingly has not been accounted for in recent CCD studies. On the other hand, the low reddening value in the western part was already noted by Fabregat et al. (fabregat96 (1996)). They considered the Be stars Oo 146, 245 and 566 as probable nonmembers, due to their reddening values ( 0.313, 0.346 and 0.308 respectively), which are much lower than the cluster average reddening. From the present result we can conclude that the low reddening values are consistent with the position of these stars in the low absorption region at the western part of the cluster.
The mean value of the reddening for Per is , from 82 stars. In Fig. 4 we have also represented the individual reddening values as a function of the stars position. In this case no trend is present. The standard deviation of the mean reddening value is only slightly larger than the deviation of the reddening computation method (namely 0.018, cf. Perry & Johnston perry82 (1982); Franco franco (1989)), and we conclude that the interstellar absorption is constant towards the Per nucleus, within the accuracy of our photometry.
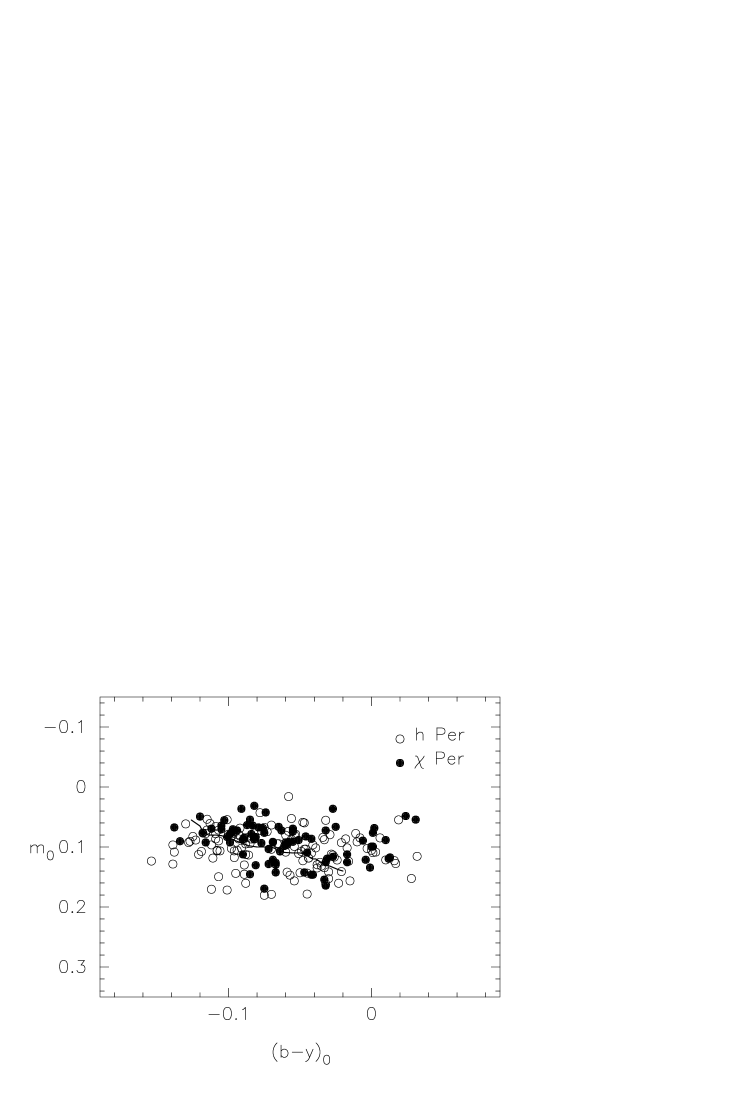
The different reddening characteristics towards both cluster nuclei are apparent in the photometric diagrams presented in Figs. 1 and 2. In the plane, the Per sequence is much broader than the Per one, due to the strongly variable reddening in the former. Assuming that both clusters are at the same distance (see below), the higher mean reddening in Per causes that its observed sequence ends at earlier spectral types. This is apparent in Fig. 1, but much more remarkable in the plane in Fig. 2: in Per the lower branch of the cluster sequence is almost complete until (spectral type around F5), while in Per it ends at (around A7).


| Region | stars | |
|---|---|---|
| A | 12 | |
| B | 81 | |
| C | 34 |
In Fig. 5 we present the intrinsic diagram for B stars in both cluster nuclei. Per stars have been dereddened by using the mean cluster value of . For Per, each star has been dereddened on the basis of its position within Fig. 3, and using the reddening values in Table 4. The loci of both sequences are undistingishable, indicating that both clusters are at the same distance, and have also the same age, as we will discuss in the next section. The sequence of Per is somewhat broader, most likely due to the variable reddening.
To obtain the distance we have fitted to the diagram of each cluster the ZAMS as presented in Table X of Perry et al. (perry87 (1987)). Results are shown in Fig. 6. We found the best fit at a distance modulus of 11.7 mag. To estimate the error of this determination we have also represented in Fig. 6, as dotted lines, the ZAMS shifted by distance moduli of 11.5 and 11.9 respectively. We find that the 11.7 value produces a distinctly better fit that the two latter ones, and hence we give the value of mag. as the distance modulus of and Persei. This value is in good agreement with the recent determinations based on CCD photometry by Keller et al. (keller (2001)) and Marco & Bernabeu (marco (2001)).

Finally, an indication of the validity of the dereddening procedure and the conformity between our photometry and the standard system can be obtained by comparing the resulting and indices with those of nearby, unreddened stars as given by Perry et al. (perry87 (1987)). The results are shown in Figs. 7 and 8. As it can be seen, the obtained indices are coincident with the mean intrinsic relations, and hence we can conclude that our photometry is in the standard system, and free of systematic effects. This is in turn a proof of the validity of our reduction methods and the adequacy of the standard star selection.

4 Cluster ages
Determination of the cluster ages will be done by isochrone fitting to the upper main sequence. In the system and for stars in the early group, the colour and the index are temperature indicators, and hence both and planes are observational HR diagrams. Following the discussion in Fabregat & Torrejón (fabregat00 (2000)) we consider more precise and reliable the isochrone fitting to the diagram, for the following reasons: i./ the range of variation of the index along the B-type sequence is more than ten times larger than the range of variation of , providing much better discrimination between isochrones of similar ages; ii./ the index is less affected, by a factor of 5, by interstellar reddening; iii./ the plane allows an efficient segregation of emission line stars.

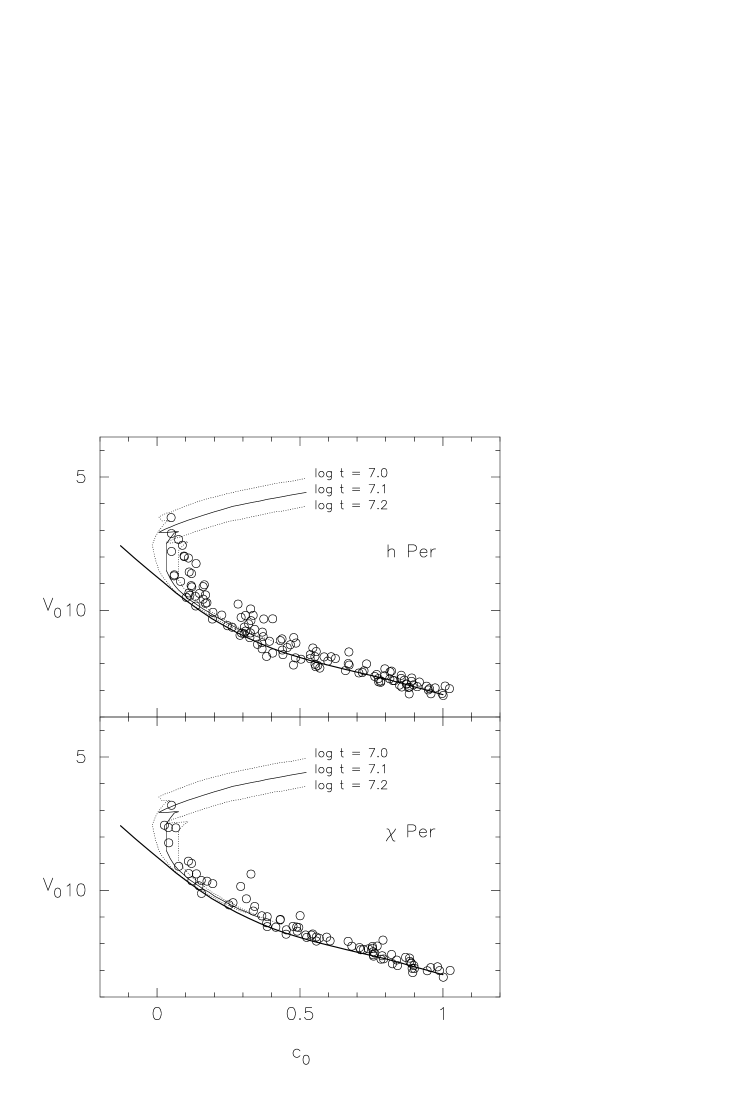
In Fig. 9 we present the sequences of and Per, together with isochrones with ages of 7.0, 7.1 and 7.2 years. The isochrones have been computed with the evolutionary models of Schaller at al. (schaller (1992)), and transformed to the observational plane by means of the relations obtained by Torrejón (torrejon (1997)). The best fitting in both clusters is obtained for 7.1, with most of the stars at the turnoff point lying between the 7.0 and 7.2 isochrones. Hence we propose as the common age of both clusters, in good agreement with the recent result of Keller et al. (keller (2001)).
5 Discussion
In a recent paper Marco & Bernabeu (marco (2001), hereinafter referred to as MB01) claimed that Per is significantly older than Per, and go further to propose three epochs of star formation within the double cluster at ages of log = 7.0, 7.15 and 7.3 years. This is in clear disagreement with our results in the previous section. Their study is also based on CCD photometry, and they use the same methods and techniques that we do in the present paper. Hence, it is worth to compare both studies in order to ascertain the reasons of the diverging results. When comparing both sets of data, it should be noted that: i./ our standard photometry is at least twice as accurate as the MB01 one (cf. Table 9 in MB01 and Table 3 in this paper), and ii./our CCD frames cover a larger area than MB01 ones, and hence our photometric sequences are more populated.
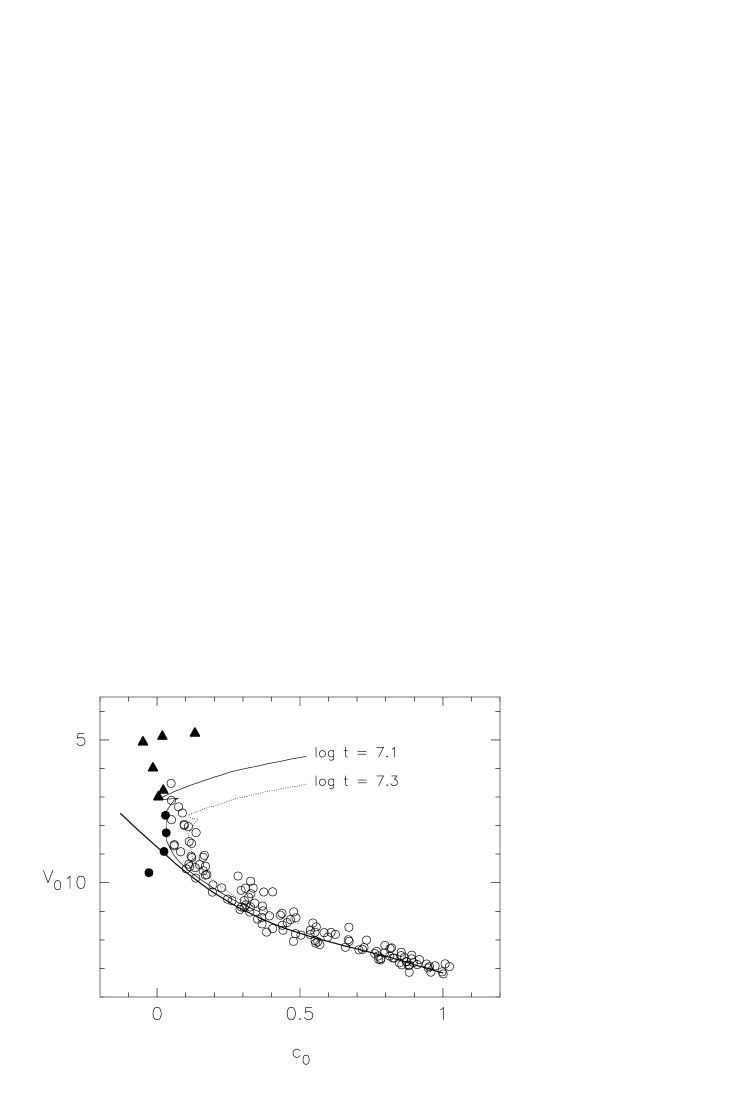
MB01 find an age of log = 7.10 – 7.15 years for Per, in agreement with our value of log = 7.10 obtained in the previous section. For Per they obtain a significantly older age. In their Fig. 10 they show the log = 7.3 isochrone fitting a clump of stars at about , which they consider as the main sequence turnoff. This clump is also present in our data, as can be seen in Fig. 10 where we present the plane and the the log = 7.1 and 7.3 isochrones. However, the distribution of stars in our Fig. 10 near the turnoff point is different. The clump at is less conspicuous, it is only formed for at most six stars, and significantly leftwards to the fitting log = 7.3 isochrone there are at least eight main sequence cluster stars, which should have a younger age. We consider the latter as defining the actual cluster main sequence turnoff, which is well fitted by the log = 7.1 isochrone.
The possibility of two distinct populations with log = 7.1 and 7.3 years seems very unlikely. The occurrence of stars slightly above the main sequence can be justified by several reasons, including binarity, high rotational velocity, or photometric errors. Other small clump above the main sequence is apparent at , and it is also most likely caused by the above referred to reasons.
MB01 also propose the presence of a population younger than log = 7.0 in the Per region. This claim is based on the position in the plane of six supergiant B stars observed by Crawford et al. (craw70b (1970)). In Fig. 10 we have also represented these stars (filled triangles), which clearly fall at the left of the log = 7.1 isochrone.
But this argument is wrong. The index of the system is defined to be a measure of the Balmer discontinuity depth, which for OB stars is related to the effective temperature. For this reason, the photometric plane can be considered as an observational Hertzsprung-Russell diagram. However, this is only true for stars of luminosity classes III to V, and not for supergiants. Crawford et al. (craw70b (1970)) already note that Ia type supergiants do not follow the mean calibration. Schild & Chaffee (schild75 (1975)) show that the Balmer continuum of early type supergiants is affected by an emission or absorption contribution of circumstellar origin, and hence the Balmer discontinuity depth is not correlated with spectral types or effective temperature. Kilkenny & Whittet (kilkenny (1985)) present intrinsic relations for early type supergiants. There is a different relation for each luminosity class (Ia, Iab, Ib and II), and all of them are in turn different to the mean relation for III-V classes. If we assume that is a good temperature indicator for all luminosity classes (see below), this implies that the index cannot define a unique temperature scale valid for all luminosities.
The case is much the same as for classical Be stars. Be stars also have continuum emission or absorption of circumstellar origin at the Balmer discontinuity, and hence their indices are anomalous (Fabregat et al. fabregat96 (1996), and references therein). For comparison, in Fig. 10 we have represented the four Be stars in the cluster nucleus (filled circles). They also occupy anomalous positions at the left of the isochrones, and even below the ZAMS. Neither supergiants nor Be stars should be used in a diagram when it is intended to be an observational HR diagram for isochrone fitting purposes, due that their index is not related with effective temperature.

In order to study the age of the supergiant star population in the Per area, in Fig. 11 we have represented the photometric diagram. is a measure of the Paschen continuum slope, which is correlated with effective temperature for stars of all luminosity classes. Be stars, however, also deviates due to additional reddening of circumstellar origin (eg. Fabregat et al. fabregat96 (1996)). Two supergiant stars, Oo 1057 and 1162, lie in the cluster nucleus, and have been dereddened as a function of their position in Fig. 3. The other four, Oo 3, 16, 612 and 662, are placed at the west of the cluster nucleus. Following the discussion in Sect. 3, we have used the value of in Table 4 to obtain their intrinsic colours. In order to check the reliability of this value, we have calculated the individual reddening for all supergiant stars using the standard relations given by Kilkenny & Whittet (kilkenny (1985)). Results are presented in Table 5. All reddening values for the western stars are compatible with the mean reddening for the west region given in Table 4.
| Oo | |
|---|---|
| 3 | 0.306 |
| 16 | 0.340 |
| 612 | 0.350 |
| 662 | 0.357 |
| 1057 | 0.411 |
| 1162 | 0.473 |
In Fig. 11 it is apparent that most of the supergiant stars lie close to the log = 7.1 isochrone, giving further support to this value as the actual age of Per. There are no stars significantly leftwards to this isochrone, indicating that no younger population is present in the cluster area.
MB01 also presented the plane for Per (their Fig. 9). In their figure most supergiant stars are placed leftwards to the log = 7.0 isochrone, and even leftwards to the ZAMS, indicating that these stars could be no members of the cluster. This is due to a reddening overcorrection. They used their mean cluster value, , to calculate the intrinsic colours. The deviating supergiants are placed at the west of the cluster nucleus, where we have demonstrated that the reddening is lower by more than a tenth of magnitude. With the proper reddening values supergiants are placed close to the cluster isochrone.
We can conclude that there are no different epochs of star formation within the and Persei clusters area, and that both clusters and the surrounding field stars share the same age of years, as determined in the previous sections. We propose that the wrong results obtained by MB01 are due to a number of factors, including the low accuracy of their photometry, the neglecting of the strongly variable reddening across the Per cluster, the incorrect use of supergiant stars in the plane for isochrone analysis, and to a large extent the overinterpretation of the data at their disposal.
As discussed in Sect. 4, and in more detail in Fabregat & Torrejón (fabregat00 (2000)), the isochrone fitting in the plane is an excellent tool for accurate age determination in young open clusters. With accurate photometry, the main sequence turnoff is very well defined, allowing a precise discrimination between isochrones of slightly different ages. But its applicability is limited to the range of spectral types and luminosity classes for which the index is a good temperature indicator. This is restricted to OB stars of luminosity classes III to V, and beyond this limits its use can conduct to misleading results.
6 Conclusions
We have presented CCD photometry for stars in the nuclei of the young open clusters and Per. We have shown that our photometry is free of systematic effects and well tied to the standard system.
We have obtained the cluster astrophysical parameters from the analysis of the B type star range. The reddening is highly variable through the Per nucleus, increasing from west to east. Its value ranges from in the western part to in the south-east. Towards Per the reddening is fairly constant, with . Both clusters share a common distance modulus of 11.70.1 mag., and an age of years.
Acknowledgements.
We would like to thank Dr. J. Manfroid for providing us with his RANBO2 code to compute atmospheric extinction and photometric natural system. We are grateful to the Observatorio Astronómico National for the allocation of observing time in the 1.5m. telescope, and for support during observations. This research has made use of the WEBDA database, developed and maintained by J.C. Mermilliod, the SIMBAD database, operated at CDS, Strasbourg, France, and the NASA’s Astrophysics Data System Abstract Service. The authors acknowledge the data analysis facilities provided by the IRAF data reduction and analysis system, and by the Starlink Project which is run by CCLRC on behalf of PPARC. This work has been partially supported by the Plan Nacional de Investigación Científica, Desarrollo e Innovación Tecnológica del Ministerio de Ciencia y Tecnología and FEDER, through contract AYA2000-1581-C02-01. JF acknowledges grants from the Conselleria de Cultura i Educació de la Generalitat Valenciana and the Secretaría de Estado de Educación y Universidades of the Spanish Governement.References
- (1) Abad, C., García, L. 1995, Rev. Mex. Astron. Astrophys. 31, 15
- (2) Canterna, R., Perry, C.L., Crawford, D.L. 1979, PASP 91, 263
- (3) Crawford, D.L. 1978, AJ 83,48
- (4) Crawford, D.L. 1994, PASP 106, 397
- (5) Crawford, D.L., Mander, J. 1966, AJ 71, 144
- (6) Crawford, D.L., Barnes, J.V. 1970, AJ 75, 978
- (7) Crawford, D.L, Glaspey, J.W., Perry, C.L. 1970, AJ 75, 822
- (8) Crawford, D.L., Barnes, J.V., Hill G. 1977, AJ 82, 606
- (9) Delgado, A.J., Alfaro, E.J. 1989, A&A 219, 121
- (10) Fabregat, J., Torrejón, J.M., 2000, A&A 357, 451
- (11) Fabregat, J., Torrejón, J.M., Reig, P. et al. 1996, A&AS 119, 271
- (12) Figueras, J., Torra, J., Jordi, C. 1991, A&AS 87, 319
- (13) Franco, G.A.P. 1989, A&AS 78, 105
- (14) Johnson, H.L., Morgan, W.W. 1955, ApJ 122, 429
- (15) Keller, S.C., Grebel, E.K., Miller, G.J., Yoss, K.M. 2001, AJ 122, 248
- (16) Kilkenny, D., Whittet, D.C.B. 1985, MNRAS 216, 127
- (17) Manfroid, J. 1993, A&A 271, 714
- (18) Manfroid, J., Sterken, C. 1987, A&AS 71, 539
- (19) Marco, A., Bernabeu, G. 2001, A&A 372, 477
- (20) Mermilliod, J.C. 1999, in Very Low-Mass Stars and Brown Dwarfs in Stellar Clusters and Associations, Cambridge Univ. Press, eds. Rebolo, R. and Zapatero-Osorio, R.M.
- (21) Oosterhoff, P.T. 1937, Ann. Sterrewatch Leiden 17, 1
- (22) Perry, C.L., Johnston, L. 1982, ApJS 50, 451
- (23) Perry, C.L., Olsen, E.H., Crawford, D.L. 1987, PASP 99, 1184
- (24) Roeser, S., Bastian, U. 1988, A&AS 74, 449
- (25) Schaller, G., Schaerer, D., Meynet, G., Maeder, A. 1992, A&A 96, 269
- (26) Schild, R.E., Chaffee, F.H. 1975, ApJ 196, 503
- (27) Stetson, P.R. 1987, PASP 99, 191
- (28) Strömgrem, B., 1966, ARA&A 4, 433
- (29) Torrejón, J.M. 1997, PhD Thesis, University of Valencia
- (30) Waelkens, C., Lampens, P., Heynderickx, D. et al. 1990, A&AS 83, 11
- (31) Wallace, P.T. 1998, Starlink User Note 5.17, Rutherford Appleton Laboratory