The BeppoSAX spectrum of the composite galaxy Mrk609
Abstract
We present BeppoSAX observations of the starburst/Seyfert composite galaxy Mrk609. This enigmatic object has an optical spectrum dominated by the features of starburst galaxies, yet its X-ray luminosity (6.3) is typical of an AGN. The X-ray spectrum of Mrk609 can be parameterised by a single power-law model with a photon index and no evidence for significant absorption above the Galactic value. Long term variability in both the 0.1-2 keV and 2-10 keV energy bands is detected, again suggesting that the X-ray emission is dominated by an AGN. The observed broad Ha component is a factor of 40 below that predicted by the X-ray flux implying a deficit of ionizing UV photons.
keywords:
galaxies: AGN – galaxies: starburst - X-rays:galaxies1 INTRODUCTION
Moran, Halpern Helfand (1996), after careful spectroscopy of a sample based on the cross-correlation of the IRAS PSC and ROSAT All Sky Survey, reported the discovery of an “anomalous” class of objects. The optical spectra of these sources are dominated by the features of starburst galaxies, based on the emission line diagnostic diagrams (Veilleux Osterbrock 1987), yet their X-ray luminosities are typical of Seyfert 2 galaxies. Close examination of their optical spectra reveals some weak Seyfert-like features: [OIII] significantly broader than all other narrow lines in the spectrum and in some cases a weak broad Hα component. The authors designated these objects “starburst/Seyfert composite” galaxies and presented them as a new class of X-ray luminous source. Similar ”composite” objects have also been noticed by Veron et al. (1997). Indeed, they presented observations of 15 objects with transition spectra ie showing the simultaneous presence of a strong star-forming component and an active nucleus and they showed that fall either on the starburst region or on the borderlines between the different classes. Hereafter, we will refer to these objects as composite galaxies and we will distinguish them from the Sy2/Starburst galaxies that show emission from both components at all wavelengths.
The composite galaxies bear close resemblance to the narrow-line X-ray galaxies (NLXGs) detected in large numbers in deep ROSAT surveys (eg Boyle et al. 1995, Griffiths et al. 1996). These NLXGs again have spectra composite of Seyfert and starburst galaxies (Boyle et al. 1995) with luminosities L. Unfortunately the faint fluxes of these NLXGs do not allow their detailed study in either optical or X-ray wavelengths. Although it is unclear whether these nearby “composites” are the same class of objects as those found in ROSAT deep field NLXGs, their high luminosities need to be explained. It is unclear how their intense X-ray emission can be reconciled with weak or absent Seyfert characteristics.
1.1 Composite galaxies in X-rays
Only a few composite galaxies have been studied so far in X-rays. Specifically, IRAS00317-2142 (Georgantopoulos 2000) has been observed with ASCA and is the most luminous object (Lin the 0.1-2 keV band) in the Moran et al. (1996) sample. The spectrum is represented by a power-law with and there is no evidence for absorption above the Galactic value. Strong variability in the 1-2 keV band (by a factor of three) is detected between the ROSAT and ASCA observations. These characteristics indicate an AGN origin for the X-ray emission. However no iron line is detected and the 90 per cent upper limit on the equivalent width is 0.9 keV. The ratio 2.5 rule out the Compton thick interpretation for IRAS00317-2142. However, the precise nature of this object and the relative contribution of the starburst and AGN components could not be determined.
A further composite object studied in X-rays with ROSAT and ASCA is AXJ1749+684 (Iwasawa et al. 1997). AXJ1749+684 was serendipitously detected with the ASCA GIS. Its X-ray spectrum is flat (). The flatness is attributed by the authors to absorption mainly because of the: (a) large Balmer decrement in the narrow line region, =7.32 and (b) lack of significant X-ray detection at 0.4 keV. On the other hand, the optical counterpart of AXJ1749+684 is detected in the Kiso Schmidt Survey of UV-excess galaxies. Iwasawa et al. (1997) claimed that the UV emission is due to large-scale starburst activity, however in this case strong far infrared emission should be expected, which is inconsistent with the non-detection of this source by IRAS. They concluded that the X-ray spectrum of AXJ1749+684 is well fitted by an obscured (N cm-2) Seyfert nucleus embedded within a star-forming galaxy.
Recently Levenson et al. 2001, examined NGC6221 as a further example of a composite galaxy. They proposed that the X-ray spectrum of this object is characterised by a Seyfert 1 like spectrum. They detect an iron line and continuum variability on short- and long-term timescales. The source has a column density of NH=1022 . They proposed that the central region is obscured by a surrounding starburst. Thus the optical spectrum has the characteristics of the starburst component alone.
1.2 Mrk609
Mrk609 is at a redshift of 0.034. The optical position of the object is 03 25 25.3, -06 08 39 (J2000) and the Galactic absorption is =4.41 cm-2. The Hβ profile is 110 km sec-1 wide, while the [OIII] lines are 4 times wider. In addition, the broad blueshifted wings seen on the [OIII] lines are completely missing in Hβ (Heckman et al. 1981). The UV spectrum show strong contribution from hot stars (Rudy et al. 1988) indicating the presence of an intense starburst component in Mrk609.
The broad value is 7.8 (Osterbrock 1981). In a later observation, Rudy et al. (1988) obtained a value for the broad =5. The discrepancy was attributed to continuum variability. The high broad value was attributed by Osterbrock 1981 to reddening of the broad line region. However the broad value is 16, which is large for Seyfert 1 galaxies, ruling out obscuration (see Rudy et al. 1988 for a detailed discussion).
2 Observations and Data Reduction
Mrk609 was observed by BeppoSAX three times. The first observation was carried out on 20/01/2000 for 18 ksec (LECS exposure 7.13 ksec), the second one on 14/02/2000 for 2.5 ksec (LECS exposure 1.4 ksec ) and the third one on 4/03/2000 for 28 ksec (LECS exposure 6668 ksec). It should be reminded here, that the exposure time for the LECS is lower than the MECS because it is limited by stronger operational constraints to avoid UV light contamination, thus it is operated during Earth dark time only. Spectra and light curves of Mrk609 have been extracted from circular regions centered on the source. We used a circular extraction cell of 4 and 6 arcminutes in radius for MECS and LECS data respectively. The background spectra were extracted from blank deep field exposures, using the same region of the detector in each case.
In order to check whether there is any flux or spectral variability in the soft band, an unpublished ROSAT PSPC observation of Mrk609 was analysed. Mrk609 was observed by ROSAT on the 29th of January 1997 for 5801 seconds. A source spectrum has been extracted from a circular region of 1.5 arcmin radius around the centroid of the source, while the background spectrum was extracted from an annulus of internal and external radii of 3 and 9 arcmin respectively.
3 Variability
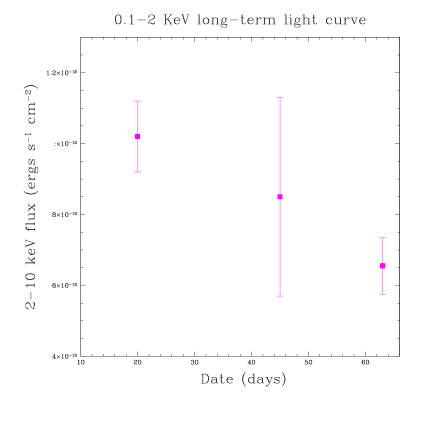
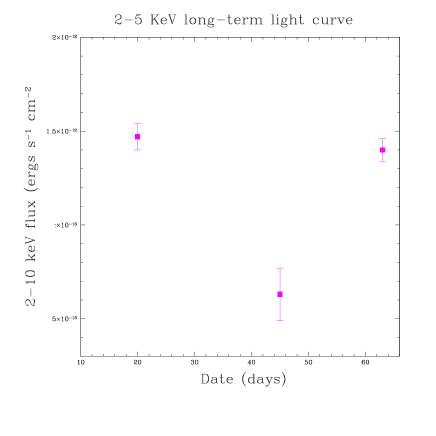
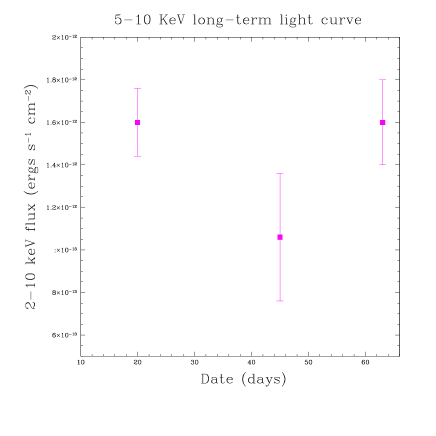
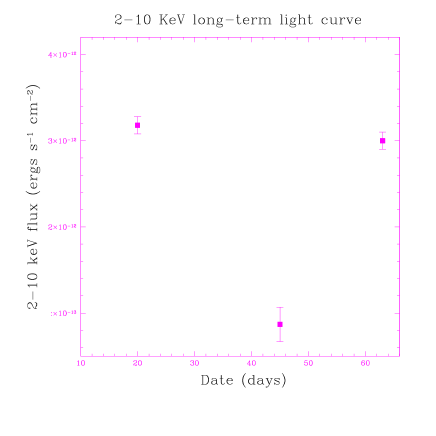
In order to investigate the nature of the X-ray source, we constructed the long term light curves of Mrk609. Then the variability was tested by means of a test against the hypothesis that the flux was constant. The values are quoted in Table 1 for four light curves: LECS 0.1-2 keV, MECS 2-10 keV, MECS 2-5 keV, MECS 5-10 keV. The MECS data were split in three different bands in order to check whether there are different components contributing to the variability of the source. Fig. 1 shows the light curves in the four energy bands. The points are in chronological order; The errors are based on counting statistics only.
It is evident that Mrk609 is variable in both soft and hard energies. In the LECS the flux is decreasing and the difference in flux between the first and third observations is about a factor of 2. Significant variability at the 99.9 per cent confidence level is detected in the 2-10 keV and 2-5 keV energy bands, whereas the variability in the 5-10 keV band is significant only at the 57 per cent confidence level. In the three hard bands the variability follows the same trend; the first and third observations have comparable fluxes, whereas during the second observation the flux drops by up to a factor of 3. This suggests that the whole hard X-ray emission is produced by the same mechanism and in the same region. However, the variability in the soft band follows a different trend from the hard band, suggesting that emission in the two bands is produced by different mechanisms and or in different regions.
We also checked for short time variability. Mrk609 does not show evidence for short time variability at a significant level. This is probably due to the low statistics.
| Energy | (dof) | null hypothesis |
|---|---|---|
| band | probability | |
| 0.1-2 keV | 8.16(2) | 1.7 |
| 2-5 keV | 30.08(2) | 2.9 |
| 5-10 keV | 2.76(2) | 0.43 |
| 2-10 keV | 45(2) | 1.4 |
| (a) | (b) |
|
|
| (c) | (d) |
|
|
4 SPECTRAL ANALYSIS
The spectral fitting was performed in the 0.12-10 keV band. The appropriate redistributions matrix file and the ancillary response file for the observation date were obtained from the BeppoSAX Science Data Center archive. A summary of the spectral fitting results is given in Table 2. In the following analysis all three BeppoSAX observations are fitted together.
Throughout this paper values of Ho=75 km s-1 Mpc-1 and qo=0.5 are assumed.
4.1 The AGN models
We first fit the data with a single power-law model (PL). We obtain an acceptable fit (=98.89 for 82 dof) with , and N 1.32 1021. This model together with the data points and the data to model ratio are plotted in Figure 2. The observed flux in the 2-10 keV band for this model is 2.86 , which corresponds to a luminosity of 6.3 in the same band. If the slope of the power-law model is fixed at the 1.9 value, the nominal value for the Seyfert 1 galaxies ( Nandra Pounds 1994), the model yields an unacceptable fit (=119.26 for 83 dof) with cm-2.
Although Seyfert galaxies show strong narrow iron Kα emission lines, no such line is detected in Mrk609. However an upper limit of eV is obtained, consistent with values seen in Seyfert galaxies.

In the context of the unified models we expect to see some faction of the primary emission through the torus, with a component superimposed upon this that represents a fraction of emission scattered back into our line of sight by material lying above the torus. This model is representing by two power-laws with the same photon index but different normalisations and absorptions - the scattering model. When this model is applied to the data, the normalisations of the two power-laws are comparable, whereas no excess absorption above the Galactic is required and thus this model effectively is the same as the single power-law model. Therefore it is evident that the scattering model does not provide a good representation of the data.
Finally, an ionised warm absorber model in addition to the Galactic column density was fitted to the data (PL+warm). The temperature of the absorber is fixed at T=105 K (Brandt et al. 1999). The model provides an acceptable fit (=98.84 for 81 dof) but does not represent a statistically significant improvement to the single power-law model. The best fit parameters are and warm column density cm-2, while the ionisation parameter is practically unconstrained, possibly because of the poor statistics of the data.
| Model | kTRS | ( dof) | ||||
|---|---|---|---|---|---|---|
| single PL | 1.32 | - | - | - | 98.89(82) | |
| 1.9f | 119.26(83) | |||||
| PL+warm | g | 369.11 | - | 97 .90(81) | ||
| PL+RS | g | - | - | 0.8f | 99.00(81) | |
| RS | - | g | - | - | 18.92 | 108.94(83) |
| 2RS | - | g | - | - | 105.57(80) | |
| 21.81 |
NOTE: g indicates that the is set to the Galactic value.
a column density in units of .
b column density in the warm medium in units of 1021.
4.2 The composite model
Given the composite classification of this object, it is natural to investigate a model in which X-ray emission originates from both a starburst and an AGN. A power-law plus a Raymond-Smith model (PL+RS) with the temperature fixed at 0.8 keV is adopted. The power-law component is allowed to have additional absorption over and above that of the thermal component. This model yields an acceptable fit (=99.81 for 81 dof) with , whereas no excess absorption above the Galactic is required. When the temperature of the thermal component is a free parameter, we find kT 18 keV and (=95.00 for 80 dof). However, the temperature of the thermal component is far too high for a starburst and thus this model cannot provide a physical description of the data.
4.3 The pure starburst model
For completeness we have also investigated pure starburst models. Firstly a single Raymond-Smith model (RS) was fitted to the data. An acceptable fit was obtained (=108.94 for 83 dof) with kT1=18.92 keV. No starbursts with such a high temperature have been found as yet.
Then a two Raymond-Smith model representing thermal emission from a pure starburst galaxy following Zezas et al. (1998) was utilised. The soft emission is parameterised by a thermal component with kT 1 keV and the emission in the hard band by kT2=21.8 keV, again too high for a starburst. Therefore it is obvious that this model cannot provide a physical description of the data.
From the above it is evident that the pure starburst model is ruled out, whereas the composite model does not provide a physically accepted model.
5 Spectral variability
Mrk609 was observed three times with BeppoSAX , allowing us to examine whether there is spectral variability. In particular it is interesting to see whether the drop in the flux during the second observation is related to a change in the spectrum of Mrk609 and examine whether the X-ray behaviour is similar to that of black hole candidates (BHC) in our galaxy during their high and low states. For this analysis only the single power-law is applied to the MECS data.
In addition any spectral variability at soft energies will be examined by comparing the ROSAT PSPC and LECS data. For that reason we analysed an unpublished observation of Mrk609 with ROSAT as explained in section 2.
5.1 Observation 1
The power-law model yields a fit (=55.75 for 38 dof) with and Galactic absorption. The observed flux in the 2-10 keV band for this model is 2.85 , which corresponds to a luminosity of 6.32 in the same band. We do not detect an iron line at 6.4 keV but we obtain an upper limit of 540 eV.
5.2 Observation 2
During the second observation Mrk609 was observed for 2.5 ksec only, and no reliable spectrum could be extracted. However clues for the spectral shape of the spectrum of Mrk609 during this short observation come from the hardness ratio (HR) of the source. Here the HR is defined as h-s/h+s, where h and s are the total number of counts, in the 2-10 keV and 1-2 keV respectively. Only MECS data were used since Mrk609 is not detected in the LECS. The HR is 0.310.18, which corresponds to a power-law of assuming Galactic absorption. Unfortunately the uncertainty in the value of is too high for any firm conclusion about spectral changes to be derived.
5.3 Observation 3
The power-law model yields a and Galactic absorption (=61.16 for 48 dof). The observed flux in the 2-10 keV band for this model is 2.72 , which corresponds to a luminosity of 6.02 in the same band. In the energy range 6-7 keV there is some evidence for residuals. So a Gaussian line was added to the model. The best fit energy for the line is 6.72 keV, clearly inconsistent with the line originating from cold iron. The model is acceptable (=56.31 for 46 dof) with and an equivalent width for the iron line 394 eV.
5.4 LECS/PSPC spectra comparison
The ROSAT spectrum is well represented by a single power-law with , steeper than the BeppoSAX spectrum (). However due to the poor statistics of the LECS data compared to the MECS, the spectral slope of the former is probably driven by the latter and thus the discrepancy might not be real. Therefore, in order to check whether the PSPC and LECS slopes are inconsistent, we fit the LECS data alone with a single power-law model in the 0.12-2.0 keV energy range. The best fit parameters are and Galactic absorption (=3.22 for 6 dof). Due to error uncertainties the slope is consistent with both the PSPC and MECS slopes, and thus any variability between the ROSAT and BeppoSAX observations as well as any spectral upturn within the BeppoSAX observations cannot be examined.
6 Discussion
Mrk609 displays an X-ray continuum, which is somewhat at odds with its optically composite nature. A simple power-law is a good description of the data over the whole 0.1-10 keV energy range, with a rather flat index (). Still, this value is not inconsistent with those encountered in Seyfert-1 spectra (Nandra & Pounds 1994). Moreover no iron emission line was detected when all three observations are fitted together and the upper limit of the equivalent width of the line is 283 eV. For the third observation, where the data-to-model ratio shows line like residuals in the 6-7 keV band, the inclusion of the iron line improves the fit significantly. The best fit line is 6.72 keV with an equivalent width of 394 eV. Nevertheless the detection of significant X-ray variability confirms that a super-massive black hole resides in Mrk609 and powers the X-ray emission, and rules out significant contribution from a starburst component to the X-ray emission.
The data do not allow us to constrain the X-ray column density and we obtain a 90 per cent upper limit of . However, optical and ultraviolet observations are in favour of low obscuration towards the central engine. Indeed, Rudy et al. (1988) find a high ratio, implying that the optical redenning is negligible.
Recently Levenson et al. 2001, proposed an ’obscuring starburst model’ to explain the multiwavelength properties of the composite galaxy NGC6221. According to their model NGC6221 is a Seyfert 1 galaxy which is surrounded by a starburst component. The starburst accounts for the X-ray obscuration (N 1022) and its characteristics dominate the optical spectrum. Although in principal this model can explain qualitatively the optical appearance of the composite galaxies it doesn’t seem to fit the X-ray observations of Mrk609. Our object does not show concrete evidence for significant X-ray absorption. In addition the soft X-ray variability and the high luminosity at low energies (L2) probably rule out a dusty obscuring circumnuclear starburst. We note here that the spectral X-ray properties of Mrk609 are similar to the composite IRAS00317-2142 (Georgantopoulos et al. 2000). Again this galaxy has a low column density, consistent with the Galactic, and thus the obscuring starburst model cannot explain the properties of IRAS00317-2142.
Although the single power-law model yields a good representation of the Mrk609 spectrum the X-ray long term variability indicates that the spectrum of Mrk609 consists of more than one components. An AGN covered by a warm absorbing screen could provide an explanation for the observed long term variability. In this case changes in the X-ray continuum flux, will be followed by changes in the ionisation state of the warm absorber resulting in changes in the emission in the soft band. However, the quality of the data does not allow to examine the viability of the model to Mrk609.
Given the composite nature of Mrk609 it is natural to investigate whether emission from starburst regions contribute to the X-ray wavelengths. In principle, in a composite starburst-AGN model, the power-law component is heavily absorbed, and thus the star-forming component, which is located outside the obscuring screen, dominates the soft emission. However, when this model is applied to Mrk609 data, no excess absorption above the Galactic is required by the data for the power-law component. In addition the poor quality of the data at energies below 2 keV do not allow us to constrain the temperature of the thermal emission and make an unambiguous estimate of the starburst contribution to the X-ray emission. The strength of the star-forming component can be indirectly estimated from the observed IR flux. The expected X-ray contribution from stars was calculated using the empirical relationship between infrared and X-ray luminosity (equation [2] David, Jones Forman 1992) found in a sample of IRAS galaxies. However, note that some of the infrared (IR) flux could arise from nuclear reprocessed emission from the obscuring medium. Thus any starburst contribution to the X-ray flux derived using the above relation may be overestimated and the derived flux should only be treated as an upper limit. First we calculated the IR luminosities using the fluxes IRAS fluxes at 60 and 100 and equation [1] from David, Jones et al. 1992. We find that the upper limit of the expected contribution of a starburst in the 0.5-4 keV band is 2.75. The luminosity in the same band derived by the spectral fitting is 4.7 , indicating that about half of the soft emission may be due to an intense starburst component. However, the variable soft X-ray emission clearly argues that any starburst contribution in soft energy band should be low.
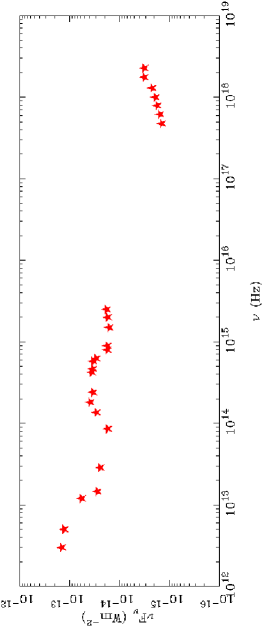
To further test the AGN interpretation of Mrk609 the broad Hα line and the 2-10 keV flux were compared. Ward et al. (1988) found a strong correlation between the two quantities in a sample of IRAS selected Seyfert 1 galaxies. The observed luminosity of the broad Hα is L(Hα)=8.4, whereas the 2-10 keV luminosity is 7.5. According to the above relation the predicted broad Hα luminosity should be 40 times higher. The above discrepancy between the optical and X-ray spectrum could be explained by variability. Possibly the AGN was weaker during the optical observation (1984), but brightened over the 15 years timescale between the optical and X-ray observations. Alternatively the source may have unusually low UV emission. Then the photoionised emission lines would have lower fluxes than those typical for AGNs. To examine this possibility the Mrk609 spectral energy distribution (SED) was computed. This is shown in Figure 3. It is indeed clear that Mrk609 lacks a big blue bump (BBB). This feature is characteristic of high luminosity unobscured AGNs and is thought to be a signature of the presence of a cold accretion disk around the black hole (see Koratkar Blaes 1999). We note here that lack of ultraviolet excess has also been observed in a sample of low-luminosity AGN (Ho 1999). Low accretion rate models have been employed to account for the absence of the BBB feature. Note that Mrk609 has a very strong line (Rudy et al. 1988). The abnormally strong line and anomalous emission line strengths in Mrk609 could be explained if the optical depth and ionisation parameter in the region where the lines form is significantly less than believed typical for Seyfert-1 galaxies. In this scenario the discrepancy between the optical and X-ray spectrum could be explained. Using Pa spectroscopy Goodrich (1990) and Rix et al. (1990) showed that Mrk609 line properties are indeed well explained by the optical depth/ionisation parameter theory.
As mentioned in the introduction the optical spectrum of the composite objects like Mrk609 bear close resemblance to the narrow line X-ray galaxies detected in ROSAT surveys. The X-ray spectrum of these sources is flat (Almaini et al. 1996) but it is unclear whether the flatness of the spectrum is intrinsic or due to obscuration. On the other hand, our observations show that Mrk609 has a relatively steep X-ray spectrum and no significant X-ray absorption. If the narrow line X-ray galaxies detected in ROSAT surveys have X-ray spectra similar to Mrk609 then they should not contribute significantly to the XRB.
7 summary
We have analysed BeppoSAX data of the composite galaxy Mrk609. The spectrum is described by a power-law with negligible absorption. The absence of absorption is consistent with the small Balmer decrement and the large flux observed (Rudy et al. 1988). The absence of an obscuring column clearly does not fit the absorbed starburst model proposed by Levenson et al. 2001 to explain the multiwavelength properties of the composite galaxy NGC6221. The detection of significant soft and hard X-ray variability, clearly suggests that the AGN emission dominates the X-ray spectrum. Any starburst contribution to the X-ray emission should be small. In addition Mrk609 does not follow the correlation of bright AGN (Ward et al. 1988), showing a weak broad Hα component (40 times less than predicted by the X-ray flux). The discrepancy between the optical and X-ray spectrum can be explained as a deficit of UV ionising photons. This is supported by the SED, which shows no upturn of the spectrum below , implying the absence of a UV bump. Alternatively, as the optical and the X-ray observations were taken 15 years apart, dramatic variability in the X-ray flux could result in a low ratio. Finally the above discrepancy and anomalous line properties could be explained by small optical depth and ionisation parameter in the line emitting regions.
8 Acknowledgments
We would like to thank the referee Dr. J. Halpern for useful comments and suggestions and A. Burston for producing the SED of Mrk609.
References
- [1] Almaini O., Shanks T., Boyle B. J., Griffiths R. E., Roche N., Stewart G. C., Georgantopoulos I., 1996, MNRAS, 282, 295
- [2] Boyle B.J., McMahon R.G., Wilkes B.J., Elvis, M., 1995, MNRAS, 276, 315
- [3] Brandt W.N., Fabian A.C., Takahashi K., Fujimoto R., Yamashita A., Inoue H., Ogasaka Y.,1997, MNRAS, 290, 617
- [4] David L. P., Jones C., Forman W., 1992, APJ, 181, 1513
- [5] Georgantopoulos, I. 2000, MNRAS, 315, 77
- [6] Goodrich R.W., 1990, ApJ, 355, 88
- [7] Griffiths R. E., Georgantopoulos I., Boyle B. J., Stewart G. C., Shanks T., della Ceca R., 1996, MNRAS, 275, 77
- [8] Heckman T.M., Miley G.K., van Breugel W.J.M,. Butcher H.R, 1981, ApJ, 247, 403
- [9] Iwasawa K., Fabian A.C., Brandt W. N., Crawford C. S., Almaini O., 1997, MNRAS, 291, L17
- [10] Koratkar A. Blaes O., 1999, PASP, 111, 1
- [11] Levenson N.A., Cid Fernandes R. Jr., Weaver K.A., Heckman T.M., Storchi-Bergmann T., 2001, astro-ph/0104316
- [12] Moran E., Halpern J. P, Helfand D. J., 1996, ApJS, 106, 341
- [13] Nandra K. & Pounds K., 1994, MNRAS, 268, 405
- [14] Osterbrock D. E., 1981, ApJ, 249, 462
- [15] Rix H-W., Carleton N.P., Rieke G., Rieke M., 1990, ApJ, 363, 480
- [16] Rudy, R. J., Cohen R. D., Ake T. B., 1988, ApJ, 332, 172
- [17] Veilleux S., Osterbrock D.E., 1987, ApJS, 63, 295
- [18] Veron P., Goncalves A. C., Veron-Cetty M.-P., 1997, AA, 319, 52
- [19] Ward M. J., Done C., Fabian A. C., Tennant A. F., Shafer R. A., 1988, Apj, 324, 767